
By CountingPips.com COT Home | Data Tables | Data Downloads | Newsletter
Here are the latest charts and statistics for the Commitment of Traders (COT) data published by the Commodities Futures Trading Commission (CFTC).
The latest COT data is updated through Tuesday April 27 2021 and shows a quick view of how large traders (for-profit speculators and commercial entities) were positioned in the futures markets.
CORN Futures:
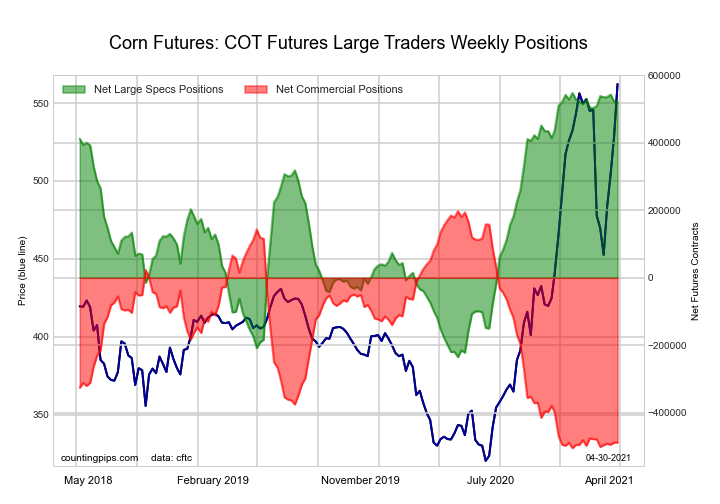
The CORN large speculator standing this week equaled a net position of 521,563 contracts in the data reported through Tuesday. This was a weekly decline of -1,182 contracts from the previous week which had a total of 522,745 net contracts.
This week’s current strength score (the trader positioning range over the past three years, measured from 0 to 100) shows the speculators are currently Bullish-Extreme with a score of 96.7 percent. The commercials are Bearish-Extreme with a score of 2.4 percent and the small traders (not shown in chart) are Bearish with a score of 28.6 percent.
| CORN Futures Statistics | SPECULATORS | COMMERCIALS | SMALL TRADERS |
| – Percent of Open Interest Longs: | 35.0 | 44.9 | 8.8 |
| – Percent of Open Interest Shorts: | 4.3 | 73.7 | 10.8 |
| – Net Position: | 521,563 | -488,359 | -33,204 |
| – Gross Longs: | 594,192 | 762,729 | 150,258 |
| – Gross Shorts: | 72,629 | 1,251,088 | 183,462 |
| – Long to Short Ratio: | 8.2 to 1 | 0.6 to 1 | 0.8 to 1 |
| NET POSITION TREND: | |||
| – COT Index Score (3 Year Range Pct): | 96.7 | 2.4 | 28.6 |
| – COT Index Reading (3 Year Range): | Bullish-Extreme | Bearish-Extreme | Bearish |
| NET POSITION MOVEMENT INDEX: | |||
| – 6-Week Change in Strength Index: | 1.6 | -1.4 | -1.5 |
Free Reports:
 Download Our Metatrader 4 Indicators – Put Our Free MetaTrader 4 Custom Indicators on your charts when you join our Weekly Newsletter
 Get our Weekly Commitment of Traders Reports - See where the biggest traders (Hedge Funds and Commercial Hedgers) are positioned in the futures markets on a weekly basis.
SUGAR Futures:
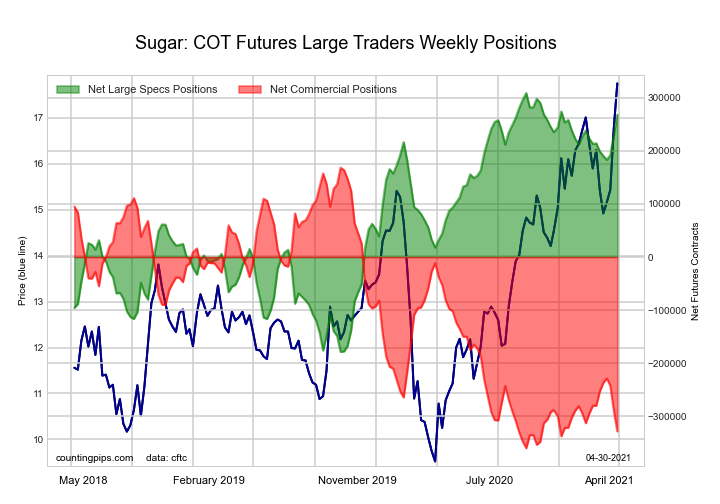
The SUGAR large speculator standing this week equaled a net position of 267,768 contracts in the data reported through Tuesday. This was a weekly increase of 38,599 contracts from the previous week which had a total of 229,169 net contracts.
This week’s current strength score (the trader positioning range over the past three years, measured from 0 to 100) shows the speculators are currently Bullish-Extreme with a score of 91.6 percent. The commercials are Bearish-Extreme with a score of 6.0 percent and the small traders (not shown in chart) are Bullish-Extreme with a score of 82.2 percent.
| SUGAR Futures Statistics | SPECULATORS | COMMERCIALS | SMALL TRADERS |
| – Percent of Open Interest Longs: | 30.5 | 47.8 | 9.4 |
| – Percent of Open Interest Shorts: | 4.3 | 79.9 | 3.5 |
| – Net Position: | 267,768 | -327,943 | 60,175 |
| – Gross Longs: | 311,478 | 488,476 | 95,799 |
| – Gross Shorts: | 43,710 | 816,419 | 35,624 |
| – Long to Short Ratio: | 7.1 to 1 | 0.6 to 1 | 2.7 to 1 |
| NET POSITION TREND: | |||
| – COT Index Score (3 Year Range Pct): | 91.6 | 6.0 | 82.2 |
| – COT Index Reading (3 Year Range): | Bullish-Extreme | Bearish-Extreme | Bullish-Extreme |
| NET POSITION MOVEMENT INDEX: | |||
| – 6-Week Change in Strength Index: | 11.1 | -9.2 | -7.0 |
COFFEE Futures:
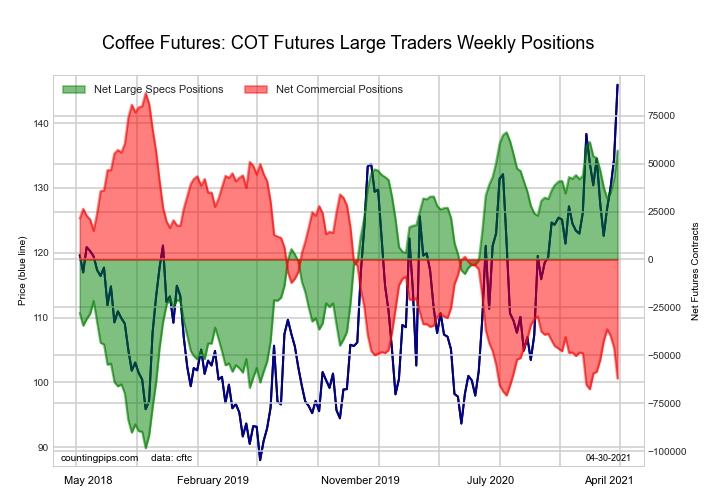
The COFFEE large speculator standing this week equaled a net position of 56,809 contracts in the data reported through Tuesday. This was a weekly advance of 14,707 contracts from the previous week which had a total of 42,102 net contracts.
This week’s current strength score (the trader positioning range over the past three years, measured from 0 to 100) shows the speculators are currently Bullish-Extreme with a score of 94.2 percent. The commercials are Bearish-Extreme with a score of 5.6 percent and the small traders (not shown in chart) are Bearish with a score of 25.2 percent.
| COFFEE Futures Statistics | SPECULATORS | COMMERCIALS | SMALL TRADERS |
| – Percent of Open Interest Longs: | 27.2 | 48.0 | 4.2 |
| – Percent of Open Interest Shorts: | 6.9 | 70.2 | 2.3 |
| – Net Position: | 56,809 | -62,131 | 5,322 |
| – Gross Longs: | 76,107 | 134,229 | 11,627 |
| – Gross Shorts: | 19,298 | 196,360 | 6,305 |
| – Long to Short Ratio: | 3.9 to 1 | 0.7 to 1 | 1.8 to 1 |
| NET POSITION TREND: | |||
| – COT Index Score (3 Year Range Pct): | 94.2 | 5.6 | 25.2 |
| – COT Index Reading (3 Year Range): | Bullish-Extreme | Bearish-Extreme | Bearish |
| NET POSITION MOVEMENT INDEX: | |||
| – 6-Week Change in Strength Index: | 2.3 | -2.3 | -1.6 |
SOYBEANS Futures:

The SOYBEANS large speculator standing this week equaled a net position of 250,633 contracts in the data reported through Tuesday. This was a weekly rise of 7,471 contracts from the previous week which had a total of 243,162 net contracts.
This week’s current strength score (the trader positioning range over the past three years, measured from 0 to 100) shows the speculators are currently Bullish-Extreme with a score of 92.2 percent. The commercials are Bearish-Extreme with a score of 7.4 percent and the small traders (not shown in chart) are Bullish with a score of 73.7 percent.
| SOYBEANS Futures Statistics | SPECULATORS | COMMERCIALS | SMALL TRADERS |
| – Percent of Open Interest Longs: | 35.5 | 42.1 | 7.9 |
| – Percent of Open Interest Shorts: | 6.0 | 71.4 | 8.2 |
| – Net Position: | 250,633 | -248,464 | -2,169 |
| – Gross Longs: | 301,810 | 357,692 | 67,268 |
| – Gross Shorts: | 51,177 | 606,156 | 69,437 |
| – Long to Short Ratio: | 5.9 to 1 | 0.6 to 1 | 1.0 to 1 |
| NET POSITION TREND: | |||
| – COT Index Score (3 Year Range Pct): | 92.2 | 7.4 | 73.7 |
| – COT Index Reading (3 Year Range): | Bullish-Extreme | Bearish-Extreme | Bullish |
| NET POSITION MOVEMENT INDEX: | |||
| – 6-Week Change in Strength Index: | 7.2 | -8.6 | 10.1 |
SOYBEAN OIL Futures:
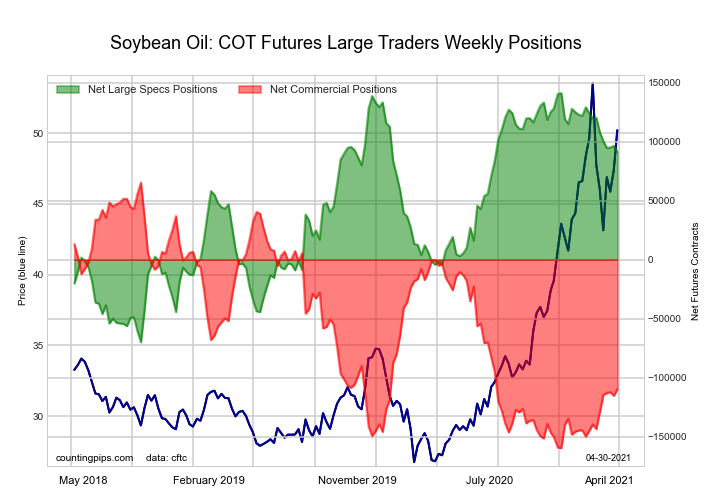
The SOYBEAN OIL large speculator standing this week equaled a net position of 91,289 contracts in the data reported through Tuesday. This was a weekly reduction of -5,175 contracts from the previous week which had a total of 96,464 net contracts.
This week’s current strength score (the trader positioning range over the past three years, measured from 0 to 100) shows the speculators are currently Bullish with a score of 76.4 percent. The commercials are Bearish with a score of 22.1 percent and the small traders (not shown in chart) are Bullish-Extreme with a score of 82.3 percent.
| SOYBEAN OIL Futures Statistics | SPECULATORS | COMMERCIALS | SMALL TRADERS |
| – Percent of Open Interest Longs: | 26.7 | 48.6 | 8.7 |
| – Percent of Open Interest Shorts: | 7.8 | 71.3 | 4.8 |
| – Net Position: | 91,289 | -109,751 | 18,462 |
| – Gross Longs: | 129,305 | 235,680 | 41,950 |
| – Gross Shorts: | 38,016 | 345,431 | 23,488 |
| – Long to Short Ratio: | 3.4 to 1 | 0.7 to 1 | 1.8 to 1 |
| NET POSITION TREND: | |||
| – COT Index Score (3 Year Range Pct): | 76.4 | 22.1 | 82.3 |
| – COT Index Reading (3 Year Range): | Bullish | Bearish | Bullish-Extreme |
| NET POSITION MOVEMENT INDEX: | |||
| – 6-Week Change in Strength Index: | -13.7 | 14.9 | -17.7 |
SOYBEAN MEAL Futures:
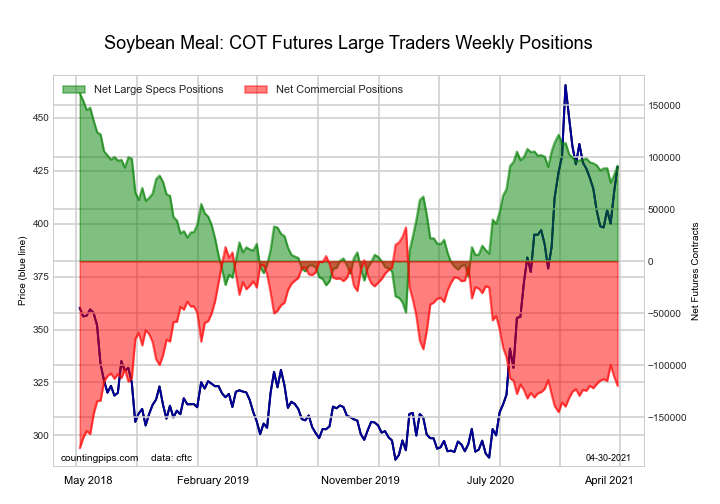
The SOYBEAN MEAL large speculator standing this week equaled a net position of 91,925 contracts in the data reported through Tuesday. This was a weekly rise of 9,016 contracts from the previous week which had a total of 82,909 net contracts.
This week’s current strength score (the trader positioning range over the past three years, measured from 0 to 100) shows the speculators are currently Bullish with a score of 66.9 percent. The commercials are Bearish with a score of 28.2 percent and the small traders (not shown in chart) are Bullish-Extreme with a score of 82.4 percent.
| SOYBEAN MEAL Futures Statistics | SPECULATORS | COMMERCIALS | SMALL TRADERS |
| – Percent of Open Interest Longs: | 25.7 | 47.7 | 12.8 |
| – Percent of Open Interest Shorts: | 3.0 | 77.3 | 6.0 |
| – Net Position: | 91,925 | -119,804 | 27,879 |
| – Gross Longs: | 103,992 | 193,345 | 52,074 |
| – Gross Shorts: | 12,067 | 313,149 | 24,195 |
| – Long to Short Ratio: | 8.6 to 1 | 0.6 to 1 | 2.2 to 1 |
| NET POSITION TREND: | |||
| – COT Index Score (3 Year Range Pct): | 66.9 | 28.2 | 82.4 |
| – COT Index Reading (3 Year Range): | Bullish | Bearish | Bullish-Extreme |
| NET POSITION MOVEMENT INDEX: | |||
| – 6-Week Change in Strength Index: | -0.1 | -0.9 | 8.5 |
LIVE CATTLE Futures:
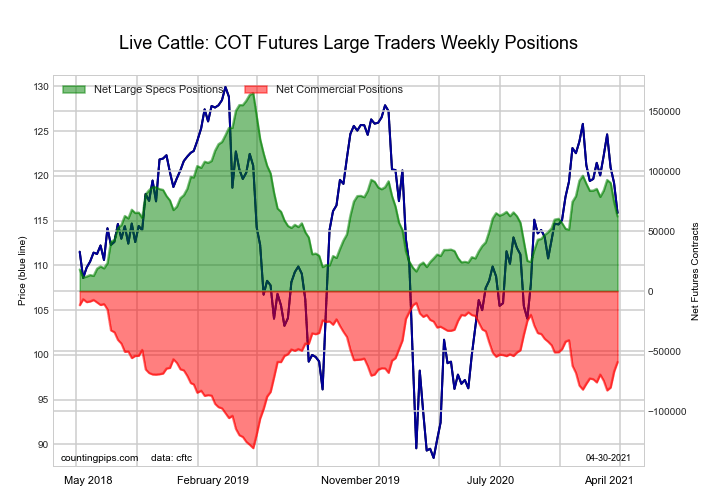
The LIVE CATTLE large speculator standing this week equaled a net position of 62,254 contracts in the data reported through Tuesday. This was a weekly fall of -11,951 contracts from the previous week which had a total of 74,205 net contracts.
This week’s current strength score (the trader positioning range over the past three years, measured from 0 to 100) shows the speculators are currently Bearish with a score of 33.1 percent. The commercials are Bullish with a score of 57.9 percent and the small traders (not shown in chart) are Bullish with a score of 79.2 percent.
| LIVE CATTLE Futures Statistics | SPECULATORS | COMMERCIALS | SMALL TRADERS |
| – Percent of Open Interest Longs: | 36.0 | 36.9 | 10.3 |
| – Percent of Open Interest Shorts: | 16.9 | 55.0 | 11.3 |
| – Net Position: | 62,254 | -58,995 | -3,259 |
| – Gross Longs: | 117,365 | 120,381 | 33,414 |
| – Gross Shorts: | 55,111 | 179,376 | 36,673 |
| – Long to Short Ratio: | 2.1 to 1 | 0.7 to 1 | 0.9 to 1 |
| NET POSITION TREND: | |||
| – COT Index Score (3 Year Range Pct): | 33.1 | 57.9 | 79.2 |
| – COT Index Reading (3 Year Range): | Bearish | Bullish | Bullish |
| NET POSITION MOVEMENT INDEX: | |||
| – 6-Week Change in Strength Index: | -15.0 | 13.7 | 14.7 |
LEAN HOGS Futures:

The LEAN HOGS large speculator standing this week equaled a net position of 78,062 contracts in the data reported through Tuesday. This was a weekly decrease of -1,715 contracts from the previous week which had a total of 79,777 net contracts.
This week’s current strength score (the trader positioning range over the past three years, measured from 0 to 100) shows the speculators are currently Bullish-Extreme with a score of 93.7 percent. The commercials are Bearish-Extreme with a score of 7.7 percent and the small traders (not shown in chart) are Bearish with a score of 39.9 percent.
| LEAN HOGS Futures Statistics | SPECULATORS | COMMERCIALS | SMALL TRADERS |
| – Percent of Open Interest Longs: | 40.2 | 29.9 | 8.8 |
| – Percent of Open Interest Shorts: | 12.8 | 54.5 | 11.6 |
| – Net Position: | 78,062 | -70,091 | -7,971 |
| – Gross Longs: | 114,464 | 85,099 | 25,123 |
| – Gross Shorts: | 36,402 | 155,190 | 33,094 |
| – Long to Short Ratio: | 3.1 to 1 | 0.5 to 1 | 0.8 to 1 |
| NET POSITION TREND: | |||
| – COT Index Score (3 Year Range Pct): | 93.7 | 7.7 | 39.9 |
| – COT Index Reading (3 Year Range): | Bullish-Extreme | Bearish-Extreme | Bearish |
| NET POSITION MOVEMENT INDEX: | |||
| – 6-Week Change in Strength Index: | -2.8 | 3.1 | -2.1 |
COTTON Futures:
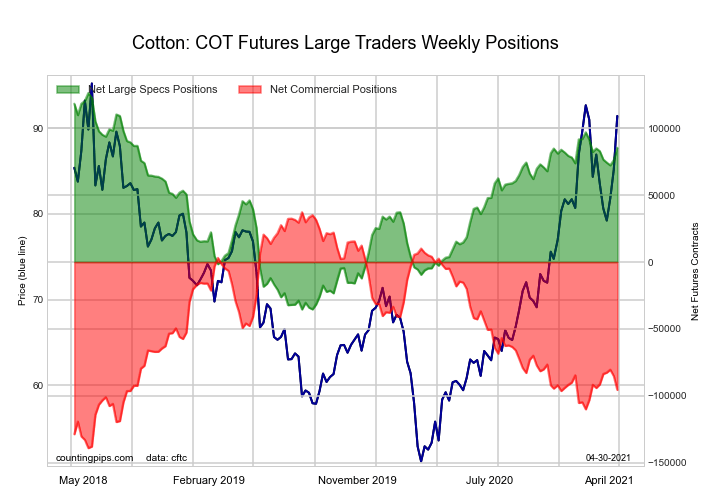
The COTTON large speculator standing this week equaled a net position of 85,453 contracts in the data reported through Tuesday. This was a weekly advance of 9,257 contracts from the previous week which had a total of 76,196 net contracts.
This week’s current strength score (the trader positioning range over the past three years, measured from 0 to 100) shows the speculators are currently Bullish with a score of 74.7 percent. The commercials are Bearish with a score of 24.7 percent and the small traders (not shown in chart) are Bullish with a score of 71.5 percent.
| COTTON Futures Statistics | SPECULATORS | COMMERCIALS | SMALL TRADERS |
| – Percent of Open Interest Longs: | 42.4 | 40.4 | 7.8 |
| – Percent of Open Interest Shorts: | 3.7 | 83.7 | 3.3 |
| – Net Position: | 85,453 | -95,543 | 10,090 |
| – Gross Longs: | 93,587 | 89,215 | 17,322 |
| – Gross Shorts: | 8,134 | 184,758 | 7,232 |
| – Long to Short Ratio: | 11.5 to 1 | 0.5 to 1 | 2.4 to 1 |
| NET POSITION TREND: | |||
| – COT Index Score (3 Year Range Pct): | 74.7 | 24.7 | 71.5 |
| – COT Index Reading (3 Year Range): | Bullish | Bearish | Bullish |
| NET POSITION MOVEMENT INDEX: | |||
| – 6-Week Change in Strength Index: | 0.3 | -0.8 | 5.4 |
COCOA Futures:
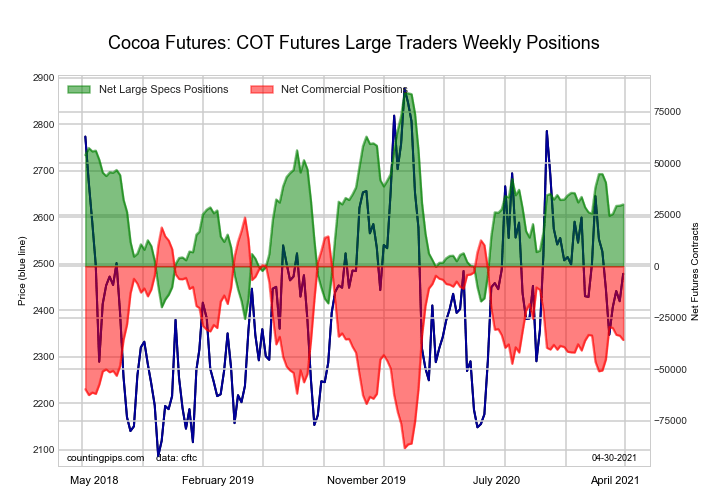
The COCOA large speculator standing this week equaled a net position of 29,968 contracts in the data reported through Tuesday. This was a weekly increase of 553 contracts from the previous week which had a total of 29,415 net contracts.
This week’s current strength score (the trader positioning range over the past three years, measured from 0 to 100) shows the speculators are currently Bullish with a score of 50.7 percent. The commercials are Bearish with a score of 46.9 percent and the small traders (not shown in chart) are Bullish with a score of 74.6 percent.
| COCOA Futures Statistics | SPECULATORS | COMMERCIALS | SMALL TRADERS |
| – Percent of Open Interest Longs: | 32.1 | 42.7 | 6.1 |
| – Percent of Open Interest Shorts: | 16.8 | 61.0 | 3.1 |
| – Net Position: | 29,968 | -35,781 | 5,813 |
| – Gross Longs: | 62,757 | 83,473 | 11,867 |
| – Gross Shorts: | 32,789 | 119,254 | 6,054 |
| – Long to Short Ratio: | 1.9 to 1 | 0.7 to 1 | 2.0 to 1 |
| NET POSITION TREND: | |||
| – COT Index Score (3 Year Range Pct): | 50.7 | 46.9 | 74.6 |
| – COT Index Reading (3 Year Range): | Bullish | Bearish | Bullish |
| NET POSITION MOVEMENT INDEX: | |||
| – 6-Week Change in Strength Index: | -13.5 | 13.2 | -0.1 |
WHEAT Futures:
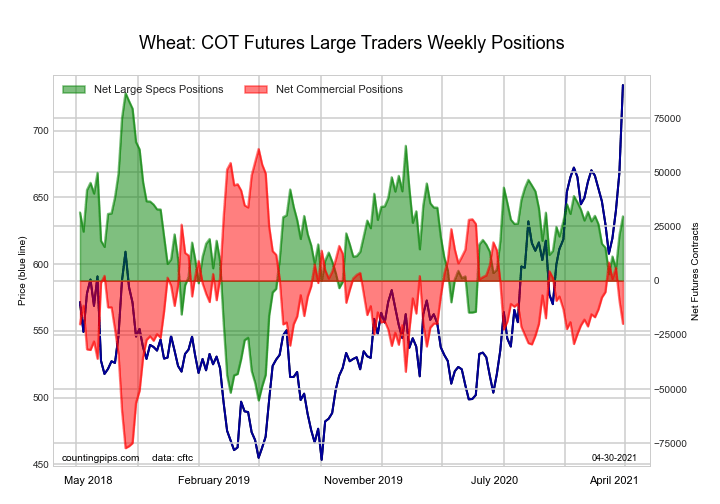
The WHEAT large speculator standing this week equaled a net position of 29,704 contracts in the data reported through Tuesday. This was a weekly boost of 8,679 contracts from the previous week which had a total of 21,025 net contracts.
This week’s current strength score (the trader positioning range over the past three years, measured from 0 to 100) shows the speculators are currently Bullish with a score of 59.9 percent. The commercials are Bearish with a score of 41.6 percent and the small traders (not shown in chart) are Bullish with a score of 54.5 percent.
| WHEAT Futures Statistics | SPECULATORS | COMMERCIALS | SMALL TRADERS |
| – Percent of Open Interest Longs: | 32.7 | 36.6 | 7.2 |
| – Percent of Open Interest Shorts: | 25.7 | 41.2 | 9.5 |
| – Net Position: | 29,704 | -19,855 | -9,849 |
| – Gross Longs: | 138,786 | 155,444 | 30,614 |
| – Gross Shorts: | 109,082 | 175,299 | 40,463 |
| – Long to Short Ratio: | 1.3 to 1 | 0.9 to 1 | 0.8 to 1 |
| NET POSITION TREND: | |||
| – COT Index Score (3 Year Range Pct): | 59.9 | 41.6 | 54.5 |
| – COT Index Reading (3 Year Range): | Bullish | Bearish | Bullish |
| NET POSITION MOVEMENT INDEX: | |||
| – 6-Week Change in Strength Index: | 8.9 | -8.8 | -2.3 |
Article By CountingPips.com – Receive our weekly COT Reports by Email
*COT Report: The COT data, released weekly to the public each Friday, is updated through the most recent Tuesday (data is 3 days old) and shows a quick view of how large speculators or non-commercials (for-profit traders) were positioned in the futures markets.
The CFTC categorizes trader positions according to commercial hedgers (traders who use futures contracts for hedging as part of the business), non-commercials (large traders who speculate to realize trading profits) and nonreportable traders (usually small traders/speculators).
Find CFTC criteria here: (http://www.cftc.gov/MarketReports/CommitmentsofTraders/ExplanatoryNotes/index.htm).

- Geopolitical risks in the Middle East are declining. China kept interest rates at lows Apr 22, 2024
- Brent crude dips to four-week low amid easing geopolitical tensions Apr 22, 2024
- COT Metals Charts: Speculator bets led by Copper & Silver Apr 20, 2024
- COT Bonds Charts: Speculator bets led by 10-Year Bonds & Fed Funds Apr 20, 2024
- COT Stock Market Charts: Speculator bets led by S&P500-Mini Apr 20, 2024
- COT Soft Commodities Charts: Speculator bets led by Soybean Meal & Lean Hogs Apr 20, 2024
- 3 Signs of Developing U.S. Economic Slowdown Apr 19, 2024
- Israel has retaliated against Iran. Investors run to safe assets Apr 19, 2024
- Gold hits record high amid growing geopolitical tensions Apr 19, 2024
- The US natural gas prices fell to a 2-month low. A drop in the technology sector on Wednesday had a negative impact on the broad market Apr 18, 2024