Get our Custom Premium Indicator for Metatrader 4 Platform
* Percent Deviation Indicator & Slope Indicator Included
* Shaded Template Included
Statistical Trend Indicator for MetaTrader 4
Linear Regression Channels Indicator is a custom built indicator for the popular Metatrader 4 platform that displays a linear regression line and outer channels on your chart. Linear regression is a popular statistical technique commonly used in statistics and economics to look for trends within data points. In simple terms, linear regression analysis attempts to best fit a line between the data points (or prices) that occur over a specified time period to determine the trend.
In addition to forecasting trend direction, linear regression channels can signal extreme price levels when prices have moved far away from the linear regression line. In this way, the channels (measured in standard deviations) can be used as an overbought / oversold indicator.
When you buy our Linear Regression Indicator, two complementary indicators are also included.
See details and descriptions for all three indicators below:
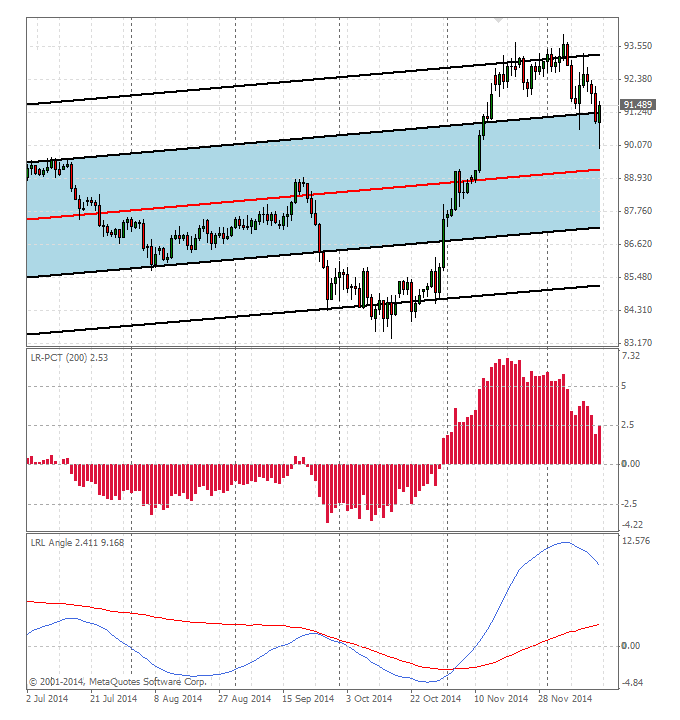
Indicator #1. Linear Regression Line and Channels Indicator
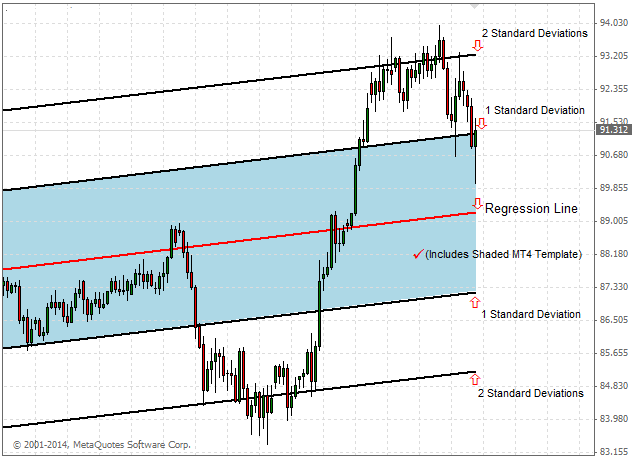
Our main linear regression indicator easily allows you to see where the current trend is going. When you add outer channels, separated by standard deviations, this indicator can also tell you where price is in relationship to the regression line and whether there is overbought / oversold conditions.
This indicator can be utilized on short or long term timeframes and can be a great addition to any trading system. Combine this indicator with complementary technical analysis methods or fundamental analysis approaches to refine your trading approach.
This indicator automatically updates at the close of each bar to adjust to latest data.
INDICATOR FEATURES, INPUTS & OPTIONS:
- Linear Regression Line Period Option
- Standard Deviation Separation of Channels
- # of Channel Lines to be displayed
- Style, color, widths of all lines
- Shift line & channels into future or past
- ex.4 file download format
Indicator #2. Linear Regression Slope Indicator
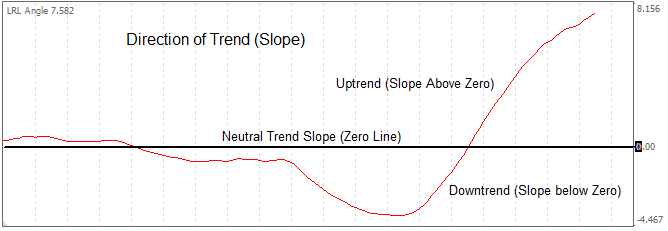
This slope indicator is a simple numerical output of the linear regression line from Indicator #1: (Linear Regression Line and Channels Indicator). This indicator can tell you where the current trend is (uptrend, downtrend, neutral) and how it compares to where the trend has been over a longer cycle.
Add additional lines to compare and contrast the slopes of different time periods. This indicator allows you to compare up to 5 different time periods.
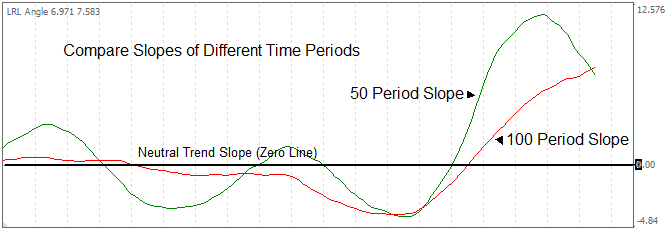
Unlike Indicator #1, this slope indicator will only update on the last closed value and will leave historical trend values intact to better compare current values with the longer term trends.
INDICATOR FEATURES, INPUTS & OPTIONS:
- Compare up to 5 different time periods
- Style & color of all lines
- ex.4 file download format
Indicator #3. Percent Deviation of Price from the Linear Regression Line
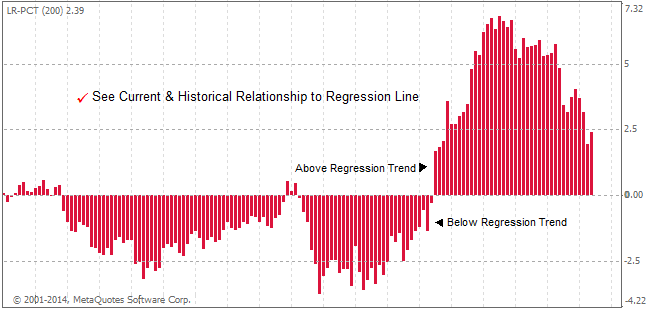
This percent indicator also uses data from the linear regression line of Indicator #1 and can be an effective way to look out for overbought / oversold conditions. This indicator simply shows the relationship of price to the linear regression line. When prices are above the linear regression line, you will see a positive percentage output on the histogram and when prices are below the linear regression line, you will see a negative percentage output on the histogram. Prices far from the regression line will see higher percentage readings while prices trading close to the linear regression line will show an output near zero on the histogram.
This percent indicator will only update the last closed value and will leave historical percent values intact to better compare current values with the longer term trends.
INDICATOR FEATURES, INPUTS & OPTIONS:
- Choose time period
- Style, width & color of all lines
- Draw the regression line: true/false
- ex.4 file download format
Download Includes:
Quick Guide & Instructions included
Indicator #1: Linear Regression Line & Channels
Indicator #2: Linear Regression Slope
Indicator #3: Percent Deviation from the Linear Regression Line
Metatrader 4 Template files: Shaded Areas between standard deviations
Disclaimers: This digital product is not an automated trading system. It is not to be mistaken for an “expert advisor” and does not create orders or place trades for you. This indicator is intended to allow the user to analyze the markets by use of the linear regression statistical data and technique. This product comes with absolutely no guarantee of trading success as trades placed by the user are solely at the discretion of said user. Markets are and can be very volatile.
* Indicator works with Metatrader 4 Platforms only
* Indicator is copyrighted material and can not be distributed without express written consent.
* Indicator comes with no warranty and is subject to our Terms & Conditions

Works with Metatrader 4
Metatrader 4 and MT4 software logo is trademark and copyright of MetaQuotes Software Corp.
Risk Disclosure: Foreign Currency trading and trading on margin carries a high level of risk and can result in loss of part or all of your investment. Due to the level of risk and market volatility, Foreign Currency trading may not be suitable for all investors and you should not invest money you cannot afford to lose. Before deciding to invest in the foreign currency exchange market you should carefully consider your investment objectives, level of experience, and risk appetite. You should be aware of all the risks associated with foreign currency exchange trading, and seek advice from an independent financial advisor should you have any doubts.
All information and opinions on this website are for general informational purposes only and do not constitute investment advice.