
By InvestMacro
Here are the latest charts and statistics for the Commitment of Traders (COT) reports data published by the Commodities Futures Trading Commission (CFTC).
The latest COT data is updated through Tuesday September 20th and shows a quick view of how large traders (for-profit speculators and commercial hedgers) were positioned in the futures markets.
Eurodollar and 10-Year Bond bets rebound in Weekly Speculator Changes

The COT bond market speculator bets were mixed this week as four out of the eight bond markets we cover had higher positioning this week while the other four markets had lower contracts.
Free Reports:
 Get our Weekly Commitment of Traders Reports - See where the biggest traders (Hedge Funds and Commercial Hedgers) are positioned in the futures markets on a weekly basis.
 Download Our Metatrader 4 Indicators – Put Our Free MetaTrader 4 Custom Indicators on your charts when you join our Weekly Newsletter
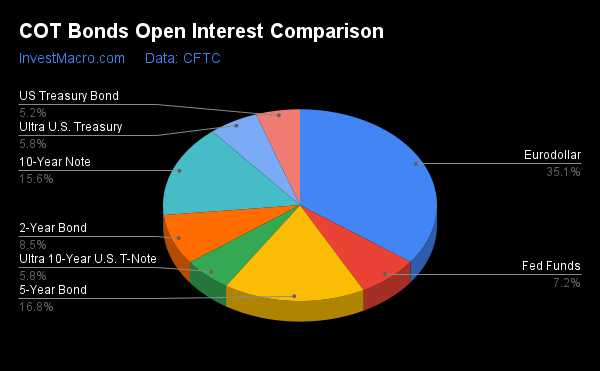
Leading the gains for the bond markets was the Eurodollar (653,551 contracts) with the 10-Year Bond (123,299 contracts), the 5-Year Bond (27,655 contracts) and the 2-Year Bond (15,766 contracts) also showing positive weeks.
The bond markets leading the declines in speculator bets this week was the Fed Funds (-23,797 contracts) with the Ultra 10-Year (-22,022 contracts), the Ultra US Bond (-19,316 contracts) and the Long US Bond (-4,568 contracts) also registering lower bets on the week.
Highlighting the COT Bonds data this week was the rebound in both the Eurodollar and the 10-Year Bonds positioning. Both of these bond markets continue to have very bearish speculator positions and it has been that way since global central banks started to get more hawkish in raising their benchmark interest rates to fight inflation.
The Eurodollar turned from a bullish speculator position to bearish in May of 2021 while the 10-Year saw its speculative positioning flip bullish to bearish in October of 2021.
This week saw sharp gains for each of these markets with the Eurodollar jumping by a total of +653,551 net contracts and the 10-Year by +123,299 net contracts.
The bonds data was heavily influenced by the Federal Reserve’s interest rate decision coming out the next day that resulted in a 75 basis point hike. This likely prompted traders to take off positions that were deemed risky or to try and position for possible surprise outcomes of the Fed meeting.
The Eurodollar speculative change data for that Tuesday was the result of speculators sharply dropping their gross short positions by a total of -709,309 contracts. This is compared to a -55,758 contract decline in the gross long positions.
The 10-Year change, meanwhile, was the result of speculators raising their gross long positions by a total of +100,016 contracts in addition to reducing their gross short contracts by -23,283 to get the weekly net change of 123,299 contracts.
| Sep-20-2022 | OI | OI-Index | Spec-Net | Spec-Index | Com-Net | COM-Index | Smalls-Net | Smalls-Index |
|---|---|---|---|---|---|---|---|---|
| Eurodollar | 8,320,365 | 0 | -2,223,771 | 12 | 2,509,931 | 86 | -286,160 | 41 |
| FedFunds | 1,719,198 | 58 | 24,164 | 43 | -17,273 | 58 | -6,891 | 42 |
| 2-Year | 2,020,402 | 11 | -342,415 | 13 | 438,181 | 100 | -95,766 | 9 |
| Long T-Bond | 1,235,652 | 51 | -99,539 | 52 | 78,958 | 39 | 20,581 | 69 |
| 10-Year | 3,700,929 | 44 | -229,590 | 38 | 342,348 | 63 | -112,758 | 53 |
| 5-Year | 3,974,321 | 50 | -493,804 | 11 | 639,728 | 91 | -145,924 | 41 |
Strength Scores
Strength Scores (a normalized measure of Speculator positions over a 3-Year range, from 0 to 100 where above 80 is extreme bullish and below 20 is extreme bearish) showed that the US Treasury Bond (52.2 percent) leads the bonds category and is the only market above the midpoint of its 3-year range. The Fed Funds (42.6 percent) comes in as the next highest bonds market in strength scores.
On the downside, the 5-Year Bond (10.8 percent), the Eurodollar (12.2 percent) and the 2-Year Bond (13.1 percent) come in at the lowest strength levels currently and are all in bearish extreme positions (below 20 percent).

Strength Statistics:
Fed Funds (42.6 percent) vs Fed Funds previous week (45.5 percent)
2-Year Bond (13.1 percent) vs 2-Year Bond previous week (9.9 percent)
5-Year Bond (10.8 percent) vs 5-Year Bond previous week (6.7 percent)
10-Year Bond (37.5 percent) vs 10-Year Bond previous week (18.8 percent)
Ultra 10-Year Bond (21.3 percent) vs Ultra 10-Year Bond previous week (27.0 percent)
US Treasury Bond (52.2 percent) vs US Treasury Bond previous week (53.7 percent)
Ultra US Treasury Bond (35.9 percent) vs Ultra US Treasury Bond previous week (43.8 percent)
Eurodollar (12.2 percent) vs Eurodollar previous week (0.2 percent)
Strength Trends
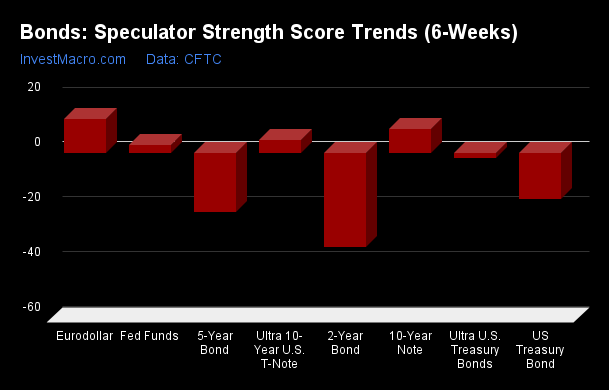
Strength Score Trends (or move index, calculates the 6-week changes in strength scores) show that the Eurodollar (12.2 percent) leads the past six weeks trends for bonds this week. The 10-Year Bond (8.6 percent), the Ultra 10-Year Bond (4.6 percent) and the Fed Funds (2.9 percent) fill out the rest of the positive movers in the latest trends data.
The 2-Year Bond (-34.4 percent) leads the downside trend scores currently while the next market with lower trend scores were the 5-Year Bond (-21.6 percent) followed by the US Treasury Bond (-16.9 percent).
Strength Trend Statistics:
Fed Funds (2.9 percent) vs Fed Funds previous week (6.3 percent)
2-Year Bond (-34.4 percent) vs 2-Year Bond previous week (-52.2 percent)
5-Year Bond (-21.6 percent) vs 5-Year Bond previous week (-28.1 percent)
10-Year Bond (8.6 percent) vs 10-Year Bond previous week (-8.7 percent)
Ultra 10-Year Bond (4.6 percent) vs Ultra 10-Year Bond previous week (7.7 percent)
US Treasury Bond (-16.9 percent) vs US Treasury Bond previous week (-12.7 percent)
Ultra US Treasury Bond (-1.9 percent) vs Ultra US Treasury Bond previous week (2.3 percent)
Eurodollar (12.2 percent) vs Eurodollar previous week (-1.7 percent)
Individual Markets:
3-Month Eurodollars Futures:
 The 3-Month Eurodollars large speculator standing this week recorded a net position of -2,223,771 contracts in the data reported through Tuesday. This was a weekly advance of 653,551 contracts from the previous week which had a total of -2,877,322 net contracts.
This week’s current strength score (the trader positioning range over the past three years, measured from 0 to 100) shows the speculators are currently Bearish-Extreme with a score of 12.2 percent. The commercials are Bullish-Extreme with a score of 85.9 percent and the small traders (not shown in chart) are Bearish with a score of 41.5 percent.
| 3-Month Eurodollars Statistics | SPECULATORS | COMMERCIALS | SMALL TRADERS |
| – Percent of Open Interest Longs: | 6.7 | 69.4 | 4.8 |
| – Percent of Open Interest Shorts: | 33.4 | 39.2 | 8.2 |
| – Net Position: | -2,223,771 | 2,509,931 | -286,160 |
| – Gross Longs: | 556,537 | 5,772,986 | 398,527 |
| – Gross Shorts: | 2,780,308 | 3,263,055 | 684,687 |
| – Long to Short Ratio: | 0.2 to 1 | 1.8 to 1 | 0.6 to 1 |
| NET POSITION TREND: | |||
| – Strength Index Score (3 Year Range Pct): | 12.2 | 85.9 | 41.5 |
| – Strength Index Reading (3 Year Range): | Bearish-Extreme | Bullish-Extreme | Bearish |
| NET POSITION MOVEMENT INDEX: | |||
| – 6-Week Change in Strength Index: | 12.2 | -12.4 | 7.4 |
30-Day Federal Funds Futures:
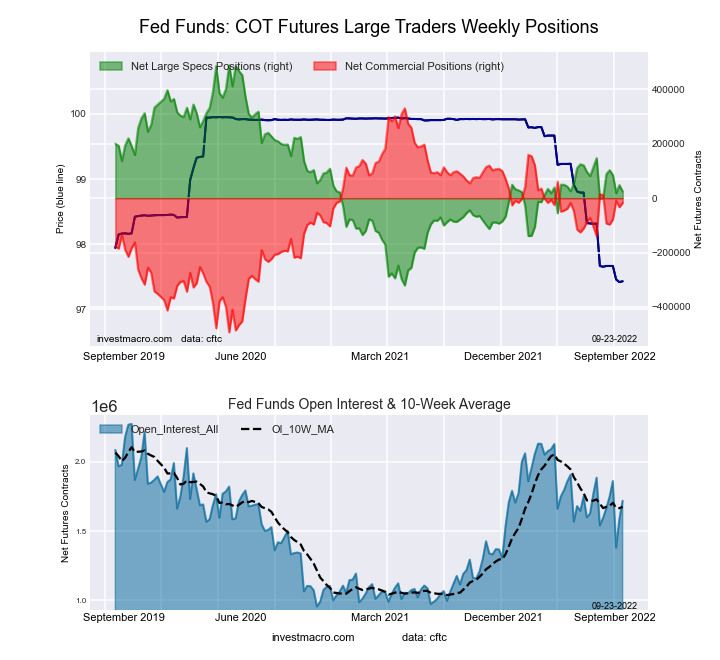 The 30-Day Federal Funds large speculator standing this week recorded a net position of 24,164 contracts in the data reported through Tuesday. This was a weekly fall of -23,797 contracts from the previous week which had a total of 47,961 net contracts.
This week’s current strength score (the trader positioning range over the past three years, measured from 0 to 100) shows the speculators are currently Bearish with a score of 42.6 percent. The commercials are Bullish with a score of 57.8 percent and the small traders (not shown in chart) are Bearish with a score of 42.1 percent.
| 30-Day Federal Funds Statistics | SPECULATORS | COMMERCIALS | SMALL TRADERS |
| – Percent of Open Interest Longs: | 12.7 | 71.7 | 2.3 |
| – Percent of Open Interest Shorts: | 11.3 | 72.7 | 2.7 |
| – Net Position: | 24,164 | -17,273 | -6,891 |
| – Gross Longs: | 217,631 | 1,232,601 | 39,438 |
| – Gross Shorts: | 193,467 | 1,249,874 | 46,329 |
| – Long to Short Ratio: | 1.1 to 1 | 1.0 to 1 | 0.9 to 1 |
| NET POSITION TREND: | |||
| – Strength Index Score (3 Year Range Pct): | 42.6 | 57.8 | 42.1 |
| – Strength Index Reading (3 Year Range): | Bearish | Bullish | Bearish |
| NET POSITION MOVEMENT INDEX: | |||
| – 6-Week Change in Strength Index: | 2.9 | -3.5 | 13.7 |
2-Year Treasury Note Futures:
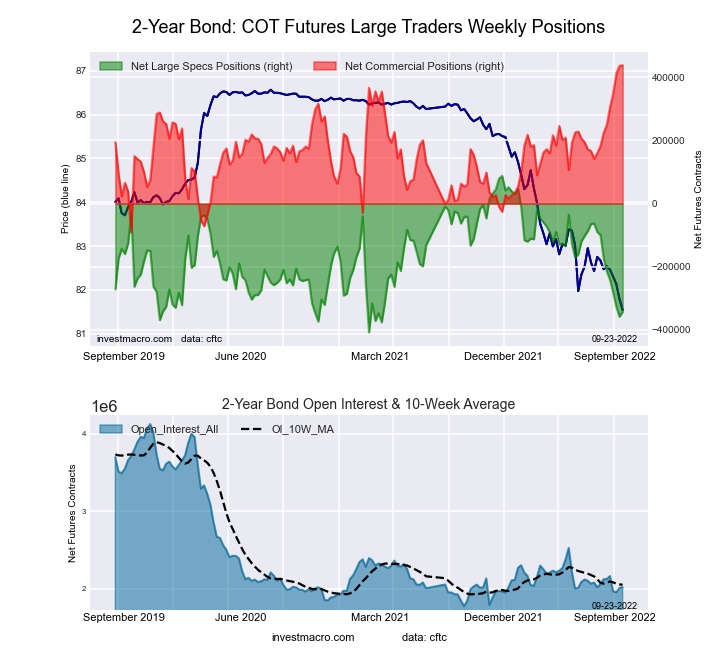 The 2-Year Treasury Note large speculator standing this week recorded a net position of -342,415 contracts in the data reported through Tuesday. This was a weekly boost of 15,766 contracts from the previous week which had a total of -358,181 net contracts.
This week’s current strength score (the trader positioning range over the past three years, measured from 0 to 100) shows the speculators are currently Bearish-Extreme with a score of 13.1 percent. The commercials are Bullish-Extreme with a score of 100.0 percent and the small traders (not shown in chart) are Bearish-Extreme with a score of 8.7 percent.
| 2-Year Treasury Note Statistics | SPECULATORS | COMMERCIALS | SMALL TRADERS |
| – Percent of Open Interest Longs: | 6.9 | 83.6 | 7.6 |
| – Percent of Open Interest Shorts: | 23.8 | 61.9 | 12.4 |
| – Net Position: | -342,415 | 438,181 | -95,766 |
| – Gross Longs: | 139,358 | 1,688,474 | 154,106 |
| – Gross Shorts: | 481,773 | 1,250,293 | 249,872 |
| – Long to Short Ratio: | 0.3 to 1 | 1.4 to 1 | 0.6 to 1 |
| NET POSITION TREND: | |||
| – Strength Index Score (3 Year Range Pct): | 13.1 | 100.0 | 8.7 |
| – Strength Index Reading (3 Year Range): | Bearish-Extreme | Bullish-Extreme | Bearish-Extreme |
| NET POSITION MOVEMENT INDEX: | |||
| – 6-Week Change in Strength Index: | -34.4 | 40.5 | -18.2 |
5-Year Treasury Note Futures:
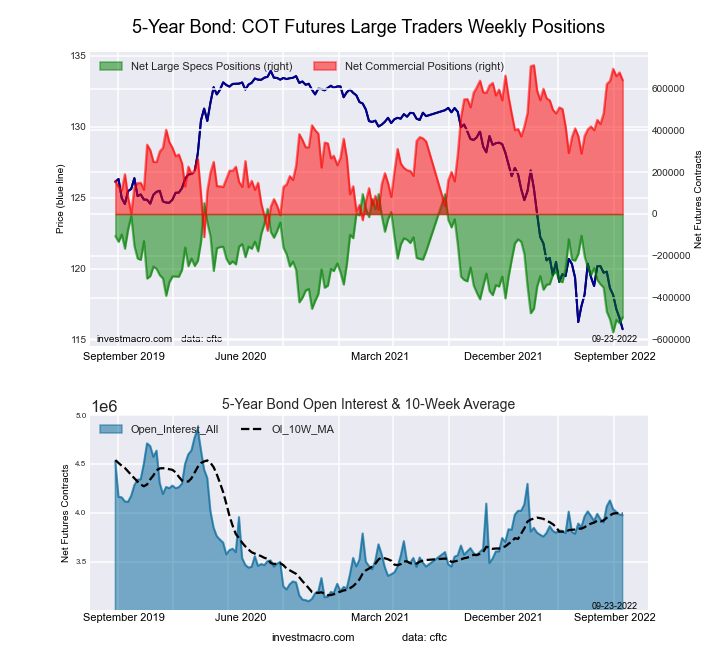 The 5-Year Treasury Note large speculator standing this week recorded a net position of -493,804 contracts in the data reported through Tuesday. This was a weekly rise of 27,655 contracts from the previous week which had a total of -521,459 net contracts.
This week’s current strength score (the trader positioning range over the past three years, measured from 0 to 100) shows the speculators are currently Bearish-Extreme with a score of 10.8 percent. The commercials are Bullish-Extreme with a score of 91.3 percent and the small traders (not shown in chart) are Bearish with a score of 40.9 percent.
| 5-Year Treasury Note Statistics | SPECULATORS | COMMERCIALS | SMALL TRADERS |
| – Percent of Open Interest Longs: | 6.7 | 84.7 | 7.3 |
| – Percent of Open Interest Shorts: | 19.1 | 68.6 | 11.0 |
| – Net Position: | -493,804 | 639,728 | -145,924 |
| – Gross Longs: | 266,452 | 3,366,448 | 291,033 |
| – Gross Shorts: | 760,256 | 2,726,720 | 436,957 |
| – Long to Short Ratio: | 0.4 to 1 | 1.2 to 1 | 0.7 to 1 |
| NET POSITION TREND: | |||
| – Strength Index Score (3 Year Range Pct): | 10.8 | 91.3 | 40.9 |
| – Strength Index Reading (3 Year Range): | Bearish-Extreme | Bullish-Extreme | Bearish |
| NET POSITION MOVEMENT INDEX: | |||
| – 6-Week Change in Strength Index: | -21.6 | 19.3 | -4.3 |
10-Year Treasury Note Futures:
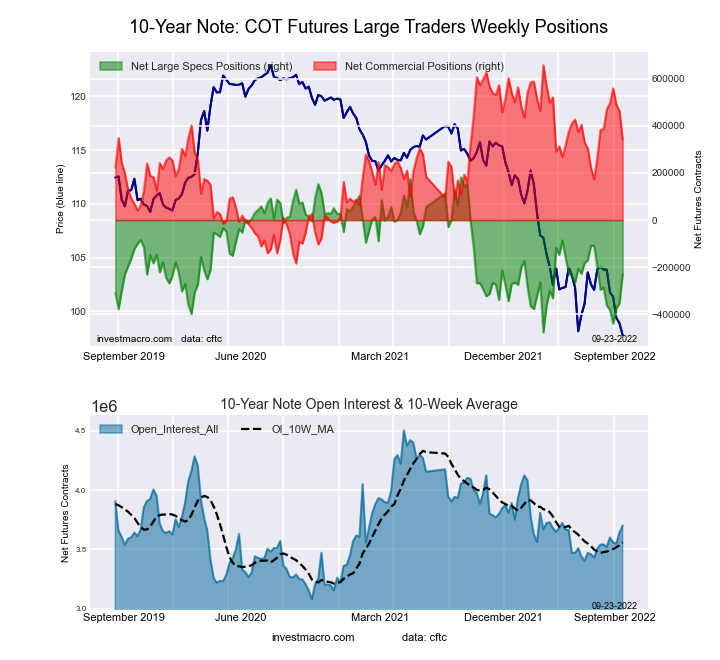 The 10-Year Treasury Note large speculator standing this week recorded a net position of -229,590 contracts in the data reported through Tuesday. This was a weekly gain of 123,299 contracts from the previous week which had a total of -352,889 net contracts.
This week’s current strength score (the trader positioning range over the past three years, measured from 0 to 100) shows the speculators are currently Bearish with a score of 37.5 percent. The commercials are Bullish with a score of 62.6 percent and the small traders (not shown in chart) are Bullish with a score of 53.3 percent.
| 10-Year Treasury Note Statistics | SPECULATORS | COMMERCIALS | SMALL TRADERS |
| – Percent of Open Interest Longs: | 10.7 | 77.5 | 9.0 |
| – Percent of Open Interest Shorts: | 16.9 | 68.2 | 12.1 |
| – Net Position: | -229,590 | 342,348 | -112,758 |
| – Gross Longs: | 397,050 | 2,868,123 | 334,645 |
| – Gross Shorts: | 626,640 | 2,525,775 | 447,403 |
| – Long to Short Ratio: | 0.6 to 1 | 1.1 to 1 | 0.7 to 1 |
| NET POSITION TREND: | |||
| – Strength Index Score (3 Year Range Pct): | 37.5 | 62.6 | 53.3 |
| – Strength Index Reading (3 Year Range): | Bearish | Bullish | Bullish |
| NET POSITION MOVEMENT INDEX: | |||
| – 6-Week Change in Strength Index: | 8.6 | -5.2 | -3.1 |
Ultra 10-Year Notes Futures:
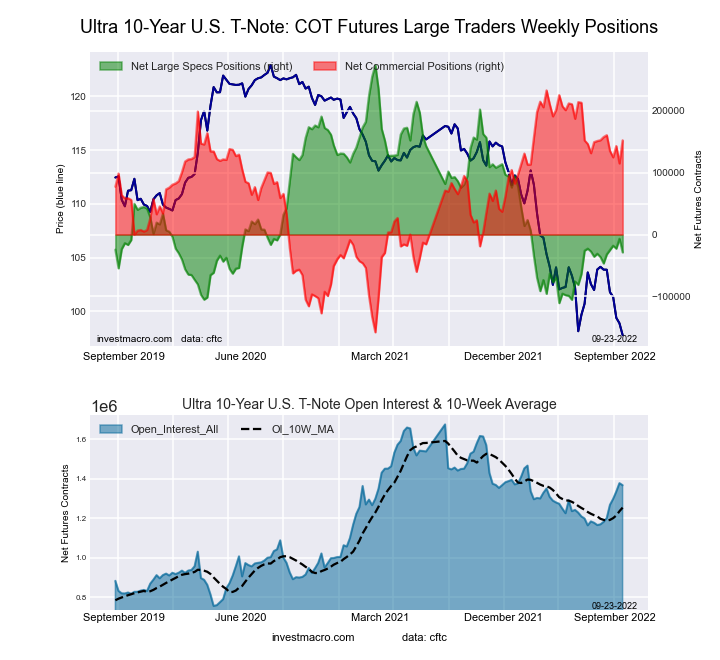 The Ultra 10-Year Notes large speculator standing this week recorded a net position of -28,808 contracts in the data reported through Tuesday. This was a weekly reduction of -22,022 contracts from the previous week which had a total of -6,786 net contracts.
This week’s current strength score (the trader positioning range over the past three years, measured from 0 to 100) shows the speculators are currently Bearish with a score of 21.3 percent. The commercials are Bullish with a score of 79.4 percent and the small traders (not shown in chart) are Bearish with a score of 45.2 percent.
| Ultra 10-Year Notes Statistics | SPECULATORS | COMMERCIALS | SMALL TRADERS |
| – Percent of Open Interest Longs: | 8.3 | 81.1 | 9.0 |
| – Percent of Open Interest Shorts: | 10.4 | 70.0 | 18.0 |
| – Net Position: | -28,808 | 152,285 | -123,477 |
| – Gross Longs: | 113,657 | 1,109,324 | 123,083 |
| – Gross Shorts: | 142,465 | 957,039 | 246,560 |
| – Long to Short Ratio: | 0.8 to 1 | 1.2 to 1 | 0.5 to 1 |
| NET POSITION TREND: | |||
| – Strength Index Score (3 Year Range Pct): | 21.3 | 79.4 | 45.2 |
| – Strength Index Reading (3 Year Range): | Bearish | Bullish | Bearish |
| NET POSITION MOVEMENT INDEX: | |||
| – 6-Week Change in Strength Index: | 4.6 | -1.3 | -8.3 |
US Treasury Bonds Futures:
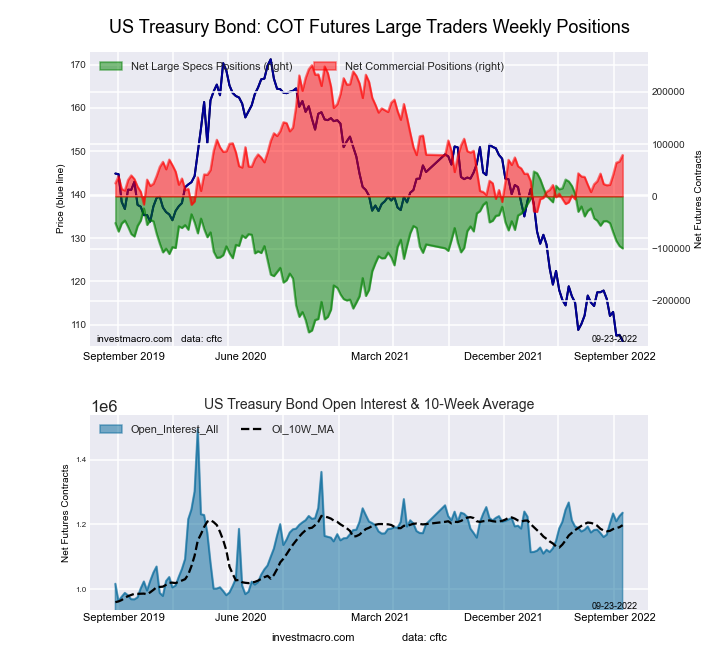 The US Treasury Bonds large speculator standing this week recorded a net position of -99,539 contracts in the data reported through Tuesday. This was a weekly fall of -4,568 contracts from the previous week which had a total of -94,971 net contracts.
This week’s current strength score (the trader positioning range over the past three years, measured from 0 to 100) shows the speculators are currently Bullish with a score of 52.2 percent. The commercials are Bearish with a score of 38.8 percent and the small traders (not shown in chart) are Bullish with a score of 68.9 percent.
| US Treasury Bonds Statistics | SPECULATORS | COMMERCIALS | SMALL TRADERS |
| – Percent of Open Interest Longs: | 6.2 | 77.1 | 13.8 |
| – Percent of Open Interest Shorts: | 14.2 | 70.7 | 12.2 |
| – Net Position: | -99,539 | 78,958 | 20,581 |
| – Gross Longs: | 76,399 | 952,947 | 170,936 |
| – Gross Shorts: | 175,938 | 873,989 | 150,355 |
| – Long to Short Ratio: | 0.4 to 1 | 1.1 to 1 | 1.1 to 1 |
| NET POSITION TREND: | |||
| – Strength Index Score (3 Year Range Pct): | 52.2 | 38.8 | 68.9 |
| – Strength Index Reading (3 Year Range): | Bullish | Bearish | Bullish |
| NET POSITION MOVEMENT INDEX: | |||
| – 6-Week Change in Strength Index: | -16.9 | 19.8 | -2.9 |
Ultra US Treasury Bonds Futures:
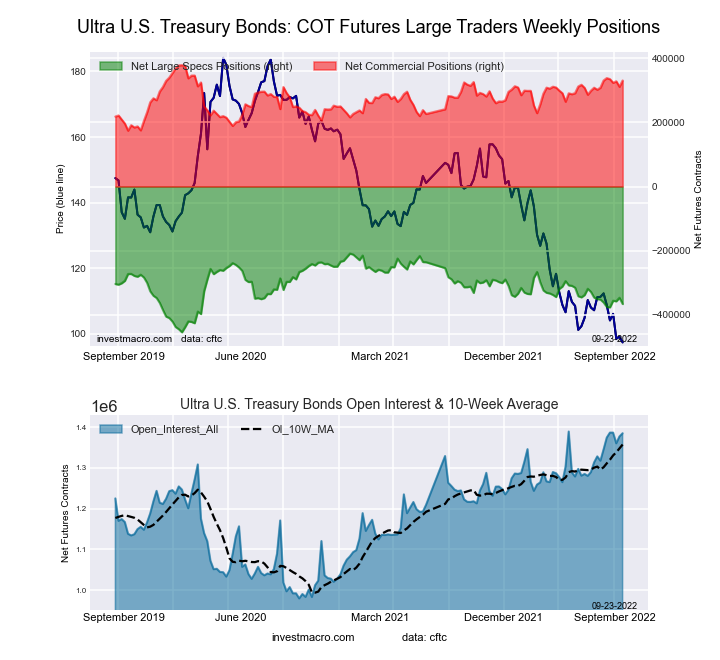 The Ultra US Treasury Bonds large speculator standing this week recorded a net position of -365,913 contracts in the data reported through Tuesday. This was a weekly fall of -19,316 contracts from the previous week which had a total of -346,597 net contracts.
This week’s current strength score (the trader positioning range over the past three years, measured from 0 to 100) shows the speculators are currently Bearish with a score of 35.9 percent. The commercials are Bullish with a score of 76.5 percent and the small traders (not shown in chart) are Bullish with a score of 54.0 percent.
| Ultra US Treasury Bonds Statistics | SPECULATORS | COMMERCIALS | SMALL TRADERS |
| – Percent of Open Interest Longs: | 5.1 | 83.2 | 10.7 |
| – Percent of Open Interest Shorts: | 31.6 | 59.4 | 8.1 |
| – Net Position: | -365,913 | 330,143 | 35,770 |
| – Gross Longs: | 71,306 | 1,152,370 | 147,949 |
| – Gross Shorts: | 437,219 | 822,227 | 112,179 |
| – Long to Short Ratio: | 0.2 to 1 | 1.4 to 1 | 1.3 to 1 |
| NET POSITION TREND: | |||
| – Strength Index Score (3 Year Range Pct): | 35.9 | 76.5 | 54.0 |
| – Strength Index Reading (3 Year Range): | Bearish | Bullish | Bullish |
| NET POSITION MOVEMENT INDEX: | |||
| – 6-Week Change in Strength Index: | -1.9 | 0.0 | 3.3 |
Article By InvestMacro – Receive our weekly COT Newsletter
*COT Report: The COT data, released weekly to the public each Friday, is updated through the most recent Tuesday (data is 3 days old) and shows a quick view of how large speculators or non-commercials (for-profit traders) were positioned in the futures markets.
The CFTC categorizes trader positions according to commercial hedgers (traders who use futures contracts for hedging as part of the business), non-commercials (large traders who speculate to realize trading profits) and nonreportable traders (usually small traders/speculators) as well as their open interest (contracts open in the market at time of reporting). See CFTC criteria here.

- COT Metals Charts: Speculator bets led higher by Copper & Platinum Apr 13, 2024
- COT Bonds Charts: Speculator Bets led by 10-Year & 5-Year Bonds Apr 13, 2024
- COT Soft Commodities Charts: Speculator Bets led by Soybean Meal & Lean Hogs Apr 13, 2024
- COT Stock Market Charts: Weekly Speculator Bets led by VIX & S&P500-Mini Apr 13, 2024
- Singapore’s central bank (MAS) maintained its monetary policy settings. The ECB hinted at a rate cut soon Apr 12, 2024
- Australian dollar struggles amid robust US economic data Apr 12, 2024
- The Bank of Canada maintained its monetary policy settings. The FOMC minutes showed that policymakers will not be in a hurry to cut rates Apr 11, 2024
- US Dollar strengthens following high inflation data Apr 11, 2024
- Gold: Setting Near-Term Price Targets Apr 10, 2024
- The RBNZ kept the interest rate at 5.5%. Intel plans to compete with Nvidia in AI chips Apr 10, 2024