Using Python to Calculate Percentile Rank of Stock Dividends & PE Ratios
 In this quick tutorial, we show how to use python progamming and the popular pandas library to rank a group of stocks by dividends and PE Ratios. We are looking to find the highest dividends from the stocks in our list and then we look for the stocks with the lowest PE Ratios. See our article on pandas rank.
Linear Regression Trading Guide: 4 Trading Strategies
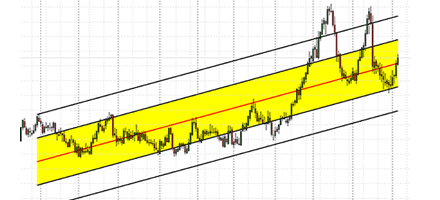 Linear regression is a common method used in statistics to find relationships in sets of data. Regression analysis is also a popular technique used in machine learning and science.The basic of idea of linear regression is to draw a best fit line through the data-points to determine trend direction. Linear regression channels are added by separating the channels above and below the regression line by standard deviations. Professional traders and investors utilize linear regression to find trends in financial market prices as well as to make predictions in price and to see extreme data values compared to the linear regression mean. Learn more in our guide to linear regression trading.
Save CSV Spreadsheets to SQLite Database using Python Pandas Dataframes
In this quick tutorial, I want to show you how to save or backup your spreadsheets into a SQLite database using python. SQLite is a native database that comes with python and will be saved on your computer.
Fibonacci Retracements Trading and How Traders use them
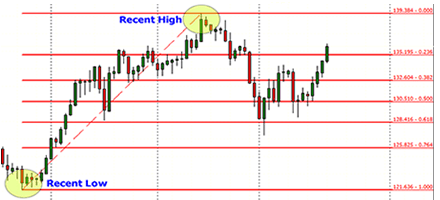 The Fibonacci retracement trading indicator is based on a famous mathematical sequence called the Fibonacci numbers. This sequence is hundreds of years old and was popularized by an Italian mathematician known as Fibonacci.Fibonacci numbers are present in nature and have been used in many different applications, including trading and investing. Fibonacci retracement levels are helpful to traders by providing potentially important support and resistance levels.Learn more about Fibonacci Retracements.
What is the Price-to-Earnings Ratio or P/E Ratio?
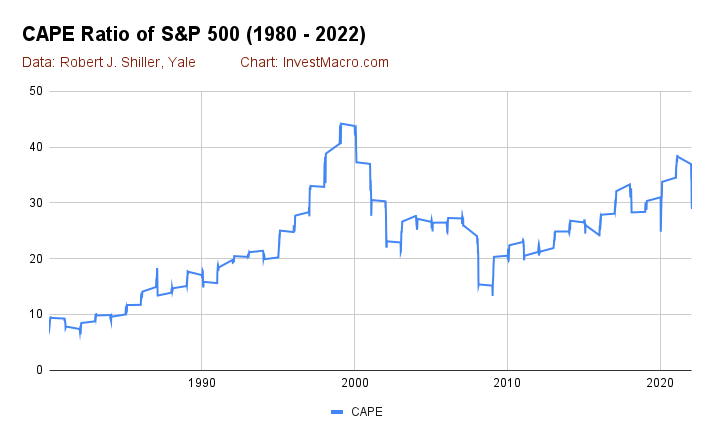 One of the most fundamental aspects of looking at stock market symbols is to understand the value of the company it represents. Luckily, there have been many useful and effective stock market metrics created in order to understand company valuation. Possibly the most famous one is the Price to Earnings Ratio or P/E Ratio. In general, a high P/E ratio is thought to signal an over-priced stock and a low P/E ratio shows an under-priced stock. In this P/E Ratio guide, we look at the common P/E Ratio, the Forward P/E and the CAPE Ratios.
My Favorite Overbought and Oversold Technical Trading Indicators
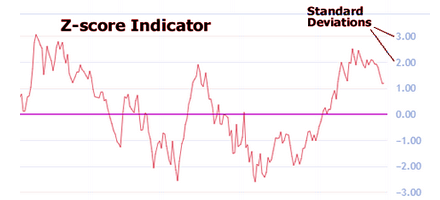 When it comes to technical analysis, one of the most important concepts to understand is that of overbought and oversold conditions. An overbought/oversold tool can be used to measure whether prices have become too bullish or too bearish.Overbought and oversold conditions can be a helpful tool for traders, but they should not be used as the sole basis for making trading decisions. Use them as part of a larger plan or framework to increase your chances of success.Learn more in our Overbought and Oversold Indicators guide.
Japanese Candlestick Patterns Trading Guide
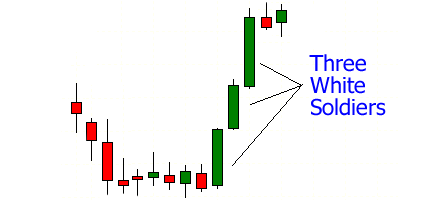 Japanese candlesticks are always a great addition to your charts. Candlesticks pattern trading is a form of analysis that helps traders to see what is happening in the market. But, there are many traders that do not go deeper to see what these eye-pleasing candles are telling them.Candlesticks provide information about the direction of the market, the strength of the trend, and the potential for reversals. Candlesticks are created by taking the opening price, the highest price, the lowest price, and the closing price of a security and plotting them on a chart.We touch upon many aspects in our Candlestick trading guide including the history of Japanese candlesticks, beginner candle formations and some trading implications.
What is the Secured Overnight Financing Rate (SOFR)?
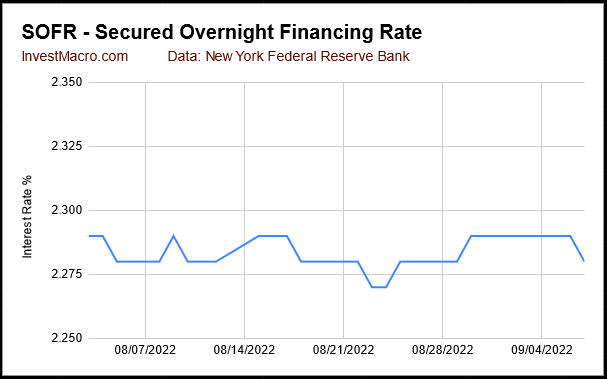 The Secured Overnight Financing Rate, or SOFR for short, is a new benchmark interest rate created by the US Federal Reserve. This rate is designed to more accurately reflect the actual cost of borrowing cash overnight for large banking and financial firms. As SOFR is still a relatively new concept, let us take a closer look at what SOFR is and how it works.
Open Interest Analysis
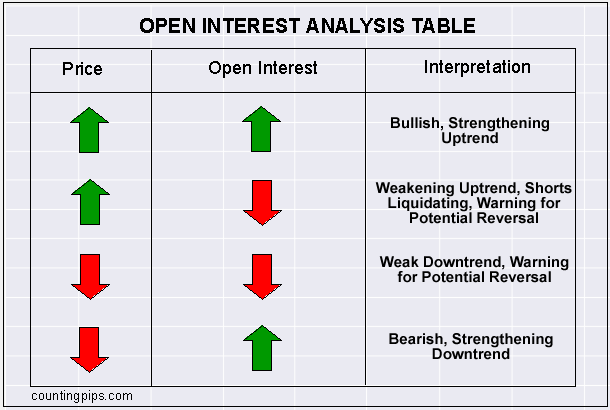 Open Interest is a key component to price trends and a gauge to whether the trends are gaining steam, losing steam or could be ripe for a trend change. High open interest simply means there are many more opinions (long and short) in the market while low open interest is evidence of less enthusiasm about that particular market.