USDJPY Forex Trading Pivot Point Levels for 2014.05.08

2014.05.08 12:30 6:30AM ET | USDJPY Currency Pair

SC USDJPY 2014.05.08

Here are the Pivot Points Levels with Support (S) and Resistance (R) for the USDJPY currency pair today. Price action is currently trading at the 101.774 price level and virtually on top of the daily pivot point, according to data at 6:30 AM ET. The USDJPY high for the day has been 101.948 while the low of day has reached to 101.696. The pair earlier today opened the Asian trading session above the daily pivot and has trended lower so far today.

Daily Pivot Point: 101.768
— S1 – 101.543
— S2 – 101.197
— S3 – 100.972
— R1 – 102.114
— R2 – 102.339
— R3 – 102.685


Weekly Pivot Points: USDJPY

SC USDJPY 2014.05.08

Prices are currently trading under the weekly pivot point and right around the S1 support level at time of writing. The USDJPY has been on an overall bearish trend this week after opening the trading week below the weekly pivot.

Weekly Pivot Point: 102.399
— S1 – 101.793
— S2 – 101.414
— S3 – 100.808
— R1 – 102.778
— R2 – 103.384
— R3 – 103.763


By CountingPips.com – Forex Trading Apps & Currency Trade Tools

Disclaimer: Foreign Currency trading and trading on margin carries a high level of risk and volatility and can result in loss of part or all of your investment. All information and opinions contained do not constitute investment advice and accuracy of prices, charts, calculations cannot be guaranteed.


EURUSD Forex Trading Pivot Point Levels for 2014.05.08

2014.05.08 12:30 6:30AM ET | EURUSD Currency Pair

SC EURUSD 2014.05.08

Here are the Pivot Points Levels with Support (S) and Resistance (R) for the EURUSD currency pair today. Price action is currently trading at the 1.39397 price level and over the daily pivot point, according to data at 6:30 AM ET. The EURUSD high for the day has been 1.39397 while the low of day has reached to 1.39049. The pair earlier today opened the Asian trading session below the daily pivot and has trended higher into the North American morning session.

Daily Pivot Point: 1.39188
— S1 – 1.38997
— S2 – 1.38902
— S3 – 1.38711
— R1 – 1.39283
— R2 – 1.39474
— R3 – 1.39569


Weekly Pivot Points: EURUSD

SC EURUSD 2014.05.08

Prices are currently trading over the weekly pivot point and above the R1 resistance level at time of writing. The EURUSD has been on an overall bullish trend this week after opening the trading week above the weekly pivot.

Weekly Pivot Point: 1.38420
— S1 – 1.37957
— S2 – 1.37233
— S3 – 1.36770
— R1 – 1.39144
— R2 – 1.39607
— R3 – 1.40331


By CountingPips.comForex Trading Apps & Currency Trade Tools

Disclaimer: Foreign Currency trading and trading on margin carries a high level of risk and volatility and can result in loss of part or all of your investment. All information and opinions contained do not constitute investment advice and accuracy of prices, charts, calculations cannot be guaranteed.


USDJPY Forex Trading Pivot Point Levels for 2014.05.07

2014.05.07 12:30 6:30AM ET | USDJPY Currency Pair

SC USDJPY 2014.05.07

Here are the Pivot Points Levels with Support (S) and Resistance (R) for the USDJPY currency pair today. Price action is currently trading below the daily pivot point at the 101.573 price level, according to data at 6:30 AM ET. The USDJPY high for the day has been 101.755 while the low of day has reached to 101.422. The pair earlier today opened the Asian trading session below the daily pivot and has trended lower into the North American morning session.

Daily Pivot Point: 101.779
— S1 – 101.379
— S2 – 101.088
— S3 – 100.688
— R1 – 102.070
— R2 – 102.470
— R3 – 102.761


Weekly Pivot Points: USDJPY

SC USDJPY 2014.05.07

Prices are currently trading under the weekly pivot point and below the S1 support level at time of writing. The USDJPY has been on an overall bearish trend this week after opening the trading week below the weekly pivot.

Weekly Pivot Point: 102.399
— S1 – 101.793
— S2 – 101.414
— S3 – 100.808
— R1 – 102.778
— R2 – 103.384
— R3 – 103.763


By CountingPips.comForex Trading Apps & Currency Trade Tools

Disclaimer: Foreign Currency trading and trading on margin carries a high level of risk and volatility and can result in loss of part or all of your investment. All information and opinions contained do not constitute investment advice and accuracy of prices, charts, calculations cannot be guaranteed.


GBPUSD Forex Trading Pivot Point Levels for 2014.05.07

2014.05.07 12:30 6:30AM ET | GBPUSD Currency Pair

SC GBPUSD 2014.05.07

Here are the Pivot Points Levels with Support (S) and Resistance (R) for the GBPUSD currency pair today. Price action is currently trading at the 1.69695 price level and over the daily pivot point, according to data at 6:30 AM ET. The GBPUSD high for the day has been 1.69852 while the low of day has reached to 1.69642. The pair earlier today opened the Asian trading session above the daily pivot and has trended sideways so far today.

Daily Pivot Point: 1.69443
— S1 – 1.68933
— S2 – 1.68136
— S3 – 1.67626
— R1 – 1.70240
— R2 – 1.70750
— R3 – 1.71547


Weekly Pivot Points: GBPUSD

SC GBPUSD 2014.05.07

Prices are currently trading over the weekly pivot point and just below the R1 resistance level at time of writing. The GBPUSD has been on an overall bullish trend this week after opening the trading week slightly above the weekly pivot.

Weekly Pivot Point: 1.68535
— S1 – 1.67890
— S2 – 1.67118
— S3 – 1.66473
— R1 – 1.69307
— R2 – 1.69952
— R3 – 1.70724


By CountingPips.com – Forex Trading Apps & Currency Trade Tools

Disclaimer: Foreign Currency trading and trading on margin carries a high level of risk and volatility and can result in loss of part or all of your investment. All information and opinions contained do not constitute investment advice and accuracy of prices, charts, calculations cannot be guaranteed.


USDCHF Forex Trading Pivot Point Levels for 2014.05.07

2014.05.07 12:30 6:30AM ET | USDCHF Currency Pair

SC USDCHF 2014.05.07

Here are the Pivot Points Levels with Support (S) and Resistance (R) for the USDCHF currency pair today. Price action is currently trading over the daily pivot point at the 0.87502 price level, according to data at 6:30 AM ET. The USDCHF high for the day has been 0.87529 while the low of day has reached to 0.87329. The pair earlier today opened the Asian trading session below the daily pivot and trended sideways before popping higher over daily pivot.

Daily Pivot Point: 0.87469
— S1 – 0.87145
— S2 – 0.86877
— S3 – 0.86553
— R1 – 0.87737
— R2 – 0.88061
— R3 – 0.88329


Weekly Pivot Points: USDCHF

SC USDCHF 2014.05.07

Prices are currently trading under the weekly pivot point at time of writing. The USDCHF has been on an overall bearish trend this week after opening the trading week below the weekly pivot.

Weekly Pivot Point: 0.87994
— S1 – 0.87489
— S2 – 0.87189
— S3 – 0.86684
— R1 – 0.88294
— R2 – 0.88799
— R3 – 0.89099


By CountingPips.comForex Trading Apps & Currency Trade Tools

Disclaimer: Foreign Currency trading and trading on margin carries a high level of risk and volatility and can result in loss of part or all of your investment. All information and opinions contained do not constitute investment advice and accuracy of prices, charts, calculations cannot be guaranteed.


Weekly Forex Pivot Points EURUSD, GBPUSD, USDJPY, USDCHF for 2014.05.05

2014.05.05 12:30 6:30AM ET

Here are the Weekly Pivot Points Levels with Support (S) and Resistance (R) for the EURUSD, GBPUSD, USDJPY, USDCHF currency pairs.

Weekly Pivot Points: EURUSD

SC EURUSD 2014.05.05

Price action is currently trading over the weekly pivot point at the 1.38708 price level, according to data at 6:30 AM ET. The EURUSD high for the day has been 1.38839 while the low of day has reached to 1.38641.

Weekly Pivot Point: 1.38420
— S1 – 1.37957
— S2 – 1.37233
— S3 – 1.36770
— R1 – 1.39144
— R2 – 1.39607
— R3 – 1.40331


Weekly Pivot Points: GBPUSD

SC GBPUSD 2014.05.05

Prices are currently trading at the 1.68702 price level and over the weekly pivot point to start the week for cable. Today’s GBPUSD high for the day has been 1.68837 while the low of day has reached to 1.68654.

Weekly Pivot Point: 1.68535
— S1 – 1.67890
— S2 – 1.67118
— S3 – 1.66473
— R1 – 1.69307
— R2 – 1.69952
— R3 – 1.70724


Weekly Pivot Points: USDJPY

SC USDJPY 2014.05.05

Price action is currently trading at the 101.952 price level and under the weekly pivot point to begin this week. The USDJPY high for the day has been 102.253 and the low of day has been reached at 101.855.

Weekly Pivot Point: 102.399
— S1 – 101.793
— S2 – 101.414
— S3 – 100.808
— R1 – 102.778
— R2 – 103.384
— R3 – 103.763


Weekly Pivot Points: USDCHF

SC USDCHF 2014.05.05

Price action in the USDCHF is currently trading at the 0.87761 price level and below the weekly pivot point. The USDCHF high for the day has been 0.87800 while the low of day reached to the 0.87653 exchange rate so far.

Weekly Pivot Point: 0.87994
— S1 – 0.87489
— S2 – 0.87189
— S3 – 0.86684
— R1 – 0.88294
— R2 – 0.88799
— R3 – 0.89099


By CountingPips.com – Forex Trading Apps & Currency Trade Tools

Disclaimer: Foreign Currency trading and trading on margin carries a high level of risk and volatility and can result in loss of part or all of your investment. All information and opinions contained do not constitute investment advice and accuracy of prices, charts, calculations cannot be guaranteed.


Crude Oil Speculators cut back on bullish positions after 5 weeks of gains

By CountingPips.com

Weekly CFTC Net Speculator Report

CrudeOil

CRUDE OIL: Large futures market traders and speculators decreased their overall bullish bets in crude oil futures for the first time in six weeks, according to the latest Commitment of Traders (COT) data released by the Commodity Futures Trading Commission (CFTC) on Friday.

The non-commercial contracts of crude oil futures, primarily traded by large speculators and hedge funds, fell to a total net position of +402,327 contracts in the data reported for April 29th. This was a change of -7,798 contracts for the week. The previous week had seen a total of +410,125 net contracts in the data through April 22nd.

The decline was the first retreat in bullish positions since March 18th and stopped a string of five weekly advances that brought bullish positions to the highest standing since March 4th (+425,818 net contracts).

Over the same weekly reporting time-frame, from Tuesday April 22nd to Tuesday April 29th, the crude oil price fell from $101.92 to $100.58 per barrel, according to Nymex futures price data from investing.com. Brent crude prices, meanwhile, also showed a decline from $109.44 to $108.86 per barrel from Tuesday April 22nd to Tuesday April 29th, according to prices from investing.com.

Last 6 Weeks of Large Trader Non-Commercial Positions

DateOpen InterestLong SpecsShort SpecsNet Non-CommercialsWeekly ChangeOil Price
03/25/20141604566498080106906391174688999.19
04/01/2014164450750238911060639178360999.61
04/08/201416554725120351122483997878004102.33
04/15/201416742765234901139394095519764103.78
04/22/20141619737517023106898410125574101.92
04/29/20141651521522018119691402327-7798100.58

*COT Report: The weekly commitment of traders report summarizes the total trader positions for open contracts in the futures trading markets. The CFTC categorizes trader positions according to commercial hedgers (traders who use futures contracts for hedging as part of the business), non-commercials (large traders who speculate to realize trading profits) and nonreportable traders (usually small traders/speculators). Find CFTC criteria here: (http://www.cftc.gov/MarketReports/CommitmentsofTraders/ExplanatoryNotes/index.htm).

Article by CountingPips.comForex Trading News


VIX Futures Market Speculators raised bearish positions last week to highest level since Feb

By CountingPips.com

Weekly CFTC Net Speculator Report


vix


VIX Futures Contracts: Large traders and speculators added to their overall bearish bets in the VIX futures market last week after a decline the previous week, according to the latest data from the Commodity Futures Trading Commission (CFTC) released on Friday.

The VIX non-commercial futures contracts, comprising of large speculator and hedge fund positions, totaled a net bearish position of -45,486 contracts in the data reported for April 29th. This was a change of -11,429 contracts from the previous week’s total of -34,057 net contracts that was registered on April 22nd.

The increase in bearish positions brings overall net contracts to the highest bearish level since February 4th when net positions stood at a level of -51,230 contracts.

The VIX index over the same reporting time-frame last week edged higher from a 13.19 reading on Tuesday April 22nd to a 13.71 reading on Tuesday April 29th, according to the Chicago Board Options Exchange (CBOE) Volatility Index.


Last 6 Weeks of Large Trader Positions

DateOpen InterestLong SpecsShort SpecsNet Non-CommercialsWeekly ChangeVIX Score
03/25/2014335826109110116314-7204-614114.02
04/01/2014357046114839145412-30573-2336913.10
04/08/2014359952105096136842-31746-117314.89
04/15/201436888796296132242-35946-420015.61
04/22/2014362130106598140655-34057188913.19
04/29/2014365215110843156329-45486-1142913.71

*COT Report: The weekly commitment of traders report summarizes the total trader positions for open contracts in the futures trading markets. The CFTC categorizes trader positions according to commercial hedgers (traders who use futures contracts for hedging as part of the business), non-commercials (large traders who speculate to realize trading profits) and nonreportable traders (usually small traders/speculators). Find CFTC criteria here: (http://www.cftc.gov/MarketReports/CommitmentsofTraders/ExplanatoryNotes/index.htm).


Article by CountingPips.comForex Apps & Analysis


Forex COT Speculators decreased US Dollar short bets last week, CAD bets rise

By CountingPips.com

cot-levels

The latest data for the weekly Commitments of Traders (COT) report, released by the Commodity Futures Trading Commission (CFTC) on Friday, showed that large traders and speculators slightly decreased their overall bearish bets of the US dollar last week.

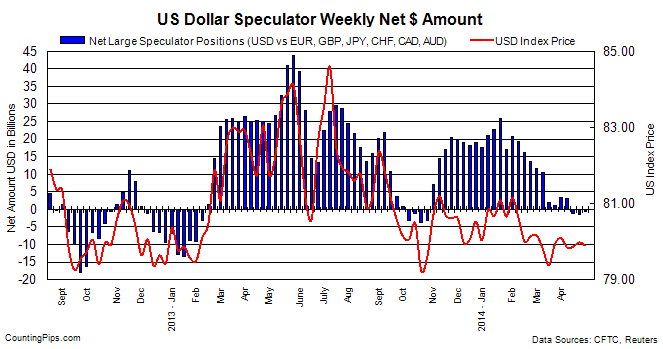
Non-commercial large futures traders, including hedge funds and large International Monetary Market speculators, had an overall US dollar short position totaling -$0.686 billion as of Tuesday April 29th, according to the latest data from the CFTC and calculations by Reuters. This was a weekly change of +$0.894 billion from the -$1.58 billion total short position that was registered on April 22nd, according to Reuters that totals the US dollar contracts against the combined contracts of the euro, British pound, Japanese yen, Australian dollar, Canadian dollar and the Swiss franc.

The USD position has been on the bearish side (slightly) for the past three weeks after having stayed in bullish territory since October 29th with the highest bullish position reached on January 21st with a +$25.89 total position.

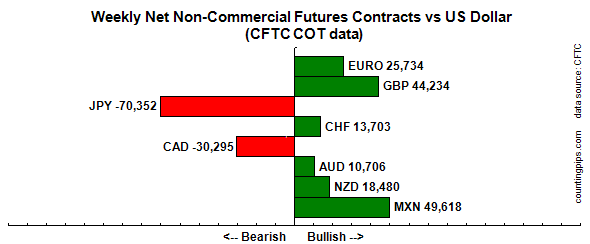
For the week, speculators increased their bets in favor of just the Canadian dollar while there was weekly declines for the euro, Japanese yen, British pound sterling, Swiss franc, Australian dollar, New Zealand dollar and the Mexican peso.


cot-standings

Notable changes:

  •     The small Euro decline has pushed Euro positions to fall five out of the last six weeks (same with Swiss franc)
  •     British pound sterling positions declined for 2nd week after a string of five straight weekly gains
  •     Canadian dollar bearish positions are at their lowest level since November 26th 2013 when bearish net contracts were -28,780
  •     Australian dollar net position decline broke a streak of 7 straight weekly advances


* All currency positions are in direct relation to the US dollar where, for example, a bet for the euro is a bet that the euro will rise versus the dollar while a bet against the euro will be a bet that the dollar will gain versus the euro. Please see charts and data below.


Weekly Charts: Large Speculators Weekly Positions vs Currency Spot Price

EuroFX:

eurofx

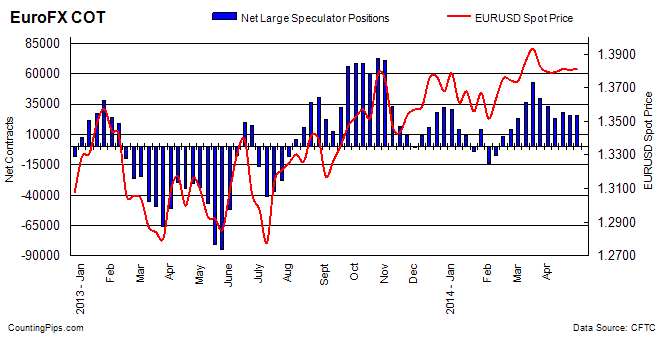
Last Six Weeks data for EuroFX futures

DateOpen InterestLong SpecsShort SpecsLarge Specs NetWeekly Change
03/25/20142621791069146728039634-13357
04/01/20142600751018496861133238-6396
04/08/2014261439926356933523300-9938
04/15/201427072210625278564276884388
04/22/20142662591012047543025774-1914
04/29/20142715151022857655125734-40


British Pound Sterling:

gbp

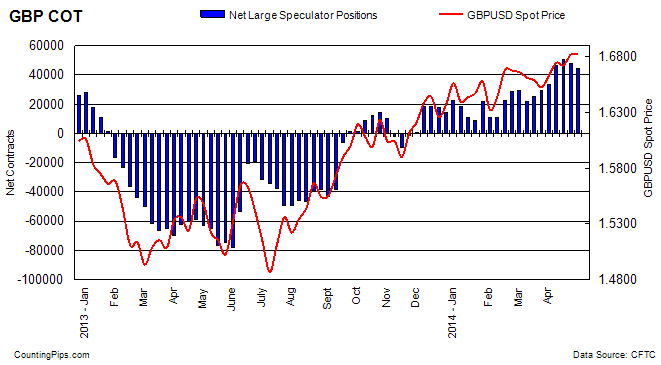
Last Six Weeks data for Pound Sterling futures

DateOpen InterestLong SpecsShort SpecsLarge Specs NetWeekly Change
03/18/20142089616414138605255363537
03/25/20142021156675137027297244188
04/01/20142114377596942397335723848
04/08/201422666791642451654647712905
04/15/20142266888747236874505984121
04/22/2014237055896924189247800-2798
04/29/2014236030859134167944234-3566


Japanese Yen:

jpy

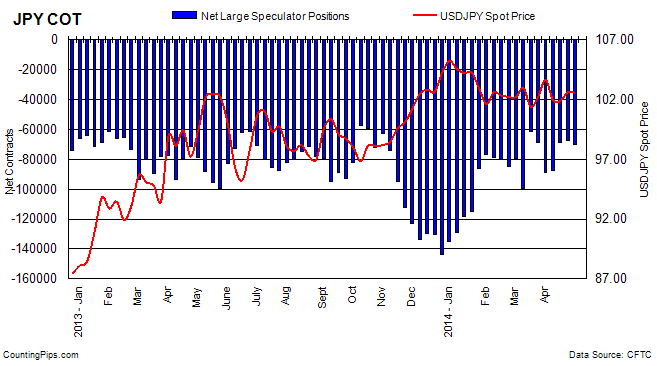
Last Six Weeks data for Yen Futures

DateOpen InterestLong SpecsShort SpecsLarge Specs NetWeekly Change
03/25/20141582801760086487-68887-7788
04/01/201418846422162110800-88638-19751
04/08/201418181413340100802-874621176
04/15/20141648431435183067-6871618746
04/22/20141656741656483807-672431473
04/29/20141688201384684198-70352-3109


Swiss Franc:

chf

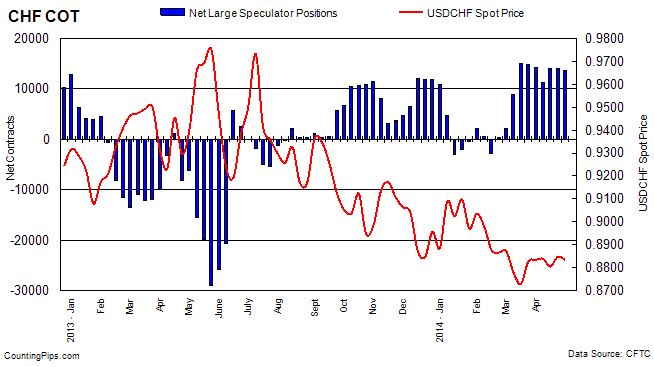
Last Six Weeks data for Franc futures

DateOpen InterestLong SpecsShort SpecsLarge Specs NetWeekly Change
03/25/201447353250371021814819-297
04/01/201447228248001056914231-588
04/08/20144475219275794011335-2896
04/15/201448976239059839140662731
04/22/20144688821732770914023-43
04/29/20144742421960825713703-320


Canadian Dollar:

cad

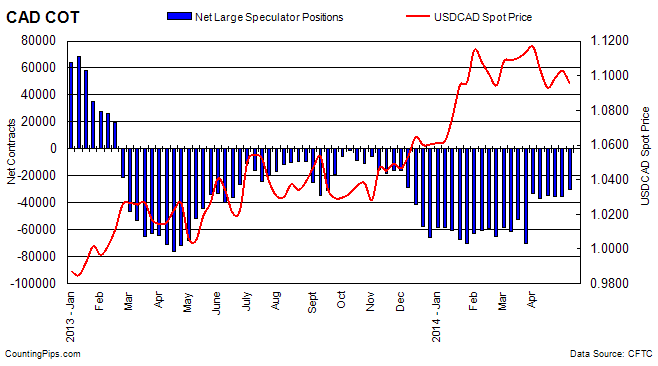
Last Six Weeks data for Canadian dollar futures

DateOpen InterestLong SpecsShort SpecsLarge Specs NetWeekly Change
03/25/20141332464044173656-3321536590
04/01/20141179662754964543-36994-3779
04/08/20141203362870463011-343072687
04/15/20141195252828863714-35426-1119
04/22/20141187072752962984-35455-29
04/29/20141235893009360388-302955160


Australian Dollar:

aud

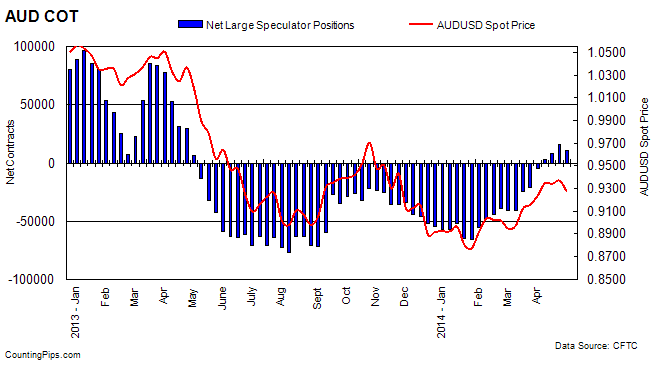
Last Six Weeks data for Australian dollar futures

DateOpen InterestLong SpecsShort SpecsLarge Specs NetWeekly Change
03/25/2014842322438744914-205273936
04/01/2014939993539840278-488015647
04/08/201496887376303432033108190
04/15/201498933404633236680974787
04/22/20141076964954033170163708273
04/29/2014109934500193931310706-5664


New Zealand Dollar:

nzd

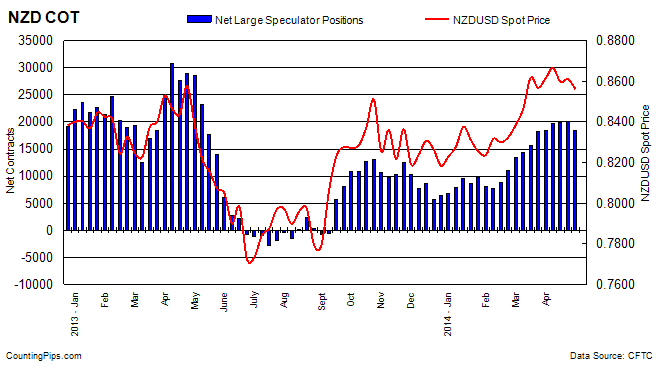
Last Six Weeks data for New Zealand dollar futures

DateOpen InterestLong SpecsShort SpecsLarge Specs NetWeekly Change
03/25/201432748262438030182132462
04/01/20143231325765728518480267
04/08/201432898265216755197661286
04/15/2014331002667168241984781
04/22/20143257926056588120175328
04/29/20142985822979449918480-1695


Mexican Peso:

mxn

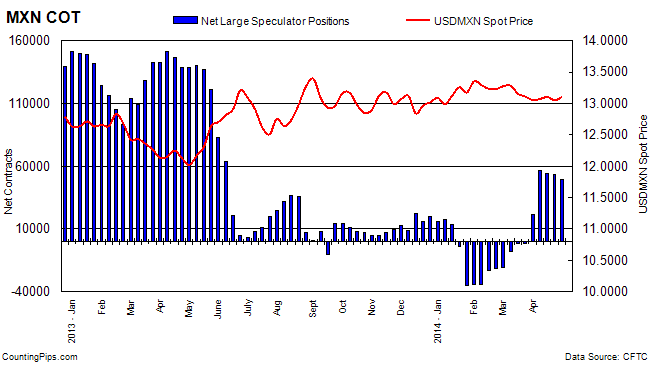
Last Six Weeks data for Mexican Peso futures

DateOpen InterestLong SpecsShort SpecsLarge Specs NetWeekly Change
03/25/20141158582276924423-1654-384
04/01/201414527049893281092178423438
04/08/201413033170371138705650134717
04/15/2014131412710381680154237-2264
04/22/2014128932683291481853511-726
04/29/2014128100680731845549618-3893


*COT Report: The weekly commitment of traders report summarizes the total trader positions for open contracts in the futures trading markets. The CFTC categorizes trader positions according to commercial hedgers (traders who use futures contracts for hedging as part of the business), non-commercials (large traders who speculate to realize trading profits) and nonreportable traders (usually small traders/speculators).

The Commitment of Traders report is published every Friday by the Commodity Futures Trading Commission (CFTC) and shows futures positions data that was reported as of the previous Tuesday (3 days behind).

Each currency contract is a quote for that currency directly against the U.S. dollar, a net short amount of contracts means that more speculators are betting that currency to fall against the dollar and a net long position expect that currency to rise versus the dollar.

(The graphs overlay the forex spot closing price of each Tuesday when COT trader positions are reported for each corresponding spot currency pair.)

See more information and explanation on the weekly COT report from the CFTC website.


Article by CountingPips.comForex Apps & News

Gold Speculators added to bullish positions for 2nd week in latest COT data

By CountingPips.com

Weekly CFTC Net Speculator Report

gold

GOLD: Large futures market traders and speculators increased their overall bullish bets in gold futures last week for a second consecutive week, according to the latest Commitment of Traders (COT) data released by the Commodity Futures Trading Commission (CFTC) on Friday.

The non-commercial futures contracts of Comex gold futures, traded by large speculators and hedge funds, totaled a net position of +85,227 contracts in the data reported through April 29th. This was a change of +3,394 contracts from the previous week’s total of +81,833 net contracts on April 22nd.

The gold non-commercial net positions had fallen for four straight weeks through April 15th before turning around with small gains the past two weeks.

Over the weekly reporting time-frame, from Tuesday April 22nd to Tuesday April 29th, the gold price advanced from $1,284.90 to $1,296.20 per ounce, according to gold futures price data from investing.com.


Last 6 Weeks of Large Trader Non-Commercial Positions

DateOpen InterestLong SpecsShort SpecsNet Non-CommercialsWeekly ChangeGold Price
03/25/201439826416908351766117317-194971311.00
04/01/201436345115815258007100145-171721279.60
04/08/20143654001496936109488599-115461310.10
04/15/20143695771474326814079292-93071302.9
04/22/2014372593146880650478183325411284.9
04/29/2014378092147769625428522733941296.2

*COT Report: The weekly commitment of traders report summarizes the total trader positions for open contracts in the futures trading markets. The CFTC categorizes trader positions according to commercial hedgers (traders who use futures contracts for hedging as part of the business), non-commercials (large traders who speculate to realize trading profits) and nonreportable traders (usually small traders/speculators). Find CFTC criteria here: (http://www.cftc.gov/MarketReports/CommitmentsofTraders/ExplanatoryNotes/index.htm).

Article by CountingPips.comForex Trading Apps