AUDUSD Daily Forex Fibonacci Levels & Trends Data 2013.11.25

2013.11.25 | AUDUSD Market Analysis

AUDUSD Trends & Fibonacci Retracement Levels

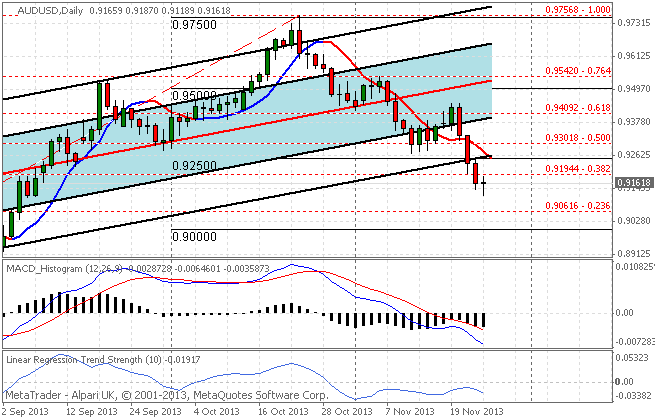
The AUDUSD currency pair has been falling slightly in forex market trading today with the AUDUSD registering a high of 0.91870 and a low of 0.91189 on the day. Trends data shows the pair is currently in a short-term downtrend as prices are trading under short-term linear moving average of 21 periods. Over the longer term trend, as seen on the chart by the 90 day Linear Regression Channels, the pair continues to be in an uptrend although prices are in a extreme position outside the channels possibly representing a trend change.

SC AUDUSD 2013.11.25


AUDUSD Trends Data: Linear Regression Indicator

10-day current trend is BEARISH / Trend strength of -179.0 pips
30-day current trend is BEARISH / Trend strength of -418.7 pips
60-day current trend is BULLISH / Trend strength of 170.1 pips
90-day current trend is BULLISH / Trend strength of 483.4 pips
180-day current trend is BEARISH / Trend strength of -1124.9 pips


By CountingPips.comForex Trading Apps & Currency Trade Tools


Disclaimer: Foreign Currency trading and trading on margin carries a high level of risk and volatility and can result in loss of part or all of your investment. All information and opinions contained do not constitute investment advice and accuracy of prices, charts, calculations cannot be guaranteed.


GBPUSD Daily Forex Fibonacci Levels & Trends Data 2013.11.25

2013.11.25 | GBPUSD Market Analysis

GBPUSD Trends & Fibonacci Retracement Levels

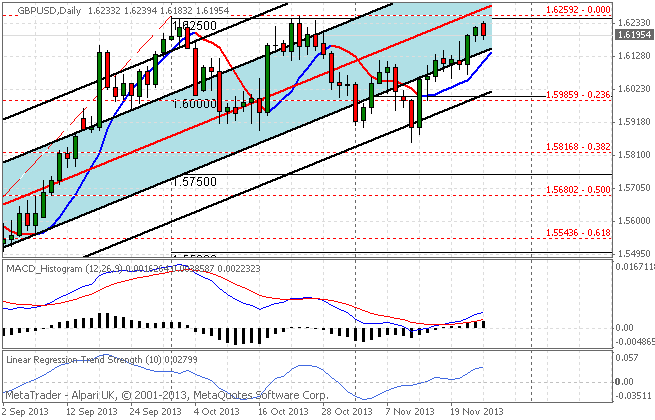
The GBPUSD currency pair has been declining in forex market trading today with the GBPUSD registering a high of 1.62394 and a low of 1.61832 on the day. Trends data shows the pair is currently in a short-term uptrend with prices  trading over the 21 day linear moving average. Over the longer term trend, as seen on the chart by the 90 day Linear Regression Channels indicator, the pair also continues to be in an uptrend with the 1.6250 level representing a clear barrier above.

SC GBPUSD 2013.11.25


GBPUSD Trends Data: Linear Regression Indicator

10-day current trend is BULLISH / Trend strength of 283.1 pips
30-day current trend is BULLISH / Trend strength of 39.2 pips
60-day current trend is BULLISH / Trend strength of 372.9 pips
90-day current trend is BULLISH / Trend strength of 940.8 pips
180-day current trend is BULLISH / Trend strength of 1040.3 pips


By CountingPips.com – Forex Trading Apps & Currency Trade Tools


Disclaimer: Foreign Currency trading and trading on margin carries a high level of risk and volatility and can result in loss of part or all of your investment. All information and opinions contained do not constitute investment advice and accuracy of prices, charts, calculations cannot be guaranteed.


Forex Weekly Fundamental Outlook: Major Trading Events on the Schedule

By CountingPips.com

This week’s economic calendar has many important data releases for the Forex market out of the US, the Eurozone and the United Kingdom. On the schedule this week will include the Pending home sales, durable goods, Case-Shiller housing data and the housing starts/building permits data out of the United States.

From the Eurozone this week, we will see important data that includes the German unemployment change & unemployment rate, the German consumer price index, Eurozone economic confidence, German retail sales as well as the Eurozone consumer price index.

Elsewhere, we will see the United Kingdom gross domestic product report, the Canadian gross domestic product report, the Japanese consumer price index and the Switzerland gross domestic product report.

Here’s a quick rundown of the major daily economic highlights:

Monday, November 25
United States — Pending Home Sales for October

Tuesday, November 26
United States — Conference Board Consumer Confidence for November

Wednesday, November 27
United Kingdom — Gross Domestic Product for the third quarter
United States — Durable Goods Orders for October

Thursday, November 28
Eurozone – Germany — Unemployment change & unemployment rate for November
Eurozone – Germany — Consumer Price Index
Japan — National Consumer Price Index

Friday, November 29
Eurozone — Consumer Price Index
Canada — Gross Domestic Product for third quarter and September

Please see our full calendar for a complete listing of economic events.


VIDEO: ECB’s Draghi Kicks Back Proposals On Sovereign Debt Risk-weighting

ECB President Mario Draghi has kicked back a proposal from advisors to change the way sovereign debt is risk-weighted and asked them to do some more work on it, German weekly news magazine Spiegel reported. The euro zone’s sovereign debt crisis has highlighted the dangers of banks buying its government bonds as a theoretically safe buffer against risky investments, particularly since holders of Greek bonds took a hit in the country’s bailout. The measures suggested by the advisors could have a big impact on how crisis-stricken states finance themselves in the future.

Futures Speculators boosted US Dollar forex bets to highest level in two months

By CountingPips.com

cot-values


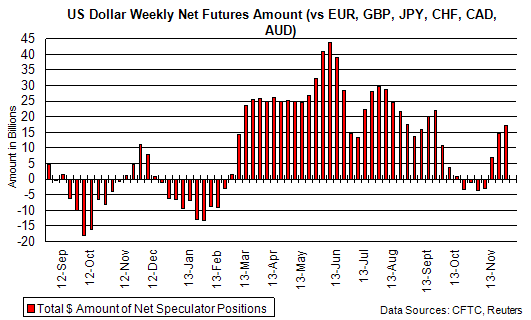
The latest data for the weekly Commitments of Traders (COT) report, released on Friday by the Commodity Futures Trading Commission (CFTC), showed that large futures traders pushed their bullish bets on the US dollar last week to the highest level in two months.

Non-commercial large futures traders, including hedge funds and large International Monetary Market speculators, had an overall US dollar long position totaling $17.1 billion as of Tuesday November 19th, according to Reuters. This was a weekly change of $2.64 billion from the $14.46  billion bullish position that was registered on November 12th, according to the data from Reuters that calculates this amount by the total of US dollar contracts against the combined contracts of the euro, British pound, Japanese yen, Australian dollar, Canadian dollar and the Swiss franc.

The latest data puts the US dollar bullish positions at a new highest level since September 10th when US dollar bets were long at a total of $22.01 billion.


Individual Currencies Large Speculators Positions in Futures:

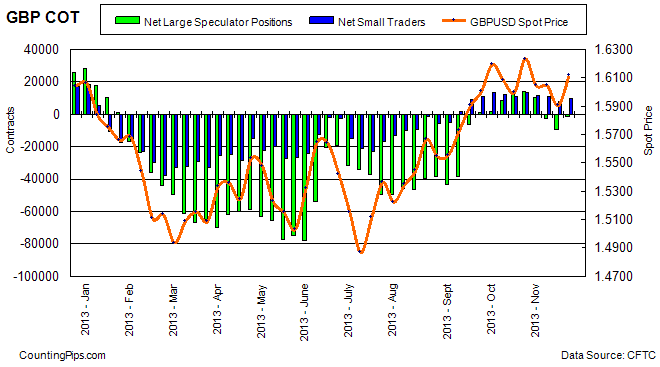
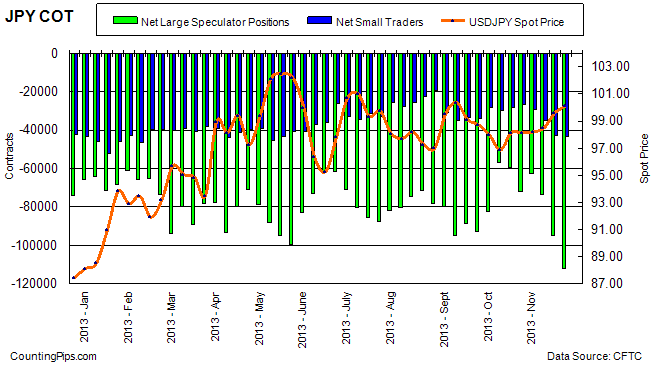
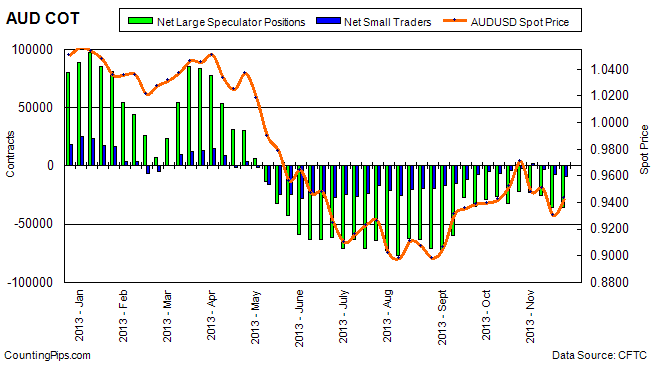
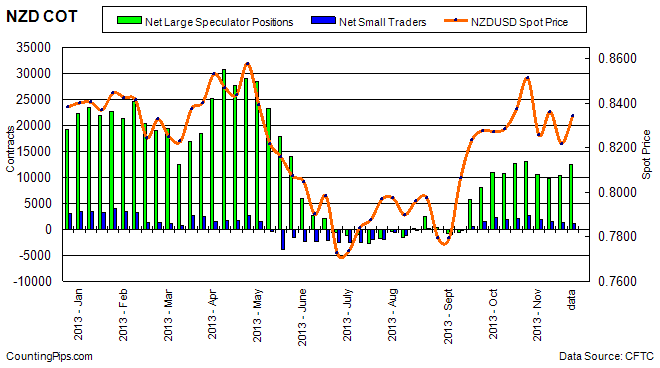
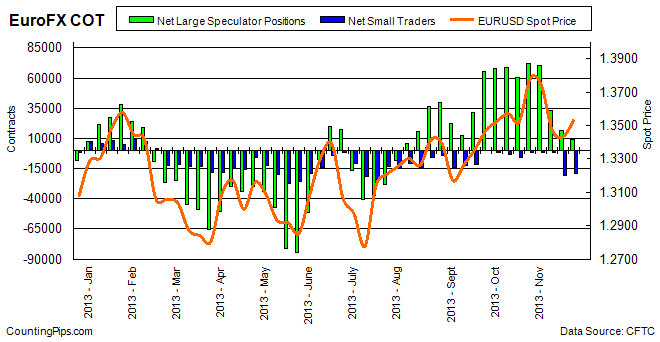
The large non-commercial net positions for each of the individual major currencies directly against the US dollar showed weekly increases for the British pound sterling, Swiss franc, Mexican peso, Australian dollar and the New Zealand dollar while there were weekly declines for the euro (lowest level since August), Canadian dollar and the  Japanese yen which fell to the lowest level of 2013.


Individual Currency Charts:


EuroFX:
eurofx

Last Six Weeks of Large Trader Positions: EuroFX

DateLarge Trader Net PositionsWeekly Change
10/15/201360374-8309
10/22/20137243412060
10/29/201370617-1817
11/05/201333143-37474
11/12/201316826-16317
11/19/20138911-7915


British Pound Sterling:

gbp

Last Six Weeks of Large Trader Positions: Pound Sterling

DateLg Trader NetWeekly Change
10/15/2013122313460
10/22/2013142622031
10/29/201310162-4100
11/05/2013-2392-12554
11/12/2013-9303-6911
11/19/2013-16657638


Japanese Yen:

jpy

Last Six Weeks of Large Trader Positions: Yen

DateLg Trader NetWeekly Change
10/15/2013-59266-2169
10/22/2013-71802-12536
10/29/2013-623959407
11/05/2013-73792-11397
11/12/2013-95107-21315
11/19/2013-112216-17109


Swiss Franc:

chf

Last Six Weeks of Large Trader Positions: Franc

DateLg Trader NetWeekly Change
10/15/201310767352
10/22/201310931164
10/29/201311451520
11/05/20138095-3356
11/12/20133189-4906
11/19/20133669480


Canadian Dollar:

cad

Last Six Weeks of Large Trader Positions: CAD

DateLg Trader NetWeekly Change
10/15/2013-10814-2151
10/22/2013-53645450
10/29/2013-15237-9873
11/05/2013-18002-2765
11/12/2013-160921910
11/19/2013-16335-243


Australian Dollar:

aud

Last Six Weeks of Large Trader Positions: AUD

DateLg Trader NetWeekly Change
10/15/2013-32237-5833
10/22/2013-2211110126
10/29/2013-23198-1087
11/05/2013-25067-1869
11/12/2013-35809-10742
11/19/2013-3576247


New Zealand Dollar:

nzd

Last Six Weeks of Large Trader Positions: NZD

DateLg Trader NetWeekly Change
10/15/2013126681902
10/22/201313114446
10/29/201310625-2489
11/05/20139708-917
11/12/201310366658
11/19/2013124762110


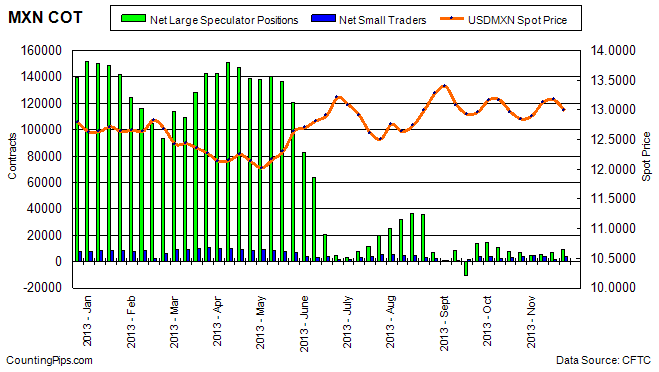
Mexican Peso:

mxn

Last Six Weeks of Large Trader Positions: MXN

DateLg Trader NetWeekly Change
10/15/20137761-3172
10/22/20137214-547
10/29/20134896-2318
11/05/20135180284
11/12/201370171837
11/19/201395392522


*COT Report: The weekly commitment of traders report summarizes the total trader positions for open contracts in the futures trading markets. The CFTC categorizes trader positions according to commercial hedgers (traders who use futures contracts for hedging as part of the business), non-commercials (large traders who speculate to realize trading profits) and nonreportable traders (usually small traders/speculators).

The Commitment of Traders report is published every Friday by the Commodity Futures Trading Commission (CFTC) and shows futures positions data that was reported as of the previous Tuesday (3 days behind).

Each currency contract is a quote for that currency directly against the U.S. dollar, a net short amount of contracts means that more speculators are betting that currency to fall against the dollar and a net long position expect that currency to rise versus the dollar.

(The graphs overlay the forex spot closing price of each Tuesday when COT trader positions are reported for each corresponding spot currency pair.)

See more information and explanation on the weekly COT report from the CFTC website.


Article by CountingPips.comForex News


US 10-Year Treasury Note Speculators decreased bearish positions for 2nd week

By CountingPips.com

Weekly CFTC Net Speculator Report

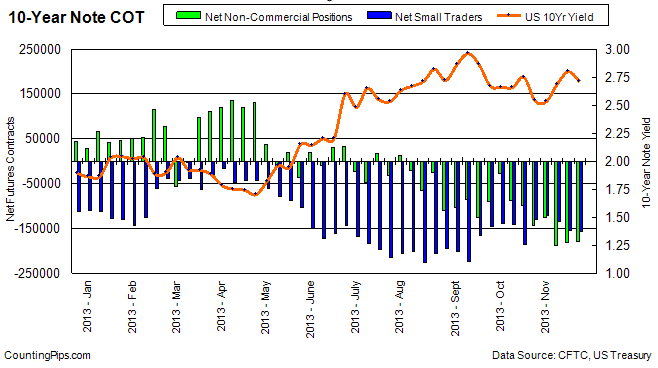
10 Year Treasuries: Large trader and futures market speculators slightly trimmed their overall bearish positions in the 10-year treasury note futures for a second straight week on November 19th, according to the latest Commitment of Traders data released by the Commodity Futures Trading Commission (CFTC) on Friday. The non-commercial futures contracts of the 10-year treasury notes, traded by large speculators and hedge funds, totaled a net position of -180,363 contracts in the data for  November 19th. This was a change of just +716 contracts from the previous week’s total of -181,079 net contracts that was recorded on November 12th. The past two weeks have seen the bearish positions retreat a little bit from the November 5th level which had marked the highest bearish position in 10-year notes in 2013.


10Yr

Over the last week’s time-frame, the yield on the 10-Year treasury note fell from 2.80 on Tuesday November 12th to 2.71 on Tuesday November 19th, according to US Treasury data.


Last 6 Weeks of Large Trader Positions

DateNet Large SpecsWeekly Change10 Year Yield
10/15/2013-99788-122172.75
10/22/2013-142550-427622.54
10/29/2013-125670168802.53
11/05/2013-189188-635182.69
11/12/2013-18107981092.8
11/19/2013-1803637162.71


*COT Report: The weekly commitment of traders report summarizes the total trader positions for open contracts in the futures trading markets. The CFTC categorizes trader positions according to commercial hedgers (traders who use futures contracts for hedging as part of the business), non-commercials (large traders who speculate to realize trading profits) and nonreportable traders (usually small traders/speculators). Find CFTC criteria here: (http://www.cftc.gov/MarketReports/CommitmentsofTraders/ExplanatoryNotes/index.htm).


Article by CountingPips.comForex Trading News & Analysis


VIX Futures Speculators raised bearish bets for 3rd week

By CountingPips.com

Weekly CFTC Net Speculator Report

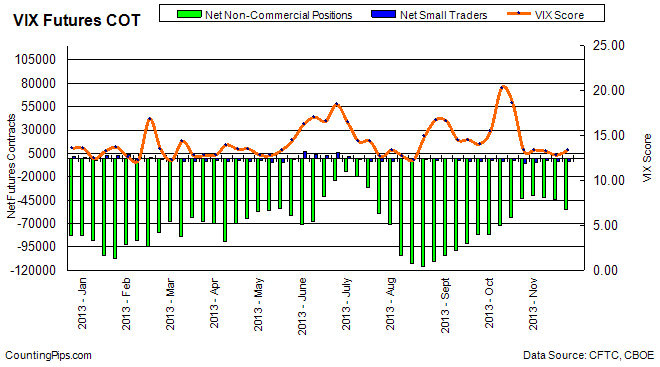
VIX: Large traders and speculators increased their bearish positions in the VIX futures market on November 19th for a third straight week, according to the Commodity Futures Trading Commission (CFTC) data released on Friday. The VIX non-commercial contracts, consisting of large speculators and hedge funds, totaled a net position of -54,855 contracts in the data reported for November 19th. This was a change of -10,330 contracts from the previous week’s total of -44,525 net contracts that was registered on November 12th. Over the same time-frame, the VIX index score advanced a bit from 12.82 on Tuesday November 12th to 13.39 on Tuesday November 19th, according to the Chicago Board Options Exchange (CBOE) Volatility Index.


vix


Last 6 Weeks of Large Trader Positions

DateNet Non-CommericalsChangeVIX Score
10/15/2013-63614863618.66
10/22/2013-432972031713.33
10/29/2013-39673362413.41
11/05/2013-41908-223513.27
11/12/2013-44525-261712.82
11/19/2013-54855-1033013.39


*COT Report: The weekly commitment of traders report summarizes the total trader positions for open contracts in the futures trading markets. The CFTC categorizes trader positions according to commercial hedgers (traders who use futures contracts for hedging as part of the business), non-commercials (large traders who speculate to realize trading profits) and nonreportable traders (usually small traders/speculators). Find CFTC criteria here: (http://www.cftc.gov/MarketReports/CommitmentsofTraders/ExplanatoryNotes/index.htm).


Article by CountingPips.comForex News & Analysis


USDCHF Daily Forex Fibonacci Levels & Trends Data 2013.11.22

2013.11.22 | USDCHF Market Analysis

USDCHF Trends & Fibonacci Retracement Levels

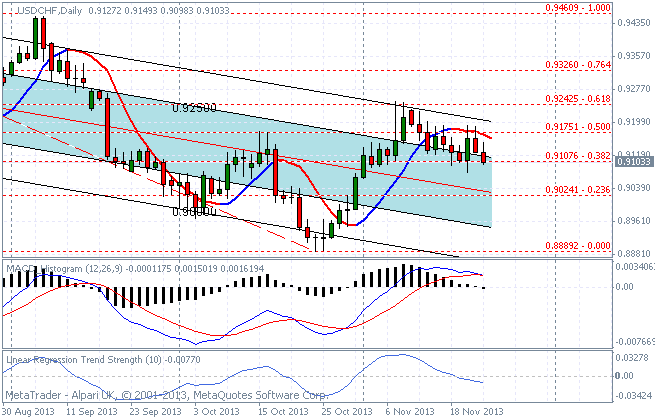
The USDCHF currency pair has been declining in forex market trading for a second day today with the USDCHF registering a high of 0.91493 and a low of 0.90983 on the day. Trends data shows the pair is currently in a short-term downtrend as prices are trading under our favored short-term moving average of 21 linear periods. Over the longer term trend, as seen on the chart by the 90 day Linear Regression Channels indicator, the pair continues to be in a downtrend with the channels center line coinciding with the 23.6% fibo retracement level at 0.9024 (possible targets if prices break below 0.9100).

SC USDCHF 2013.11.22


USDCHF Trends Data: Linear Regression Indicator

10-day current trend is BEARISH / Trend strength of -91.6 pips
30-day current trend is BULLISH / Trend strength of 150.4 pips
60-day current trend is BEARISH / Trend strength of -217.1 pips
90-day current trend is BEARISH / Trend strength of -300.1 pips
180-day current trend is BEARISH / Trend strength of -459.8 pips

Fibonacci Retracement Levels over last 100 Days

— 0.000 – 0.88892
— 0.236 – 0.90924
— 0.382 – 0.92182
— 0.500 – 0.93198
— 0.618 – 0.94214
— 0.764 – 0.95472
— 1.000 – 0.97504


By CountingPips.com – Forex Trading Apps & Currency Trade Tools


Disclaimer: Foreign Currency trading and trading on margin carries a high level of risk and volatility and can result in loss of part or all of your investment. All information and opinions contained do not constitute investment advice and accuracy of prices, charts, calculations cannot be guaranteed.


EURUSD Forex Trading Pivot Point Levels for 2013.11.22

2013.11.22 13:30 6:30AM ET | EURUSD Currency Pair

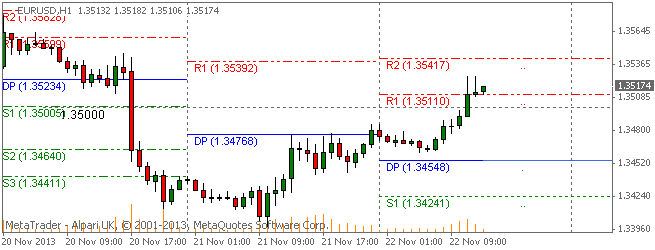
Here are the current Pivot Points Levels with Support (S) and Resistance (R) for the EURUSD currency pair. Price action is currently trading over the daily pivot point at the 1.35174 price level, according to data at 6:30 AM ET. The pair opened the Asian trading session earlier today above the daily pivot and has traded higher over the course of the day with prices currently exchanging above the R1 resistance level.

SC EURUSD 2013.11.22

Daily Pivot Point: 1.34548
— S1 – 1.34242
— S2 – 1.33679
— S3 – 1.33373
— R1 – 1.35111
— R2 – 1.35417
— R3 – 1.35980


Weekly Pivot Points: EURUSD

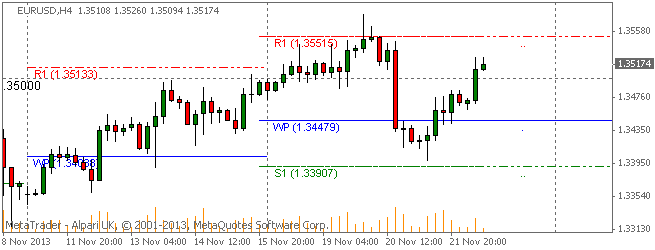
Prices are currently trading higher than the weekly pivot point and over the 1.3500 major level at time of writing. The EURUSD had been on a bearish pace this week after opening the trading week above the weekly pivot but has since pared the losses to show a small gain on the week so far.

SC EURUSD 2013.11.22

Weekly Pivot Point: 1.34479
— S1 – 1.33907
— S2 – 1.32871
— S3 – 1.32299
— R1 – 1.35515
— R2 – 1.36087
— R3 – 1.37123


By CountingPips.comForex Trading Apps & Currency Trade Tools


Disclaimer: Foreign Currency trading and trading on margin carries a high level of risk and volatility and can result in loss of part or all of your investment. All information and opinions contained do not constitute investment advice and accuracy of prices, charts, calculations cannot be guaranteed.