USDCAD pulls back from new cycle high at 1.0600

2013.11.28 | USDCAD Market Analysis

USDCAD Trends & Fibonacci Retracement Levels

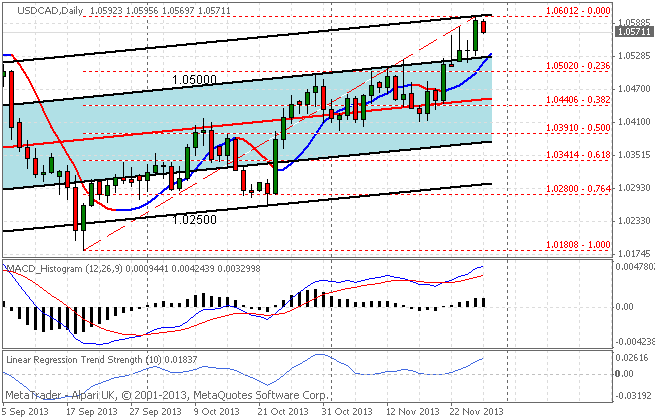
The USDCAD currency pair has been declining in forex market trading today with the USDCAD registering a high of 1.05956 and a low of 1.05697 on the day. Trends data shows the pair is currently in a short-term uptrend with pricesĀ  trading over the 21 period linear short-term moving average. Over the longer term trend, as seen on the chart by the 90 day Linear Regression Channels, the pair continues to be in an uptrend that established a new fibonacci retracement cycle high at 1.0601 level on Wednesday.

SC USDCAD 2013.11.28


USDCAD Trends Data: Linear Regression Indicator

10-day current trend is BULLISH / Trend strength of 172.0 pips
30-day current trend is BULLISH / Trend strength of 217.9 pips
60-day current trend is BULLISH / Trend strength of 224.7 pips
90-day current trend is BULLISH / Trend strength of 126.1 pips
180-day current trend is BULLISH / Trend strength of 297.8 pips

Fibonacci Retracement Levels: Past 100 Days

— 0.000 – 1.06012
— 0.236 – 1.05020
— 0.382 – 1.04406
— 0.500 – 1.03910
— 0.618 – 1.03414
— 0.764 – 1.02800
— 1.000 – 1.01808


By CountingPips.com – Forex Trading Apps & Currency Trade Tools


Disclaimer: Foreign Currency trading and trading on margin carries a high level of risk and volatility and can result in loss of part or all of your investment. All information and opinions contained do not constitute investment advice and accuracy of prices, charts, calculations cannot be guaranteed.


EURUSD Forex Trading Pivot Point Levels for 2013.11.28

2013.11.28 13:30 6:30AM ET | EURUSD Currency Pair

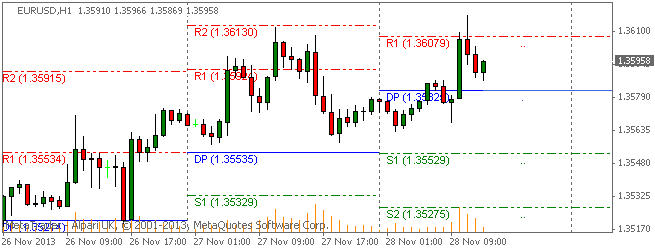
Here are the current Pivot Points Levels with Support (S) and Resistance (R) for the EURUSD currency pair today. Price action is currently trading over the daily pivot point at the 1.35958 price level, according to data at 6:30 AM ET. The
EURUSD high for the day has been 1.36178 while the low of day reached to 1.35631. The pair opened the Asian trading session earlier today below the daily pivot and has trended higher over the course of the day and found resistance above the R1 level.

SC EURUSD 2013.11.28

Daily Pivot Point: 1.35825
— S1 – 1.35529
— S2 – 1.35275
— S3 – 1.34979
— R1 – 1.36079
— R2 – 1.36375
— R3 – 1.36629


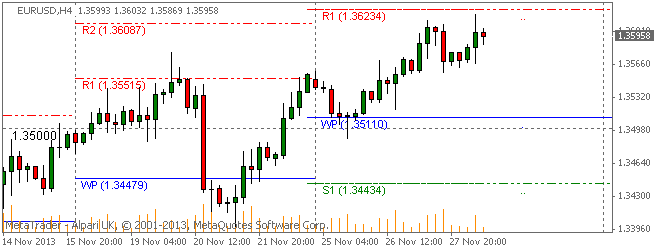
Weekly Pivot Points: EURUSD

Prices are currently trading over the weekly pivot point at time of writing. The EURUSD has been on a bullish pace this week after opening the trading week above the weekly pivot. The pair dipped earlier in the week finding support at the 1.3500 level and pivot area before starting on a bullish path higher.

SC EURUSD 2013.11.28

Weekly Pivot Point: 1.35110
— S1 – 1.34434
— S2 – 1.33310
— S3 – 1.32634
— R1 – 1.36234
— R2 – 1.36910
— R3 – 1.38034


By CountingPips.comForex Trading Apps & Currency Trade Tools


Disclaimer: Foreign Currency trading and trading on margin carries a high level of risk and volatility and can result in loss of part or all of your investment. All information and opinions contained do not constitute investment advice and accuracy of prices, charts, calculations cannot be guaranteed.


GBPUSD Forex Trading Pivot Point Levels for 2013.11.28

2013.11.28 13:30 6:30AM ET | GBPUSD Currency Pair

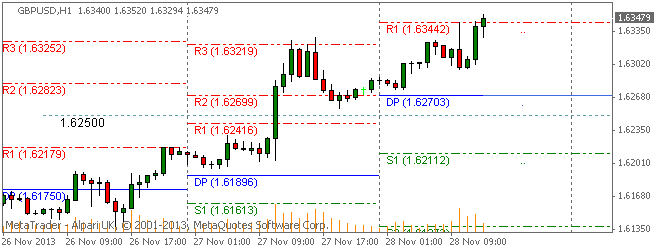
Here are the current Pivot Points Levels with Support (S) and Resistance (R) for the GBPUSD currency pair today. Price action is currently trading above the daily pivot point at the 1.63479 price level, according to data at 6:30 AM ET. The
GBPUSD high for the day has been 1.63520 while the low of day reached 1.62760. The pair opened the Asian trading session earlier today slightly higher than the daily pivot and has trended higher over the course of the day to above the R1 resistance level.

SC GBPUSD 2013.11.28

Daily Pivot Point: 1.62703
— S1 – 1.62113
— S2 – 1.61373
— S3 – 1.60783
— R1 – 1.63443
— R2 – 1.64033
— R3 – 1.64773


Weekly Pivot Points: GBPUSD

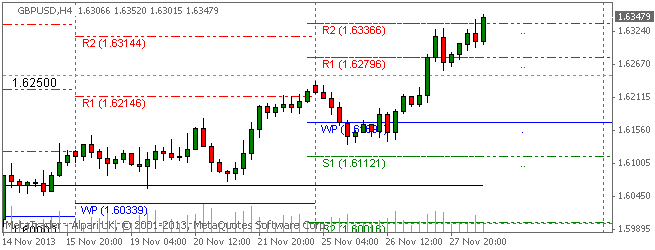
Prices are currently trading over the weekly pivot point at time of writing with the pair ascending above the R1 and R2 levels towards the 1.6450 level. The GBPUSD has been on a bullish pace this week after opening the trading week above the weekly pivot.

SC GBPUSD 2013.11.28

Weekly Pivot Point: 1.61691
— S1 – 1.61121
— S2 – 1.60016
— S3 – 1.59446
— R1 – 1.62796
— R2 – 1.63366
— R3 – 1.64471


By CountingPips.com – Forex Trading Apps & Currency Trade Tools


Disclaimer: Foreign Currency trading and trading on margin carries a high level of risk and volatility and can result in loss of part or all of your investment. All information and opinions contained do not constitute investment advice and accuracy of prices, charts, calculations cannot be guaranteed.


USDJPY remains on strong bullish pace this week over 102.00

2013.11.28 13:30 6:30AM ET | USDJPY Currency Pair

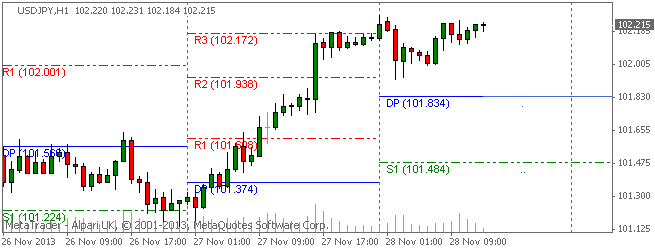
Here are the current Pivot Points Levels with Support (S) and Resistance (R) for the USDJPY currency pair today. Price action is currently trading over the daily pivot point at the 102.215 price level, according to data at 6:30 AM ET. The USDJPY high for the day has been 102.269 while the low of day reached to 101.928. The pair opened the Asian trading session earlier today above the daily pivot and despite a dip in early trading, has trended back higher over the course of the day.

SC USDJPY 2013.11.28

Daily Pivot Point: 101.834
— S1 – 101.484
— S2 – 100.820
— S3 – 100.470
— R1 – 102.498
— R2 – 102.848
— R3 – 103.512


Weekly Pivot Points: USDJPY

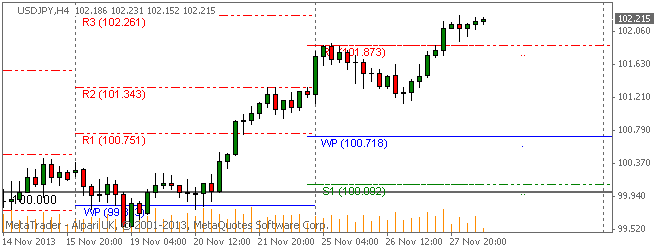
Prices are currently trading sharply over the weekly pivot point at time of writing. The USDJPY has been on a strong bullish pace this week after opening the trading week above the weekly pivot and has extended its bullish trend above the weekly R1 resistance level to over 102.00.

SC USDJPY 2013.11.28

Weekly Pivot Point: 100.718
— S1 – 100.093
— S2 – 98.937
— S3 – 98.312
— R1 – 101.874
— R2 – 102.499
— R3 – 103.655


By CountingPips.com – Forex Trading Apps & Currency Trading Tools


Disclaimer: Foreign Currency trading and trading on margin carries a high level of risk and volatility and can result in loss of part or all of your investment. All information and opinions contained do not constitute investment advice and accuracy of prices, charts, calculations cannot be guaranteed.


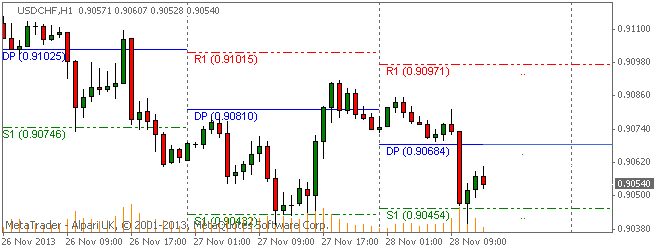
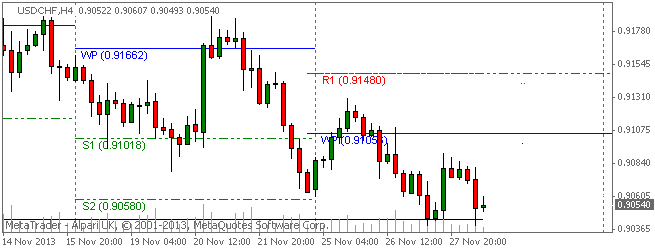
USDCHF Forex Trading Pivot Point Levels for 2013.11.28

2013.11.28 13:30 6:30AM ET | USDCHF Currency Pair

Here are the current Pivot Points Levels with Support (S) and Resistance (R) for the USDCHF currency pair today. Price action is currently trading under the daily pivot point at the 0.90540 price level, according to data at 6:30 AM ET. The USDCHF high for the day has been 0.90854 while the low of day reached to 0.90399. The pair opened the Asian trading session earlier today above the daily pivot and has traded lower over the course of the day extending down to the S1 support level.

SC USDCHF 2013.11.28

Daily Pivot Point: 0.90684
— S1 – 0.90453
— S2 – 0.90167
— S3 – 0.89936
— R1 – 0.90970
— R2 – 0.91201
— R3 – 0.91487


Weekly Pivot Points: USDCHF

Prices are currently trading lower than the weekly pivot point at time of writing. The USDCHF has been on a bearish pace this week after opening the trading week below the weekly pivot.

SC USDCHF 2013.11.28

Weekly Pivot Point: 0.91056
— S1 – 0.90208
— S2 – 0.89784
— S3 – 0.88936
— R1 – 0.91480
— R2 – 0.92328
— R3 – 0.92752


By CountingPips.com – Forex Trading Apps & Currency Trade Tools


Disclaimer: Foreign Currency trading and trading on margin carries a high level of risk and volatility and can result in loss of part or all of your investment. All information and opinions contained do not constitute investment advice and accuracy of prices, charts, calculations cannot be guaranteed.


EURUSD Daily Forex Fibonacci Levels & Trends Data 2013.11.28

2013.11.28 | EURUSD Market Analysis

EURUSD Trends & Fibonacci Retracement Levels

The EURUSD currency pair has been gaining in forex market trading for the past three days with the EURUSD registering a high of 1.36178 and a low of 1.35631 so far today. Trends data shows the pair is currently in a short-term uptrend with prices trading over the short-term moving average of 21 linear periods. Over the longer term trend, as seen on the chart by the 90 day Linear Regression Channels indicator, the pair continues to be in an uptrend with prices just below the center regression line. Look for the 23.6% fibo retracement level to provide an important support and resistance level.

SC EURUSD 2013.11.28


EURUSD Trends Data: Linear Regression Indicator

10-day current trend is BULLISH / Trend strength of 129.4 pips
30-day current trend is BEARISH / Trend strength of -280.4 pips
60-day current trend is BULLISH / Trend strength of 202.8 pips
90-day current trend is BULLISH / Trend strength of 381.1 pips
180-day current trend is BULLISH / Trend strength of 748.0 pips

Fibonacci Retracement Levels: Past 100 Days

— 0.000 – 1.38317
— 0.236 – 1.36264
— 0.382 – 1.34994
— 0.500 – 1.33967
— 0.618 – 1.32940
— 0.764 – 1.31670
— 1.000 – 1.29617


By CountingPips.com – Forex Trading Apps & Currency Trading Tools


Disclaimer: Foreign Currency trading and trading on margin carries a high level of risk and volatility and can result in loss of part or all of your investment. All information and opinions contained do not constitute investment advice and accuracy of prices, charts, calculations cannot be guaranteed.


NZDUSD Daily Forex Fibonacci Levels & Trends Data 2013.11.28

2013.11.28 | NZDUSD Market Analysis

NZDUSD Trends & Fibonacci Retracement Levels

The NZDUSD currency pair has been rising slightly in forex market trading today with the NZDUSD registering a high of 0.81741 and a low of 0.81268 on the day. Trends data shows the pair is currently in a short-term downtrendwith pricesĀ  trading under our 21 period linear short-term moving average. Over the longer term trend, as seen on the chart by the 90 day Linear Regression Channels indicator, the pair continues to be in an uptrend with prices trading just above the 50% retracement level at 0.8128.

SC NZDUSD 2013.11.28


NZDUSD Trends Data: Linear Regression Indicator

10-day current trend is BEARISH / Trend strength of -212.7 pips
30-day current trend is BEARISH / Trend strength of -244.4 pips
60-day current trend is BULLISH / Trend strength of 99.3 pips
90-day current trend is BULLISH / Trend strength of 484.2 pips
180-day current trend is BEARISH / Trend strength of -72.5 pips

Fibonacci Retracement Levels: Past 100 Days

— 0.000 – 0.85410
— 0.236 – 0.83464
— 0.382 – 0.82260
— 0.500 – 0.81286
— 0.618 – 0.80313
— 0.764 – 0.79109
— 1.000 – 0.77163


By CountingPips.comForex Trading Apps & Currency Trade Tools


Disclaimer: Foreign Currency trading and trading on margin carries a high level of risk and volatility and can result in loss of part or all of your investment. All information and opinions contained do not constitute investment advice and accuracy of prices, charts, calculations cannot be guaranteed.


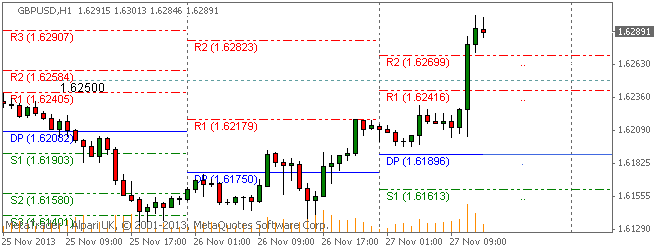
GBPUSD Forex Trading Pivot Point Levels for 2013.11.27

2013.11.27 13:30 6:30AM ET | GBPUSD Currency Pair

Here are the current Pivot Points Levels with Support (S) and Resistance (R) for the GBPUSD currency pair today. Price action is currently trading sharply over the daily pivot point at the 1.62891 price level, according to data at 6:30 AM ET.
The GBPUSD high for the day has been 1.63026 while the low of day reached 1.61964. The pair opened the Asian trading session earlier today above the daily pivot and has continued to trade higher over the course of the day as it has pushed through R1 and R2 resistance levels.

SC GBPUSD 2013.11.27

Daily Pivot Point: 1.61896
— S1 – 1.61613
— S2 – 1.61093
— S3 – 1.60810
— R1 – 1.62416
— R2 – 1.62699
— R3 – 1.63219


Weekly Pivot Points: GBPUSD

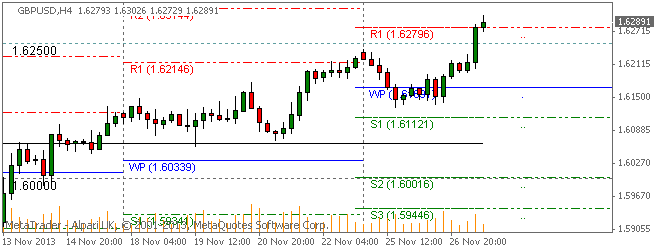
Prices are currently trading over the weekly pivot point at time of writing. The GBPUSD has been on an overall bullish pace this week after opening the trading week above the weekly pivot, falling to below the pivot and then finding buying support to propel higher.

SC GBPUSD 2013.11.27

Weekly Pivot Point: 1.61691
— S1 – 1.61121
— S2 – 1.60016
— S3 – 1.59446
— R1 – 1.62796
— R2 – 1.63366
— R3 – 1.64471


By CountingPips.comForex Trading Apps & Currency Trade Tools


Disclaimer: Foreign Currency trading and trading on margin carries a high level of risk and volatility and can result in loss of part or all of your investment. All information and opinions contained do not constitute investment advice and accuracy of prices, charts, calculations cannot be guaranteed.


EURUSD Forex Trading Pivot Point Levels for 2013.11.27

2013.11.27 13:30 6:30AM ET | EURUSD Currency Pair

Here are the current Pivot Points Levels with Support (S) and Resistance (R) for the EURUSD currency pair today. Price action is currently trading above the daily pivot point at the 1.35969 price level, according to data at 6:30 AM ET. The
EURUSD high for the day has been 1.36121 while the low of day reached 1.35571. The pair opened the Asian trading session earlier today higher than the daily pivot and has continued to trend higher over the course of the day all the way to the R2 level where resistance was found.

SC EURUSD 2013.11.27

Daily Pivot Point: 1.35535
— S1 – 1.35328
— S2 – 1.34940
— S3 – 1.34733
— R1 – 1.35923
— R2 – 1.36130
— R3 – 1.36518


Weekly Pivot Points: EURUSD

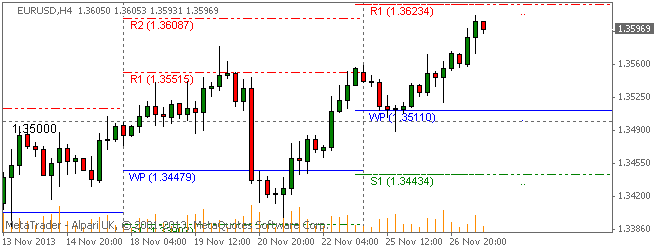
Prices are currently trading over the weekly pivot point at time of writing. The EURUSD has been on a bullish pace this week after opening the trading week above and bouncing off of the weekly pivot.

SC EURUSD 2013.11.27

Weekly Pivot Point: 1.35110
— S1 – 1.34434
— S2 – 1.33310
— S3 – 1.32634
— R1 – 1.36234
— R2 – 1.36910
— R3 – 1.38034


By CountingPips.comForex Trading Apps & Currency Trade Tools


Disclaimer: Foreign Currency trading and trading on margin carries a high level of risk and volatility and can result in loss of part or all of your investment. All information and opinions contained do not constitute investment advice and accuracy of prices, charts, calculations cannot be guaranteed.


USDJPY Forex Trading Pivot Point Levels for 2013.11.27

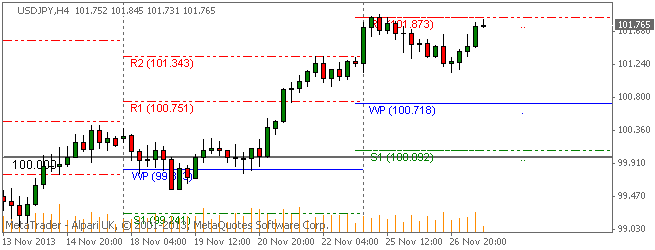
2013.11.27 13:30 6:30AM ET | USDJPY Currency Pair

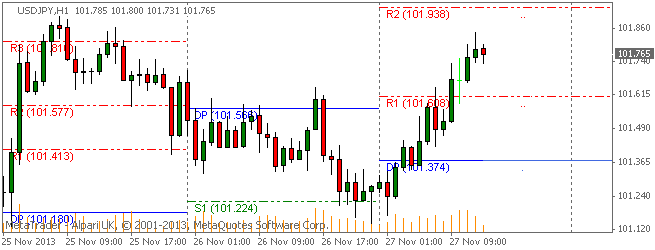
Here are the current Pivot Points Levels with Support (S) and Resistance (R) for the USDJPY currency pair today. Price action is currently trading higher than the daily pivot point at the 101.765 price level, according to data at 6:30 AM ET.
The USDJPY high for the day has been 101.845 while the low of day reached 101.170. The pair opened the Asian trading session earlier today below the daily pivot and has trended higher over the course of the day through the R1 resistance level.

SC USDJPY 2013.11.27

Daily Pivot Point: 101.374
— S1 – 101.044
— S2 – 100.810
— S3 – 100.480
— R1 – 101.608
— R2 – 101.938
— R3 – 102.172


Weekly Pivot Points: USDJPY

Prices are currently trading over the weekly pivot point at time of writing and reside just below the R1 resistance level. The USDJPY has been on an overall bullish pace this week after opening the trading week higher than the weekly pivot.

SC USDJPY 2013.11.27

Weekly Pivot Point: 100.718
— S1 – 100.093
— S2 – 98.937
— S3 – 98.312
— R1 – 101.874
— R2 – 102.499
— R3 – 103.655


By CountingPips.comForex Trading Apps & Currency Trade Tools


Disclaimer: Foreign Currency trading and trading on margin carries a high level of risk and volatility and can result in loss of part or all of your investment. All information and opinions contained do not constitute investment advice and accuracy of prices, charts, calculations cannot be guaranteed.