USDCHF Forex Trading Pivot Point Levels for 2013.11.05

2013.11.05 13:00 6:00AM ET | USDCHF Currency Pair

Here are the current Pivot Points Levels with Support (S) and Resistance (R) for the USDCHF currency pair. Price action is currently trading slightly under the daily pivot point at the 0.91090 price level, according to data at 6:00 AM ET. The pair opened the Asian trading session earlier today below the daily pivot and has traded higher over the course of the day.

SC USDCHF 2013.11.05

Daily Pivot Point: 0.91129
— S1 – 0.90746
— S2 – 0.90518
— S3 – 0.90135
— R1 – 0.91357
— R2 – 0.91740
— R3 – 0.91968


Weekly Pivot Points: USDCHF

Prices are currently trading over the weekly pivot point at time of writing. The USDCHF has been on a slightly bearish pace so far this week after opening the trading week above the weekly and monthly pivots.

SC USDCHF 2013.11.05

Weekly Pivot Point: 0.90591
— S1 – 0.89814
— S2 – 0.88424
— S3 – 0.87647
— R1 – 0.91981
— R2 – 0.92758
— R3 – 0.94148


Monthly Pivot Point: 0.90441
— S1 – 0.89112
— S2 – 0.87563
— S3 – 0.86234
— R1 – 0.91990
— R2 – 0.93319
— R3 – 0.94868


By CountingPips.com – Forex Trading Apps & Currency Trade Tools


Disclaimer: Foreign Currency trading and trading on margin carries a high level of risk and volatility and can result in loss of part or all of your investment. All information and opinions contained do not constitute investment advice and accuracy of prices, charts, calculations cannot be guaranteed.


EURUSD Forex Trading Pivot Point Levels for 2013.11.05

2013.11.05 13:00 6:00AM ET | EURUSD Currency Pair

Here are the current Pivot Points Levels with Support (S) and Resistance (R) for the EURUSD currency pair. Price action is currently trading over the daily pivot point at the 1.35013 price level, according to data at 6:00 AM ET. The pair opened the Asian trading session earlier today above the daily pivot and has headed lower although catching a bounce at the pivot point today.

SC EURUSD 2013.11.05

Daily Pivot Point: 1.34929
— S1 – 1.34620
— S2 – 1.34107
— S3 – 1.33798
— R1 – 1.35442
— R2 – 1.35751
— R3 – 1.36264


Weekly Pivot Points: EURUSD

Prices are currently trading under the weekly pivot point at time of writing. The EURUSD has been on a sideways path so far this week after opening the trading week below the weekly and monthly pivots.

SC EURUSD 2013.11.05

Weekly Pivot Point: 1.35941
— S1 – 1.33711
— S2 – 1.32565
— S3 – 1.30335
— R1 – 1.37087
— R2 – 1.39317
— R3 – 1.40463


Monthly Pivot Point: 1.36305
— S1 – 1.34295
— S2 – 1.32711
— S3 – 1.30701
— R1 – 1.37889
— R2 – 1.39899
— R3 – 1.41483


By CountingPips.com – Forex Trading Apps & Currency Trade Tools


Disclaimer: Foreign Currency trading and trading on margin carries a high level of risk and volatility and can result in loss of part or all of your investment. All information and opinions contained do not constitute investment advice and accuracy of prices, charts, calculations cannot be guaranteed.


USDJPY Forex Trading Pivot Point Levels for 2013.11.05

2013.11.05 13:00 6:00AM ET | USDJPY Currency Pair

Here are the current Pivot Points Levels with Support (S) and Resistance (R) for the USDJPY currency pair. Price action is currently trading below the daily pivot point this morning at the 98.254 price level, according to data at 6:00 AM ET. The pair opened the Asian trading session earlier today virtually on top of the daily pivot and has trended lower over the course of the day to between S2 and S3 support levels.

SC USDJPY 2013.11.05

Daily Pivot Point: 98.652
— S1 – 98.470
— S2 – 98.345
— S3 – 98.163
— R1 – 98.777
— R2 – 98.959
— R3 – 99.084


Weekly Pivot Points: USDJPY

Prices are currently trading under the weekly pivot point at time of writing. The USDJPY has been on a bearish pace in the early parts of this week after opening the trading week above the weekly and monthly pivots.

SC USDJPY 2013.11.05

Weekly Pivot Point: 98.317
— S1 – 97.795
— S2 – 96.914
— S3 – 96.392
— R1 – 99.198
— R2 – 99.720
— R3 – 100.601


Monthly Pivot Point: 97.973
— S1 – 96.949
— S2 – 95.545
— S3 – 94.521
— R1 – 99.377
— R2 – 100.401
— R3 – 101.805


By CountingPips.comForex Trading Apps & Currency Trade Tools


Disclaimer: Foreign Currency trading and trading on margin carries a high level of risk and volatility and can result in loss of part or all of your investment. All information and opinions contained do not constitute investment advice and accuracy of prices, charts, calculations cannot be guaranteed.


EURUSD Forex Trading Pivot Point Levels for 2013.11.04

2013.11.04 13:00 6:00AM ET | EURUSD Currency Pair

Here are the current Pivot Points Levels with Support (S) and Resistance (R) for the EURUSD currency pair. Price action is currently trading under the daily pivot point at the 1.3505 price level, according to data at 6:00 AM ET. The pair opened the Asian trading session earlier today below the daily pivot and has traded slightly higher from the beginning of the day.

SC EURUSD 2013.11.04

Daily Pivot Point: 1.35180
— S1 – 1.34472
— S2 – 1.34085
— S3 – 1.33377
— R1 – 1.35567
— R2 – 1.36275
— R3 – 1.36662


Weekly Pivot Points: EURUSD

Prices are currently trading under the weekly pivot point at time of writing after opening the trading week below both the weekly and monthly pivot point levels.

SC EURUSD 2013.11.04

Weekly Pivot Point: 1.35941
— S1 – 1.33711
— S2 – 1.32565
— S3 – 1.30335
— R1 – 1.37087
— R2 – 1.39317
— R3 – 1.40463


Monthly Pivot Point: 1.36305
— S1 – 1.34295
— S2 – 1.32711
— S3 – 1.30701
— R1 – 1.37889
— R2 – 1.39899
— R3 – 1.41483


By CountingPips.comForex Trading Tools


Disclaimer: Foreign Currency trading and trading on margin carries a high level of risk and volatility and can result in loss of part or all of your investment. All information and opinions contained do not constitute investment advice and accuracy of prices, charts, calculations cannot be guaranteed.


USDJPY Forex Trading Pivot Point Levels for 2013.11.04

2013.11.04 13:00 6:00AM ET | USDJPY Currency Pair

Here are the current Pivot Points Levels with Support (S) and Resistance (R) for the USDJPY currency pair. Price action is currently trading above the daily pivot point at the 98.691 price level, according to data at 6:00 AM ET. The pair opened the Asian trading session earlier today higher than the daily pivot and has trended slightly lower over the course of the day.

SC USDJPY 2013.11.04

Daily Pivot Point: 98.438
— S1 – 98.038
— S2 – 97.399
— S3 – 96.999
— R1 – 99.077
— R2 – 99.477
— R3 – 100.116


Weekly Pivot Points: USDJPY

Prices are currently trading over the weekly pivot point at time of writing after opening the trading week above both the weekly and monthly pivot point levels.

SC USDJPY 2013.11.04

Weekly Pivot Point: 98.317
— S1 – 97.795
— S2 – 96.914
— S3 – 96.392
— R1 – 99.198
— R2 – 99.720
— R3 – 100.601


Monthly Pivot Point: 97.973
— S1 – 96.949
— S2 – 95.545
— S3 – 94.521
— R1 – 99.377
— R2 – 100.401
— R3 – 101.805


By CountingPips.comForex Apps & Currency Trade Tools


Disclaimer: Foreign Currency trading and trading on margin carries a high level of risk and volatility and can result in loss of part or all of your investment. All information and opinions contained do not constitute investment advice and accuracy of prices, charts, calculations cannot be guaranteed.


USDCHF Forex Trading Pivot Point Levels for 2013.11.04

2013.11.04 13:00 6:00AM ET | USDCHF Currency Pair

Here are the current Pivot Points Levels with Support (S) and Resistance (R) for the USDCHF currency pair. Price action is currently trading over the daily pivot point at the 0.91187 price level, according to data at 6:00 AM ET. The pair opened the Asian trading session earlier today above the daily pivot and has traded mostly sideways so far on this Monday Nov 4th.

SC USDCHF 2013.11.04

Daily Pivot Point: 0.91073
— S1 – 0.90778
— S2 – 0.90352
— S3 – 0.90057
— R1 – 0.91499
— R2 – 0.91794
— R3 – 0.92220


Weekly Pivot Points: USDCHF

Prices are currently trading above the weekly pivot point at time of writing after opening the trading week higher than both the weekly and monthly pivot point lines.

SC USDCHF 2013.11.04

Weekly Pivot Point: 0.90591
— S1 – 0.89814
— S2 – 0.88424
— S3 – 0.87647
— R1 – 0.91981
— R2 – 0.92758
— R3 – 0.94148


Monthly Pivot Point: 0.90441
— S1 – 0.89112
— S2 – 0.87563
— S3 – 0.86234
— R1 – 0.91990
— R2 – 0.93319
— R3 – 0.94868


By CountingPips.com – Currency Trading Apps & Forex News


Disclaimer: Foreign Currency trading and trading on margin carries a high level of risk and volatility and can result in loss of part or all of your investment. All information and opinions contained do not constitute investment advice and accuracy of prices, charts, calculations cannot be guaranteed.


GBPUSD Forex Trading Pivot Point Levels for 2013.11.04

2013.11.04 13:00 6:00AM ET | GBPUSD Currency Pair

Here are the current Pivot Points Levels with Support (S) and Resistance (R) for the GBPUSD currency pair. Price action is currently trading right at the daily pivot point at the 1.59597 price level, according to data at 6:00 AM ET. The pair opened the Asian trading session earlier today lower than the daily pivot and has trended higher on Monday Nov 4th.

SC GBPUSD 2013.11.04

Daily Pivot Point: 1.59589
— S1 – 1.58724
— S2 – 1.58211
— S3 – 1.57346
— R1 – 1.60102
— R2 – 1.60967
— R3 – 1.61480


Weekly Pivot Points: GBPUSD

Prices are currently trading under the weekly pivot point at the beginning of the trading week after opening the trading week below both the weekly and monthly pivot lines.

SC GBPUSD 2013.11.04

Weekly Pivot Point: 1.60129
— S1 – 1.58184
— S2 – 1.57132
— S3 – 1.55187
— R1 – 1.61181
— R2 – 1.63126
— R3 – 1.64178


Monthly Pivot Point: 1.60640
— S1 – 1.58688
— S2 – 1.56977
— S3 – 1.55025
— R1 – 1.62351
— R2 – 1.64303
— R3 – 1.66014


By CountingPips.comForex Trading Apps & Currency Trade Tools


Disclaimer: Foreign Currency trading and trading on margin carries a high level of risk and volatility and can result in loss of part or all of your investment. All information and opinions contained do not constitute investment advice and accuracy of prices, charts, calculations cannot be guaranteed.


VIDEO: Air France Sets Tough Conditions For Alitalia Investment: Report

Financial daily Il Sole 24 Ore reported on Sunday, that Air France-KLM has set tough conditions, including 5,000 job cuts, for investing more money in loss-making Italian airline Alitalia.In an unsourced report, the Italian newspaper said Air France-KLM, which is Alitalia’s biggest shareholder with a 25 percent stake, had dictated its conditions to Italian Transport Minister Maurizio Lupi “around ten days ago”. Air France-KLM’s conditions, it said, included the removal of Alitalia’s board of directors and a restructuring of its debts of nearly 1 billion euros ($1.35 billion) to reduce them by 70 to 80 percent.

Large Forex Speculators were bearish on US Dollar for 3 straight weeks to Oct 22nd

By CountingPips.com

Cot-Totals


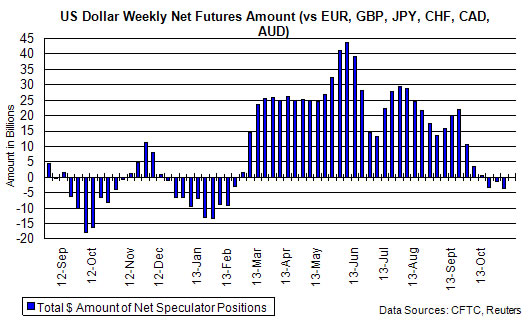
The latest data for the weekly Commitments of Traders (COT) report was released on Friday by the Commodity Futures Trading Commission (CFTC) and showed that large futures speculators turned bearish on the US dollar on October 8th and then registered three straight weeks of bearish positions through October 22nd.

Non-commercial large futures traders, including hedge funds and large International Monetary Market speculators, had an overall US dollar short position totaling $-3.64 billion as of Tuesday October 22nd. This was a weekly change of $-2.4 billion from the total position of $-1.24 billion that was registered on October 15th, according to data from Reuters that calculates this amount by the total of US dollar contracts against the combined contracts of the euro, British pound, Japanese yen, Australian dollar, Canadian dollar and the Swiss franc.

US dollar positions, on October 22nd, were at a new lowest level since February 5th when US dollar bets were short at a total of $-9.15 billion.

This latest batch of data, three weeks worth for October 8th, 15th & 22nd, is a catch up for the missed releases during the government shutdown and does not cover last week’s positions.

Individual Currencies Large Speculators Positions in Futures:

The large non-commercial net positions for each of the individual major currencies directly against the US dollar on October 22nd showed weekly increases for the euro, British pound sterling, Swiss franc, Canadian dollar, Australian dollar and the New Zealand dollar while there were declines for the Japanese yen and the Mexican peso.


Individual Currency Charts:


EuroFX:

eurofx

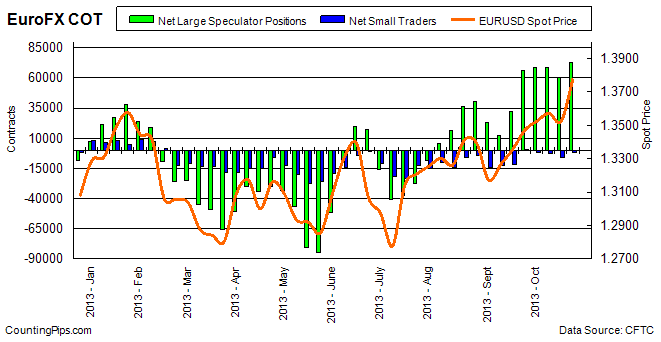
Last Six Weeks of Large Trader Positions: EuroFX

DateLarge Trader Net PositionsWeekly Change
09/17/20133190719211
09/24/20136584433937
10/01/2013682762432
10/08/201368683407
10/15/201360374-8309
10/22/20137243412060


British Pound Sterling:

GBP

Last Six Weeks of Large Trader Positions: Pound Sterling

DateLg Trader NetWeekly Change
09/17/2013-631031856
09/24/201311747484
10/01/20131496322
10/08/201387717275
10/15/2013122313460
10/22/2013142622031


Japanese Yen:

JPY

Last Six Weeks of Large Trader Positions: Yen

DateLg Trader NetWeekly Change
09/17/2013-887946272
09/24/2013-92818-4024
10/01/2013-8232410494
10/08/2013-5709725227
10/15/2013-59266-2169
10/22/2013-71802-12536


Swiss Franc:

chf

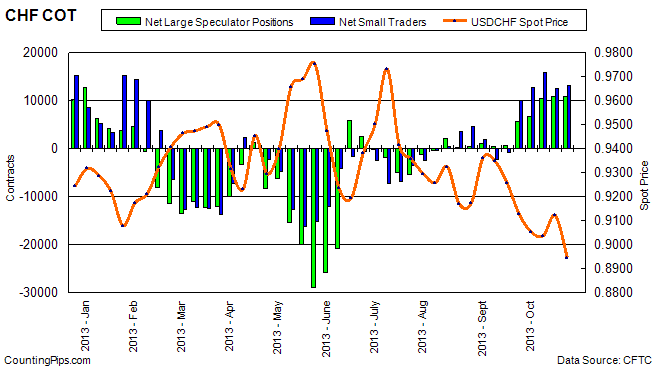
Last Six Weeks of Large Trader Positions: Franc

DateLg Trader NetWeekly Change
09/17/2013616196
09/24/201357455129
10/01/20136636891
10/08/2013104153779
10/15/201310767352
10/22/201310931164


Canadian Dollar:

cad

Last Six Weeks of Large Trader Positions: CAD

DateLg Trader NetWeekly Change
09/17/2013-1876412178
09/24/2013-567513089
10/01/2013-9554720
10/08/2013-8663-7708
10/15/2013-10814-2151
10/22/2013-53645450


Australian Dollar:

aud

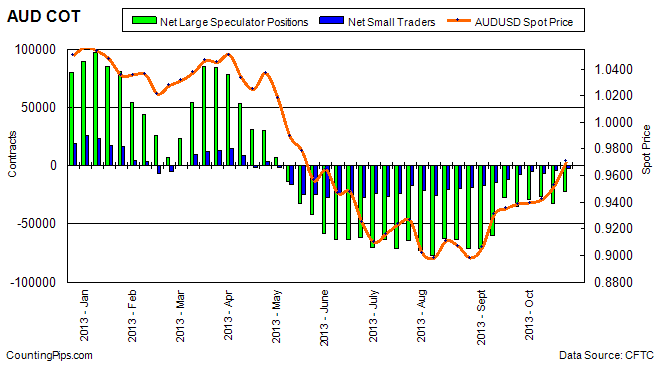
Last Six Weeks of Large Trader Positions: AUD

DateLg Trader NetWeekly Change
09/17/2013-2736032672
09/24/2013-34819-7459
10/01/2013-288046015
10/08/2013-264042400
10/15/2013-32237-5833
10/22/2013-2211110126


New Zealand Dollar:

nzd

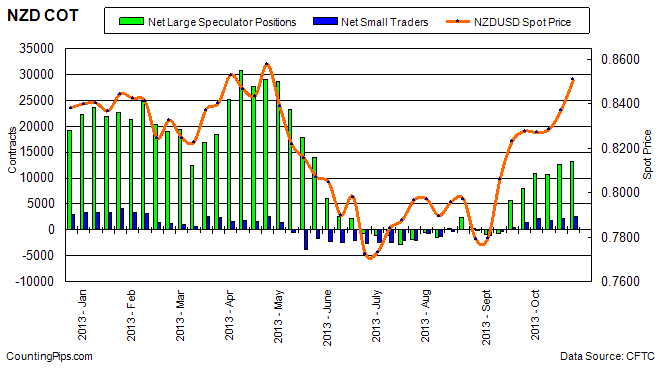
Last Six Weeks of Large Trader Positions: NZD

DateLg Trader NetWeekly Change
09/17/201356576258
09/24/201380552398
10/01/2013108912836
10/08/201310766-125
10/15/2013126681902
10/22/201313114446


Mexican Peso:

mxn

Last Six Weeks of Large Trader Positions: MXN

DateLg Trader NetWeekly Change
09/17/2013-10201-18480
09/24/20131402324224
10/01/201314601578
10/08/201310933-3668
10/15/20137761-3172
10/22/20137214-547


*COT Report: The weekly commitment of traders report summarizes the total trader positions for open contracts in the futures trading markets. The CFTC categorizes trader positions according to commercial hedgers (traders who use futures contracts for hedging as part of the business), non-commercials (large traders who speculate to realize trading profits) and nonreportable traders (usually small traders/speculators).

The Commitment of Traders report is published every Friday by the Commodity Futures Trading Commission (CFTC) and shows futures positions data that was reported as of the previous Tuesday (3 days behind).

Each currency contract is a quote for that currency directly against the U.S. dollar, a net short amount of contracts means that more speculators are betting that currency to fall against the dollar and a net long position expect that currency to rise versus the dollar.

(The graphs overlay the forex spot closing price of each Tuesday when COT trader positions are reported for each corresponding spot currency pair.)

See more information and explanation on the weekly COT report from the CFTC website.


Article by CountingPips.comCurrency Trading News


US 10-Year Treasury Speculators added to bearish positions on Oct 22nd

By CountingPips.com

Weekly CFTC Net Speculator Report

10 Year Treasuries: Large trader and futures market speculators added to their overall bearish positions for a third straight week on October 22nd in the 10-year treasury note futures. The 10-year treasury non-commercial contracts totaled a net position of -142,550 contracts in the data reported for October 22nd, according to the Commodity Futures Trading Commission (CFTC). This was a change of -42,762 contracts from the previous week’s total of -99,788 net contracts that was registered on October 15th.


10Yr

In the same time-frame, the yield on the 10 Year treasury note declined from 2.75 on Tuesday October 15th to 2.54 on Tuesday October 22nd, according to US Treasury data.

*The COT data was not published by the CFTC for close to a month due to the partial government shutdown and the latest data is up to October 22nd.


Last 6 Weeks of Large Trader Positions

DateNet Large SpecsWeekly Change10 Year Yield
09/17/2013-126026-407022.86
09/24/2013-89107369192.67
10/01/2013-28536605712.66
10/08/2013-87571-590352.66
10/15/2013-99788-122172.75
10/22/2013-142550-427622.54


*COT Report: The weekly commitment of traders report summarizes the total trader positions for open contracts in the futures trading markets. The CFTC categorizes trader positions according to commercial hedgers (traders who use futures contracts for hedging as part of the business), non-commercials (large traders who speculate to realize trading profits) and nonreportable traders (usually small traders/speculators). Find CFTC criteria here: (http://www.cftc.gov/MarketReports/CommitmentsofTraders/ExplanatoryNotes/index.htm).


Article by CountingPips.comForex Trading News & Analysis