VIDEO: Sebelius Faces New Round Of Capitol Hill Questions — This Time From A Senate Panel

Health and Human Services Secretary Kathleen Sebelius will face a new round of questioning as she appears before the Senate Finance Committee to face growing concern and criticism about the healthcare.gov and about recent news surrounding health plan cancellations. Sebelius will appear for the first time since last April when Chairman Max Baucus memorably told her he worried about a “train wreck” if implementation of the health law did not get better.

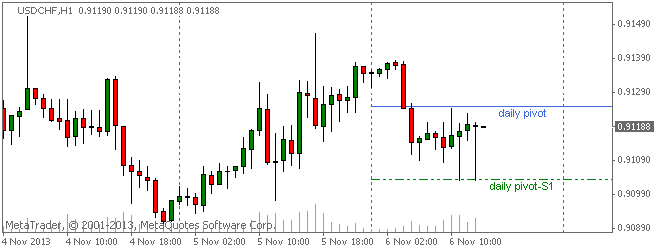
USDCHF Forex Trading Pivot Point Levels & Trends for 2013.11.06

2013.11.06 14:00 7:00AM ET | USDCHF Currency Pair

Here are the current Pivot Points Levels with Support (S) and Resistance (R) for the USDCHF currency pair. Price action is currently trading under the daily pivot point at the 0.91188 price level, according to data at 7:00 AM ET. The pair opened the Asian trading session earlier today above the daily pivot and has traded lower with support being found at the S1 support level twice.

SC USDCHF 2013.11.06

Daily Pivot Point: 0.91249
— S1 – 0.91033
— S2 – 0.90720
— S3 – 0.90504
— R1 – 0.91562
— R2 – 0.91778
— R3 – 0.92091


Weekly Pivot Points: USDCHF

Prices are currently trading over the weekly pivot point at time of writing. The USDCHF has been on a sideways path this week after opening the trading week above the weekly pivot.

SC USDCHF 2013.11.06

Weekly Pivot Point: 0.90591
— S1 – 0.89814
— S2 – 0.88424
— S3 – 0.87647
— R1 – 0.91981
— R2 – 0.92758
— R3 – 0.94148

USDCHF Trends & Fibonacci Retracement Levels

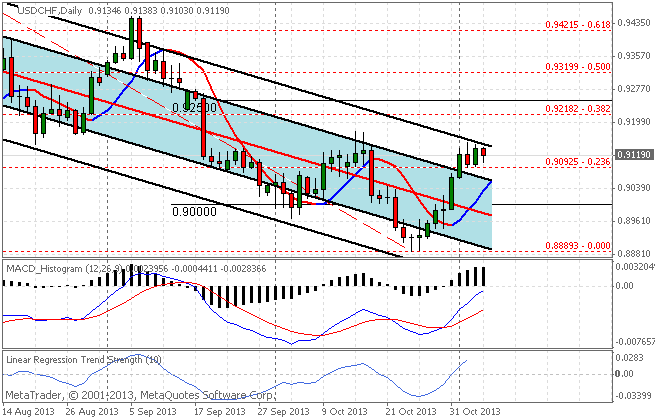
The USDCHF currency pair has been on the decline in forex market trading today with the USDCHF registering a high of 0.91383 and a low of 0.91030 over the past day. Trends data shows the pair is currently in a short-term uptrend (topping?)  as prices are trading over our favored short-term moving average. Over the longer term trend, as seen on the chart by the 90 day Linear Regression Channel, the pair continues to be in an downtrend.

SC USDCHF 2013.11.06


USDCHF Trends Data: Linear Regression Indicator

10-day current trend is BULLISH / Trend strength of 276.1 pips
30-day current trend is BEARISH / Trend strength of -29.1 pips
60-day current trend is BEARISH / Trend strength of -343.0 pips
90-day current trend is BEARISH / Trend strength of -510.3 pips
180-day current trend is BEARISH / Trend strength of -438.6 pips

Fibonacci Retracement Levels & Targets

— 0.000 – 0.88893
— 0.236 – 0.90925
— 0.382 – 0.92182
— 0.500 – 0.93199
— 0.618 – 0.94215
— 0.764 – 0.95472
— 1.000 – 0.97504


By CountingPips.comForex Trading Apps & Currency Trade Tools


Disclaimer: Foreign Currency trading and trading on margin carries a high level of risk and volatility and can result in loss of part or all of your investment. All information and opinions contained do not constitute investment advice and accuracy of prices, charts, calculations cannot be guaranteed.


GBPUSD Forex Trading Pivot Point Levels & Trends for 2013.11.06

2013.11.06 14:00 7:00AM ET | GBPUSD Currency Pair

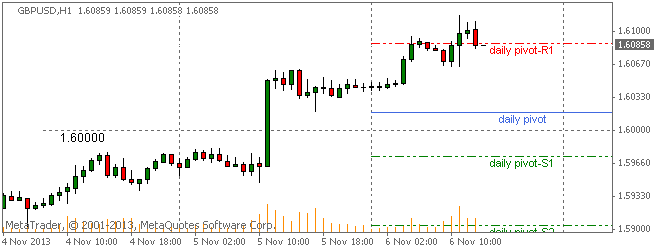
Here are the current Pivot Points Levels with Support (S) and Resistance (R) for the GBPUSD currency pair. Price action is currently trading over the daily pivot point at the 1.60858 price level, according to data at 7:00 AM ET. The pair opened the Asian trading session earlier today above the daily pivot and has continued higher over the course of the day to trading right at the R1 resistance level.

SC GBPUSD 2013.11.06

Daily Pivot Point: 1.60176
— S1 – 1.59734
— S2 – 1.59033
— S3 – 1.58591
— R1 – 1.60877
— R2 – 1.61319
— R3 – 1.62020


Weekly Pivot Points: GBPUSD

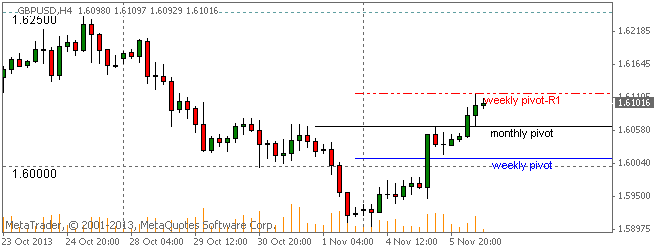
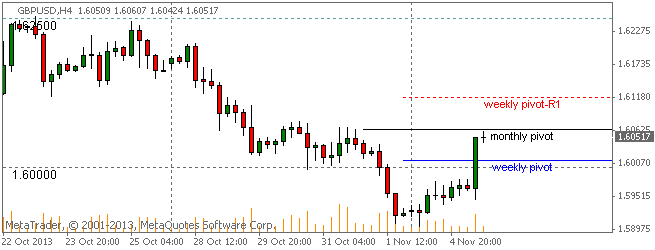
Prices are currently trading over the weekly pivot point at time of writing. The GBPUSD has been on a bullish path so far this week after opening the trading week below the weekly and monthly pivots.

SC GBPUSD 2013.11.06

Weekly Pivot Point: 1.60129
— S1 – 1.58184
— S2 – 1.57132
— S3 – 1.55187
— R1 – 1.61181
— R2 – 1.63126
— R3 – 1.64178


GBPUSD Trends & Fibonacci Retracement Levels

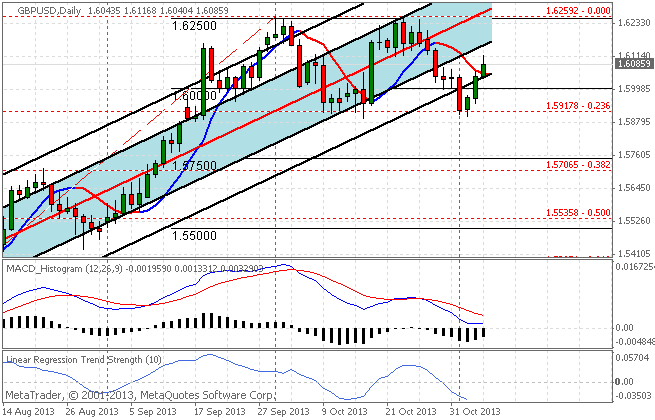
The GBPUSD currency pair has been gaining in forex market trading today for a 3rd day with the GBPUSD registering a high of 1.61168 and a low of 1.60404 on the day. Trends data shows the pair is currently in a short-term uptrend as prices are trading over our favored short-term moving average (negated by a close under the average). Over the longer term trend, as seen on the chart by the 90 day Linear Regression Channel, the pair continues to be in an uptrend. Prices dropped from the outer part of the channel late last week to the .236 fibo level and have since regrouped back to trend.

SC GBPUSD 2013.11.06


GBPUSD Trends Data: Linear Regression Indicator

10-day current trend is BEARISH / Trend strength of -202.6 pips
30-day current trend is BEARISH / Trend strength of -53.3 pips
60-day current trend is BULLISH / Trend strength of 664.6 pips
90-day current trend is BULLISH / Trend strength of 1216.6 pips
180-day current trend is BULLISH / Trend strength of 1004.8 pips

Fibonacci Retracement Levels & Targets

— 0.000 – 1.62592
— 0.236 – 1.59178
— 0.382 – 1.57065
— 0.500 – 1.55358
— 0.618 – 1.53651
— 0.764 – 1.51538
— 1.000 – 1.48124


By CountingPips.comForex Trading Apps & Currency Trade Tools


Disclaimer: Foreign Currency trading and trading on margin carries a high level of risk and volatility and can result in loss of part or all of your investment. All information and opinions contained do not constitute investment advice and accuracy of prices, charts, calculations cannot be guaranteed.


EURUSD Forex Trading Pivot Point Levels & Trends for 2013.11.06

2013.11.06 14:00 7:00AM ET | EURUSD Currency Pair

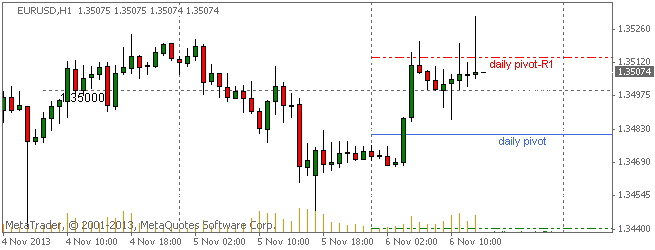
Here are the current Pivot Points Levels with Support (S) and Resistance (R) for the EURUSD currency pair. Price action is currently trading over the daily pivot point at the 1.35074 price level, according to data at 7:00 AM ET. The pair opened the Asian trading session earlier today below the daily pivot and has trended higher over the course of the day and finding resistance at the R1 level.

forex euro EURUSD 2013.11.06

Daily Pivot Point: 1.34811
— S1 – 1.34406
— S2 – 1.34077
— S3 – 1.33672
— R1 – 1.35140
— R2 – 1.35545
— R3 – 1.35874


Weekly Pivot Points: EURUSD

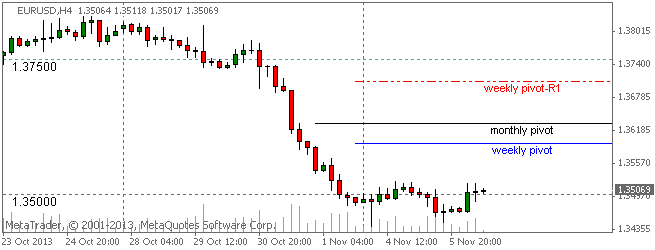
Prices are currently trading under the weekly pivot point at time of writing. The EURUSD has been trading sideways this week after opening the trading week below the weekly pivot.

SC EURUSD 2013.11.06

Weekly Pivot Point: 1.35941
— S1 – 1.33711
— S2 – 1.32565
— S3 – 1.30335
— R1 – 1.37087
— R2 – 1.39317
— R3 – 1.40463


Monthly Pivot Point: 1.36305
— S1 – 1.34295
— S2 – 1.32711
— S3 – 1.30701
— R1 – 1.37889
— R2 – 1.39899
— R3 – 1.41483


EURUSD Trends & Fibonacci Retracement Levels

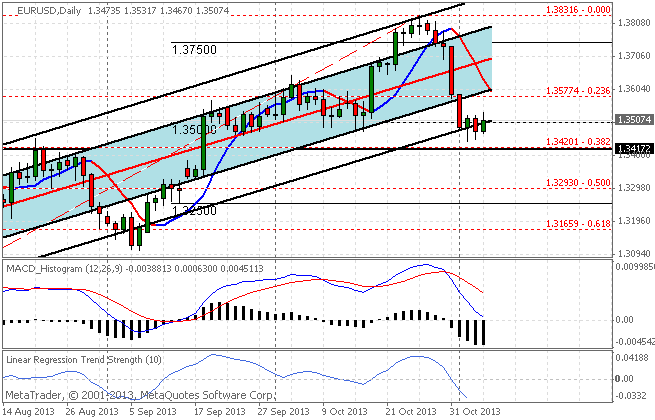
The EURUSD currency pair has been rising in forex market trading today with the EURUSD registering a high of 1.35317 and a low of 1.34670 on the day. Trends data shows the pair is currently in a short-term downtrend as prices are trading under our favored short-term moving average. Over the longer term trend, as seen on the chart by the 90 day Linear Regression Channel, the pair continues to be in an uptrend although prices have deviated to the outer channel at the moment.

SC EURUSD 2013.11.06


EURUSD Trends Data: Linear Regression Indicator

10-day current trend is BEARISH / Trend strength of -427.0 pips
30-day current trend is BULLISH / Trend strength of 128.5 pips
60-day current trend is BULLISH / Trend strength of 476.1 pips
90-day current trend is BULLISH / Trend strength of 676.8 pips
180-day current trend is BULLISH / Trend strength of 713.7 pips

Fibonacci Retracement Levels over last 100 Days

— 0.000 – 1.38316
— 0.236 – 1.35774
— 0.382 – 1.34201
— 0.500 – 1.32930
— 0.618 – 1.31659
— 0.764 – 1.30086
— 1.000 – 1.27544


By CountingPips.comForex Trading Apps & Currency Trade Tools


Disclaimer: Foreign Currency trading and trading on margin carries a high level of risk and volatility and can result in loss of part or all of your investment. All information and opinions contained do not constitute investment advice and accuracy of prices, charts, calculations cannot be guaranteed.


USDJPY Forex Pivot Point Levels & Trends for 2013.11.06

2013.11.06 14:00 7:00AM ET | USDJPY Currency Pair

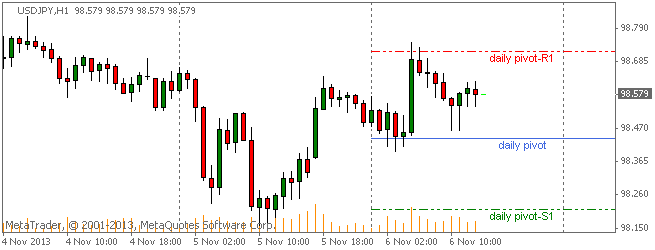
Here are the current Pivot Points Levels with Support (S) and Resistance (R) for the USDJPY currency pair. Price action is currently trading above the daily pivot point at the 98.579 price level, according to data at 7:00 AM ET. The pair opened the Asian trading session earlier today over than the daily pivot and has trended higher today after bouncing off the pivot in early trading.
forex USDJPY 2013.11.06

Daily Pivot Point: 98.439
— S1 – 98.211
— S2 – 97.933
— S3 – 97.705
— R1 – 98.717
— R2 – 98.945
— R3 – 99.223


Weekly Pivot Points: USDJPY

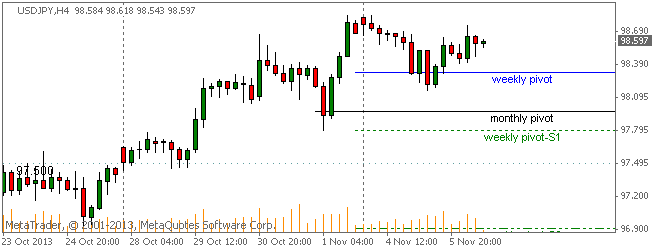
Prices are currently trading over the weekly pivot point at time of writing. The USDJPY is regaining some strength after having been on a bearish pace this week after opening the trading week above the weekly and monthly pivots.
forex USDJPY 2013.11.06

Weekly Pivot Point: 98.317
— S1 – 97.795
— S2 – 96.914
— S3 – 96.392
— R1 – 99.198
— R2 – 99.720
— R3 – 100.601


Monthly Pivot Point: 97.973
— S1 – 96.949
— S2 – 95.545
— S3 – 94.521
— R1 – 99.377
— R2 – 100.401
— R3 – 101.805


USDJPY Trends & Fibonacci Retracement Levels

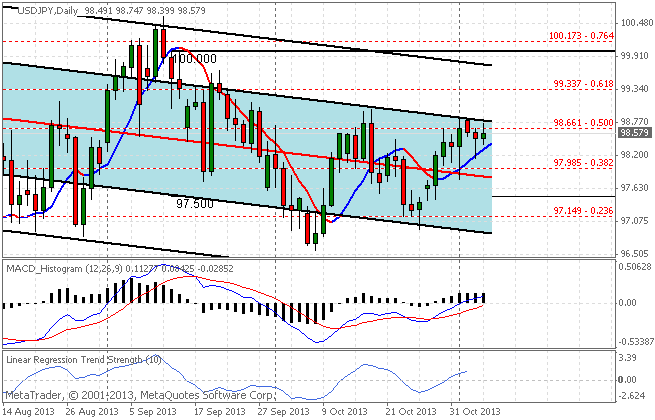
The USDJPY currency pair has been rising in forex market trading today with the USDJPY registering a high of 98.747 and a low of 98.399 on the day. Trends data shows the pair is currently in a short-term uptrend as prices are trading over our favored short-term moving average. Over the longer term trend, as seen on the chart by the 90-day Linear Regression Channels indicator, the pair continues to be in an downtrend.
SC USDJPY 2013.11.06


USDJPY Trends Data: Linear Regression Indicator

10-day current trend is BULLISH / Trend strength of 166.6 pips
30-day current trend is BULLISH / Trend strength of 45.0 pips
60-day current trend is BEARISH / Trend strength of -48.4 pips
90-day current trend is BEARISH / Trend strength of -149.2 pips
180-day current trend is BULLISH / Trend strength of 215.4 pips

Fibonacci Retracement Levels over last 100 Days

— 0.000 – 101.524
— 0.236 – 99.943
— 0.382 – 98.964
— 0.500 – 98.173
— 0.618 – 97.383
— 0.764 – 96.404
— 1.000 – 94.823

By CountingPips.comForex Trading Apps & Currency Trade Tools


Disclaimer: Foreign Currency trading and trading on margin carries a high level of risk and volatility and can result in loss of part or all of your investment. All information and opinions contained do not constitute investment advice and accuracy of prices, charts, calculations cannot be guaranteed.

VIDEO: Senate Reviews Health Care Rollout Woes

Appearing before a Senate committee Tuesday, Marilyn Tavenner, head of the Centers for Medicare and Medicaid Services, says the government’s health care web site has improved since its widely panned launch a month ago, and is still improving. (Nov. 5)

GBPUSD Forex Trading Pivot Point Levels for 2013.11.05

2013.11.05 13:00 6:00AM ET | GBPUSD Currency Pair

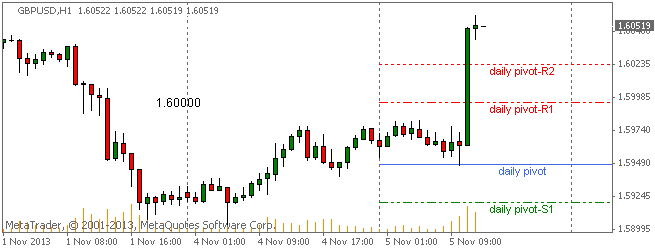
Here are the current Pivot Points Levels with Support (S) and Resistance (R) for the GBPUSD currency pair. Price action is currently trading above the daily pivot point at the 1.60519 price level, according to data at 6:00 AM ET. The pair opened the Asian trading session earlier today higher than the daily pivot and has spiked higher over the pivot, R1 and the R2 resistance level in early morning trading today.

SC GBPUSD 2013.11.05

Daily Pivot Point: 1.59488
— S1 – 1.59205
— S2 – 1.58741
— S3 – 1.58458
— R1 – 1.59952
— R2 – 1.60235
— R3 – 1.60699


Weekly Pivot Points: GBPUSD

Prices are currently trading over the weekly pivot point at time of writing. The GBPUSD has been on a bullish path early this week after opening the trading week below the weekly and monthly pivots.

SC GBPUSD 2013.11.05

Weekly Pivot Point: 1.60129
— S1 – 1.58184
— S2 – 1.57132
— S3 – 1.55187
— R1 – 1.61181
— R2 – 1.63126
— R3 – 1.64178


Monthly Pivot Point: 1.60640
— S1 – 1.58688
— S2 – 1.56977
— S3 – 1.55025
— R1 – 1.62351
— R2 – 1.64303
— R3 – 1.66014


By CountingPips.comForex Trading Apps & Currency Trade Tools


Disclaimer: Foreign Currency trading and trading on margin carries a high level of risk and volatility and can result in loss of part or all of your investment. All information and opinions contained do not constitute investment advice and accuracy of prices, charts, calculations cannot be guaranteed.