US Jobs Report declines less than expected in August. Stocks on rise. Dollar falls in Forex trading.

By CountingPips.com

U.S. Nonfarm Payrolls data released today showed that jobs declined by less than expected in August as the private-sector added jobs and government hiring continued to decline. The Department of Labor nonfarm payrolls report showed that U.S. payrolls lost 54,000 jobs in August and the unemployment rate rose by 0.1 percent to 9.6 percent. August was the third straight month that the nonfarm payroll report has declined although private companies have continued to add workers for eight straight months. According to the report, private payrolls have added 763,000 workers since December of 2009.

July’s employment data was revised downwards to a loss of 54,000 jobs after originally showing a decline of 131,000 and follows a revised decline of 175,000 jobs lost in June.

The August report came in better than the market forecasts that were expecting a loss of approximately 105,000 jobs and matched the expectations that the unemployment rate would reach 9.6 percent.

The decline in jobs was led by the loss of 114,000 temporary census government workers in August as government hiring decreased by 121,000 jobs overall. This follows decreases in government hiring in July by 161,000 workers and in June by 236,000 workers.

The goods producing sector saw no change in employment levels for August. Manufacturing lost 27,000 jobs in August after gaining for the last two months and motor vehicles and parts dropped by 22,000 jobs. The construction sector added 19,000 jobs for the month after declining by 4,000 jobs in July.

The service-providing sector created 67,000 total jobs in August with education and health services adding 45,000 workers while professional and business services also added 20,000 jobs. Retail trade lost approximately 5,000 jobs for the month while transporting and warehousing declined by approximately 7,500 workers.

U.S. Dollar mostly weaker today in Forex Trading. Stocks advance.

The U.S. dollar has been mostly weaker in forex trading today against the other major currencies following the employment report. The euro, British pound, New Zealand dollar, Australian dollar and Canadian dollar have all gained ground versus the American currency today while the Swiss franc and Japanese yen have been trading lower.

The US stock markets, meanwhile, have been trading higher today with the Dow Jones industrial average increasing by over 60 points, the NASDAQ up by over 15 points and the S&P 500 higher by over 7 points at time of writing.

Oil has declined by $1.32 to the $73.70 level while gold has fallen by $10.70 dollars to trade at the $1240.80 level.

Do You Understand How Derivatives Work?

By David Adams – I have been a derivatives trader for the majority of my working career. I’ve noticed during that time that the word “derivatives” has garnered some very negative connotations. The fact of the matter is that the term derivative has a variety of meanings and can indicate a wide range of financial instruments. Let’s start out with a basic definition of a derivative.

A derivative is a financial instrument like an option and or futures contract whose value is derived partly from the value of another security, which is the underlying security. I don’t suppose that technical definition shared a tremendous amount of light on the actual meaning of the derivatives. In layman’s terms, a derivative is a bet as to whether the value of the underlying security, which might be a stock, bond, or financial index, will increase or decrease by a specified date. Derivatives are typically used to protect asset prices and things like inventories or potential future purchases. In reality, derivatives are a generic term for a wide class of financial products. Some of these products, like futures contracts and options, are well-defined and enjoy a relatively widespread understanding.

On the other hand, there are classes of derivatives which exist in a murky and poorly understood environment. These derivatives are usually not traded publicly, but are individual contracts between firms to buy and sell products, or insure against loss (as is the case in credit default swaps) or give a firm the right to buy a product in the future a set price. These non-traded derivatives can be classified as exotic in nature. By exotic, I mean they are each unique to a finite situation that exists between two parties. As you have probably heard on the news, many of these exotic derivatives are poorly understood by both the public and the government. Further, there have been questions raised as to the legality of these derivatives. As an aside, the new financial regulation packages proposed by the government include extensive scrutiny and regulation of exotic derivatives.

But getting back to my job, I work only with the “plain Jane” variety of derivatives called futures contracts. Futures contracts are traded on regulated exchanges and there is a high degree of transparency in their daily trading activity. Futures contracts have been around for more than a century, and early derivatives date back to Rice trading in Japan in the 1600s. So the garden-variety derivative, or futures contract, is well understood and heavily traded.

You might be surprised at the wide range of commodities, metals, financial indexes, and a host of other unusual futures contracts that can be traded. For example, there are futures contracts on energy products, bond prices, meats and a host of other contracts. Generally these contracts are used to lock-in prices for producers of the products listed above, or the investors of the products listed above. Futures allow a producer to lock-in a price so a firm can produce and price their product with the future in mind.

It’s important to understand that well-regulated futures provide a valuable service to industry. On the other hand, exotic derivatives have, at times, resulted in extraordinary losses and the most recent derivative problem caused our country to fall into a recession. The purpose of this article is to differentiate between normal, transparent derivatives contracts and the exotic derivatives contracts that have caused so much trouble for our economy.

About the Author

Would it be convenient to recieve valuable trading tips every night in your email? You can sign up for our free video series by Clicking here These videos contain advanced trading strategies and will enhance your trading knowledge immeasurably. Best of all, they are free!

EUR/USD and the Double Crossover Method Trending System

By Russell Glaser – The Euro is coming back versus the dollar with the EUR/USD ending a period of range trading. Bearish bets on the euro have eased, and this is apparent in the latest technical buy signal, the golden cross.

One of the easiest and most common trending systems to use is the Double Crossover Method. This simple system uses two moving averages. The most-used combinations are the 5 and 20 days, along with the 10 and 50 days. Some traders also prefer to use a different moving average. Some prefer the exponential moving average or the weighted moving average.

For the EUR/USD daily chart below, we will be using the 5 and 20 day simple moving averages.

A buy signal is given when the faster, 5 day moving average (green) line crosses above the slower, 20 day moving average line (red).

A sell signal is given when the faster, 5 day moving average line (green) crosses above the slower, 20 day moving average line (red).

Since the last signal (sell) in mid-August, the system underperformed with a loss close to 100 pips. The system works the best when the markets are in a trending phase. For traders who use the double crossover system, the last two weeks have been a range trading environment which is not preferred. The previous buy signal that was triggered in early June was much more profitable, netting somewhere around 640 pips.

Certainly other parameters must factor into the equation before a trader takes a position in the market. As the markets may only be in a trending phase 50% of the time, with the other half of the time spent in a range trading period, traders need to identify where the long term trend is and if indeed the market is showing signs of a trending environment.

One tool for identifying the trend is the ADX indicator. This discussion won’t dive into the specifics of the ADX indicator, but it is used to identify a trending environment versus a range trading environment.

Looking to the far right edge of the chart below, traders can see the 5 day moving average line should cross above the 20 day moving average line by the end of today’s trading. Once a cross is made, this is a signal for those traders who use the double cross over method to close out short positions and go long on the EUR/USD.

Forex Market Analysis provided by ForexYard.

© 2006 by FxYard Ltd

Disclaimer: Trading Foreign Exchange carries a high level of risk and may not be suitable for all investors. There is a possibility that you could sustain a loss of all of your investment and therefore you should not invest money that you cannot afford to lose. You should be aware of all the risks associated with Foreign Exchange trading.

U.S. Dollar Under Pressure Prior to Payrolls Report

Source: ForexYard

The euro and high-yielding currencies held firm on Friday after an improvement in U.S. housing and jobless claims data bolstered investor appetite for risk ahead of key U.S. jobs data today at 12:30 GMT.

Economic News

USD – Dollar Slips against the Euro and the Yen

The U.S currency was on the defensive Thursday, retaining most of the losses sustained the previous day when upbeat data helped lure investors away from safe-haven currencies and assets.

Figures released yesterday showed U.S. pending home sales rose unexpectedly in July and new claims for unemployment insurance fell for a second straight week, which, together with upbeat manufacturing data on Wednesday, eased the gloom over the U.S economy. That lifted stocks, commodities and higher-yielding currencies. However, investors hesitated to take fresh positions ahead of Friday’s monthly U.S. jobs report, analyst said.

EUR – EUR Gains for a 2nd Week Before Retail Sales Report

The euro headed for a 2nd consecutive weekly gain versus the U.S dollar before a European report that economists said will show retail sales rose for a 3rd month, spurring demand for the region’s assets. Retail sales in the euro area increased 0.2% in July, matching the previous month’s gain, according to economists’ estimations before today’s report.

Against the British pound the 16-nation currency traded near a 3-week high on speculation European Central Bank President Jean-Claude Trichet will tomorrow reiterate his comments that the region’s recovery is on track.

Market players said that given the fact that the euro zone economy has surprised to the upside, led by a robust recovery in Germany as this higher growth path is priced into the markets, the euro will likely gain further. The next target for the euro is around $1.287, the 38.2% Fibonacci retracement of its fall from its August peak of $1.3334 to its August low of $1.2588. And the target after that would be $1.2923.

JPY – Yen Trades Near 15-year High

The Japanese yen rose yesterday, extending its gains vs. the dollar after U.S. reports showed an unexpected increase in pending home sales, a decline in initial jobless claims and improved retail sales. The pullback in the dollar came even after a Japanese political candidate reiterated his call for direct currency-market intervention to stem the recently strong yen. Japan’s currency stood at 84.35 yen per dollar, up slightly on the day but not far from the 15-year low of 83.58 yen hit late last month.

A sharp drop in dollar/yen, such as 1 to 2% or more in a single day towards the 80 yen level and below, is seen as the most likely scenario that would prompt Japan to intervene and start to buy dollars. Thus many traders expect the market to test the willingness of Japan to intervene, especially if U.S. payrolls data comes in weaker than expected.

OIL – Crude Oil Declines on Forecast for U.S. Jobless Increase

Oil prices declined, headed for a weekly drop, amid forecasts that a U.S. government report will probably show the jobless rate rose in August for the first time in 4 months, signaling a recovery in fuel demand may falter.

Crude gave up some of yesterday’s 1.5 % gain as analysts estimated the August payrolls report from the Labor Department may show the U.S. economy lost 101,000 jobs. Oil prices rose yesterday after an explosion on a platform owned by Mariner Energy Inc. prompted speculation that tighter regulations will cut production.

Technical News

EUR/USD

A symmetrical triangle pattern has formed on the daily chart with the two of the three vertices beginning on August 18th and August 23rd. The chart pattern is characterized by the slope of the price highs and lows that are converging to form the outline of a symmetrical triangle. Technical indicators help to verify the consolidation pattern. The 20-day exponential moving average has flattened out; combined with a tightening of the Bollinger Bands and a lower Average True Range (14) indicate a decrease in volatility. Traders should wait for a breach of the triangle and target the short term resistance at the August high of 1.2930. A stop should be placed inside the triangle to protect against a false breakout.
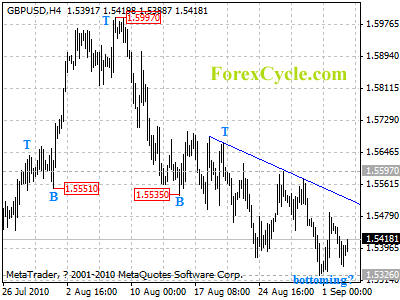
GBP/USD

The pair has found support in the recent downtrend at the 100-day exponential moving average. A breach below the line could take the pair to the support at 1.5125. Resistance is found at the downward sloping trend line at 1.5470.

USD/JPY

Despite the slowdown in the depreciation of the pair, the downward trend continues. Support is found at the swing low on the daily chart at 83.60, with a long term target the all-time low for the pair at 79.70. Resistance is located at Monday’s high of 85.90.

USD/CHF

Downward pressure continues for the pair as the bearish trend shows signs of strengthening. Long term moving averages such as the 50, 100, and 200 day are downward sloping, indicating the trend is to the downside. Traders should be short with the first support at Wednesday’s low of 1.0065, followed by 1.0030.

The Wild Card

Gold

Gold prices continue their uptick, targeting the commodity’s all-time high at $1,265. The price looks to move higher with the 20-day exponential moving average sloping higher. CFD CFD traders should be long on gold with a protective stop below the support level at $1,231.

Forex Market Analysis provided by ForexYard.

© 2006 by FxYard Ltd

Disclaimer: Trading Foreign Exchange carries a high level of risk and may not be suitable for all investors. There is a possibility that you could sustain a loss of all of your investment and therefore you should not invest money that you cannot afford to lose. You should be aware of all the risks associated with Foreign Exchange trading.

Forex Daily Market Review Sep 3, 2010

By eToro – The Euro held steady as European Central Bank President, Jean-Claude Trichet, said a double dip was not in the cards, leading to speculation about the withdrawal of monetary stimulus. The ECB also increased growth forecasts for 2010 to 1.6%.

Click here to read the full daily Review

Forex Market Analysis provided by eToro

Disclaimer: Trading in the Foreign Exchange market might carry potential rewards, but also potential risks. You must be aware of the risks and are willing to accept them in order to trade in the foreign exchange market. Don’t trade with money you can’t afford to lose.

GBPUSD stays below a falling trend line

GBPUSD stays below a falling trend line on 4-hour chart and remains in downtrend from 1.5997. As long as the trend line resistance (Now at 1.5525) holds, another fall to 1.5200 is still possible. On the upside, the pair may be forming a cycle bottom at 1.5326, key resistance is at 1.5597, a break above this level will confirm the cycle bottom and indicate that the fall from 1.5997 has completed at 1.5326 already, then the following upward movement could bring price back to 1.5700-1.5800 area.

gbpusd

Daily Forex Signals

Harvest More Pips Today With MT4 Trailing Stop

By Warren Seah

Have you faced the following situations:

1) Feeling under pressure to let go of the trade when you are high on profits? 2) Do not know the ‘perfect time’ to exit your trade? 3) Hanging onto losing trade in hope that it might turn back in your favour? 4) Do not know that there is actually a trailing stop function on MT4 platform?

Well, if you have encounter of these situations, you are not alone. Many thousands of traders at some point do go through these situations even the seasoned traders. There is nothing to be ashamed of as the only shame about this is not finding a solution to your problem.

There a number of traders whom I’ve encounter do not know the existence of a trailing stop function on MT4 platform. Well I can tell you that it is a great tool to have if you want to trail your profits while keeping your stops tight.

But the downside is that you have to specify how many pips you want to trail at a time. Why is this not so good is that you do not know when the market trend might fade and that market condition is changing continuously, you might end up exiting the market prematurely.

The best way is to let the market decide when to move your stops and when to exit. Be reminded that I emphasize only on trending situations here. Trailing stops work well in such situation and save you the time of having to constantly monitor the market.

On the MT4 platform, the trailing stop function is insufficient to allow me to trail the market in the way I want it to be and that the trailing function might have its own hiccups during operations.

Therefore I have work together with a team of traders and bring up this idea of incorporating different exit strategies to allow me to pick and choose which are better to suit my trade for now.

As MT4 has its own programming language, I made use of the Expert Advisor to create an exit strategy EA suitable for manual traders who want to take control their trade and want automation for their trade exits without the need to constantly monitor.

With the development of 11 exit strategies:

1) Partial close 2) Break even stop 3) Time stop 4) MA trailing stop 5) ATR trailing stop 6) Parabolic SAR trailing stop 7) 2 Bar Low 2 Bar High 8) Equity stop 9) Channel Stop 10) N pips stop 11) BB trailing stop

The combination and customization of these exit strategies allows me to decide which strategies are suitable for my current trades and most importantly, I allow the market to track the trend and trail stops for me instead of me having to babysit my trade. Therefore, freeing more time and harvesting more profits.

About the Author

By Warren Seah

“Introducing 11 Exit Strategies, What Every Disciplined Traders Need … Go Without It You Could End Up Being A PIP VICTIM Just Like Thousands Of Traders Out There.”

Download Your Exit Strategy EA Now

Some Examples Of How You Can Trade Forex Breakouts

By James Woolley – Trading breakouts is undoubtedly one of the most effective ways of trading the currency markets. It works because the masses will often act upon these breakouts, and therefore as a result each breakout will often move even further in the required direction. So how you can successfully trade these breakouts yourself?

Well you can start by just looking at price patterns of the major currency pairs. Although they will often fluctuate all over the place, at some point the price will enter a quiet spell and start trading in a very narrow range. This is the time to pay attention because you want to jump on board as soon as there is a meaningful breakout. You will generally find that the longer the price is confined in a tight trading range, the more reliable the breakout will be.

If you find that you are comfortable just trading the price, you could use one or two technical indicators to help you identify these potential breakout situations. The first one I want to discuss is the Bollinger Band indicator.

The best way to use Bollinger Bands is to wait until the two outer lines become very narrow because this tells you that the price is currently entering a quiet period, and is therefore likely to break upwards or downwards in the near future. When the price moves through either the upper or lower line, you can then think about trading in the same direction as this breakout. Not all of these set-ups will be profitable so it pays to only trade the very best set-ups.

In which case you may choose to use a few other indicators. One of the most effective you can use is the exponential moving average, or EMA for short. For the purposes of finding possible breakouts, I can recommend that you use several of these EMAs including the 5, 20, 50 and 200 period EMAs.

The next step is to wait until all of these EMAs are trading very close together because this tells you that it is almost inevitable that the price is going to move strongly upwards or downwards in the near future. When they start moving in one direction you can then jump on board, particularly if this corresponds to a breach of the corresponding Bollinger Band line.

Anyway the point I want to make is that there are lots of ways you can trade forex breakouts. As long as you have some way of both identifying range-bound markets and trading the subsequent breakout, then there is no reason why you can’t generate decent profits from this style of trading.

About the Author

James Woolley runs a website which provides details of many of the best-selling forex products including USDBOT and Forex Nitty Gritty.

Forex News: CHF Higher on Surprising GDP Figures

The Swiss franc (CHF) received an increase in strength today, as Swiss GDP figures came in better than expected over the last quarter. The USD/CHF erased almost all of its bullish tendencies which it had held in earlier trading, and dropped more than 60 pips following this morning’s announcement, reaching a solid support level at 1.0110.

The Japanese yen also edged higher vs. the greenback. On the other side, the Australian dollar led declines, down 0.5% vs. the greenback as confidence about growth prospects was dented by faltering July export numbers.

The USD/JPY dropped as low as 84.08, while the EUR/JPY traded at 107.50-80 for most of the Asian session. Likewise, the EUR/CHF dropped to as low as 1.2955 as the Swiss GDP climbed more than expected in the second quarter.

Forex Market Analysis provided by ForexYard.

© 2006 by FxYard Ltd

Disclaimer: Trading Foreign Exchange carries a high level of risk and may not be suitable for all investors. There is a possibility that you could sustain a loss of all of your investment and therefore you should not invest money that you cannot afford to lose. You should be aware of all the risks associated with Foreign Exchange trading.

Forex Daily Market Commentary

By GCI Forex Research

Fundamental Outlook at 1400 GMT (EDT + 0400)

USD

Risk sentiment continues to find support as figures out of the US yesterday suggested some of the recent economic fears could prove overblown, especially ahead of Friday’s crucial payrolls report. Manufacturing ISM was above consensus estimates at 56.3, which is consistent with an above-5% growth trend in manufacturing output. Regional manufacturing data had been mixed as of late so the positive ISM print was a pleasant surprise. The ADP estimate of private payrolls disappointed at -10k but our economists note ADP has been running lower than the official Bureau of Labor Statistics payroll estimates. That said, our team maintains the +75k forecast on private payrolls as the stronger ISM employment index partially offsets the weak, but perhaps unreliable, ADP. Philadelphia Fed President Plosser said he would support further QE only if real deflation risks arise, which he does not see currently. He also said the Fed should not ease to solve the unemployment problem and Dallas Fed President Fisher echoed this when he said more monetary easing would be akin to “pushing on a string.” Fisher said the ball is in the fiscal, regulatory policy court but declined to say whether more fiscal stimulus is needed at this juncture. Neither official spoke of a potential double dip ahead. Fed vice-Chairman Donald Kohn, on his last day in office, also noted that the decision to reinvest maturing securities is not an automatic precursor to further easing and maintained the need to watch data. Ahead today, Jobless claims data are due and Fed Chariman Bernanke will testify before the Financial Crisis Inquiry Commission. EURUSD traded 1.2785-1.2814 and USDJPY 84.08-84.56.


EUR

Our team does not expect the ECB decision to yield any surprises and would highlight a couple of points to watch for during ECB President Trichet’s press conference. ECB Governing Council member Weber already discussed the possibility of extending the full allotment refinancing operations. Since bank recapitalization remains an issue, We could see a more formal decision on this soon. Q2 growth was strong but Trichet cautioned on the second half at his previous press conference. While the stronger Q2 figures could augur better overall 2010 figures, it may not necessarily translate to an improved outlook for 2011.
German retail sales were worse than expected at -0.3%m/m, 0.8%y/y. The manufacturing PMI was also confirmed at 58.2, in line with expectations, showing that growth remains on track in Germany, but the rest of the Eurozone may struggle to keep pace. Eurozone manufacturing PMI was also firm at 55.1, higher than the initial release. Similar PMI releases across Europe were generally firm.
CHF

Q2 GDP was stronger than expected at 0.9%q/q (cons. 0.8q/q), 3.4%y/y, supporting expectations that the SNB could move to a more hawkish track. While CPI has tracked down recently, deflationary risks are not as prevalent as they were previously and continued growth should keep further SNB intervention at bay. Retail sales figures will be out later.
AUD

The Australian trade balance was weaker than expected at A$1.88bln, our economists note that the figure is still healthy after June’s record figure. However, they warn that given the rise in AUD commodity prices and stronger AUD point to falling net volumes and exports may subtract to Q3 GDP.

TECHNICAL OUTLOOK


EURUSD BEARISH Trend is still bearish with focus on 1.2588 ahead of 1.2434 Fibonacci support. Short-term resistance is defined at 1.2933.
USDJPY BEARISH Stalled above 83.60 trend low, move below the level would expose 79.75 key support. Short-term resistance is defined at 85.91 intraday high.
GBPUSD BEARISH Sustained break of 1.5324 would favor a bearish move towards 1.5125. Near-term resistance lies at 1.5475 ahead of 1.5713.
USDCHF BEARISH Break of 1.0131 favors the extension of bearish trend towards 0.9918 ahead of 0.9786. On the upside resistance holds at 1.0265 ahead of 1.0466.
AUDUSD NEUTRAL Recovery clears 0.9080; need a break above 0.9222 to confirm a bull trend. 0.8771 marks the key support level.
USDCAD BULLISH Bullish pressure holds below 1.0680; break of the level would open 1.0853. Initial support is defined at 1.0473 ahead of 1.0248.
EURCHF BEARISH Defined a new trend low at 1.2852, a break here would leave little support till 1.2403. Near-term resistance comes in at 1.3146.
EURGBP NEUTRAL 0.8363 and 0.8068 define the key near-term directional triggers.
EURJPY BEARISH Push below 105.44 would expose 100.00 next. Near-term resistance is defined at 111.11 ahead of 114.74.

Forex Daily Market Commentary provided by GCI Financial Ltd.

GCI Financial Ltd (”GCI”) is a regulated securities and commodities trading firm, specializing in online Foreign Exchange (”Forex”) brokerage. GCI executes billions of dollars per month in foreign exchange transactions alone. In addition to Forex, GCI is a primary market maker in Contracts for Difference (”CFDs”) on shares, indices and futures, and offers one of the fastest growing online CFD trading services. GCI has over 10,000 clients worldwide, including individual traders, institutions, and money managers. GCI provides an advanced, secure, and comprehensive online trading system. Client funds are insured and held in a separate customer account. In addition, GCI Financial Ltd maintains Net Capital in excess of minimum regulatory requirements.

DISCLAIMER: GCI’s Daily Market Commentary is provided for informational purposes only. The information contained in these reports is gathered from reputable news sources and is not intended to be U.S.ed as investment advice. GCI assumes no responsibility or liability from gains or losses incurred by the information herein contained.