Copper got a lift by 0.85 percent – June 01 2018

Copper End of Day: June 01 2018

The Copper Futures (Front Month) finished the North American session today with a rise of 0.85 percent and closed the day around the 309.1 price level, according to unofficial data at the New York close. The Copper Futures opened at 306.2 with the high of the day being 309.9 and the low of the day at 305.6.

The Copper RSI level is Bullish:

The Relative Strength Index, an indicator that can indicate overbought (above 80) and oversold levels (below 20), shows that the current RSI score is at 51.5 for a Bullish reading on the daily time-frame.

Copper Trends:

The Copper Futures (Front Month) has advanced by 0.90 percent over the past 10 days while seeing a slide of -1.40 over the past 30 days. The 90-day change is -4.26 while the 180-day return and the 365-day return are 4.51 and 24.84, respectively.

By investmacro.com

USDJPY Forex Trading Pivot Point Levels for 2014.05.22

2014.05.22 12:30 6:30AM ET | USDJPY Currency Pair

SC USDJPY 2014.05.22

Here are the Pivot Points Levels with Support (S) and Resistance (R) for the USDJPY currency pair today. Price action is currently trading well over the daily pivot point at the 101.602 price level, according to data at 6:30 AM ET. The USDJPY high for the day has been 101.751 while the low of day has been reached at 101.349. The pair earlier today opened the Asian trading session above the daily pivot and has trended higher up to the R1 resistance level where selling pressure was found today.

Daily Pivot Point: 101.261
— S1 – 100.910
— S2 – 100.459
— S3 – 100.108
— R1 – 101.712
— R2 – 102.063
— R3 – 102.514


Weekly Pivot Points: USDJPY

SC USDJPY 2014.05.22

Prices are currently trading slightly under the weekly pivot point at time of writing. The USDJPY is showing an overall sideways result for the week so far with dips below 101.00 and tops around the 101.70 weekly pivot area.

Weekly Pivot Point: 101.702
— S1 – 101.048
— S2 – 100.649
— S3 – 99.995
— R1 – 102.101
— R2 – 102.755
— R3 – 103.154


By CountingPips.comForex Trading Apps & Currency Trade Tools

Disclaimer: Foreign Currency trading and trading on margin carries a high level of risk and volatility and can result in loss of part or all of your investment. All information and opinions contained do not constitute investment advice and accuracy of prices, charts, calculations cannot be guaranteed.


USDCHF Forex Trading Pivot Point Levels for 2014.05.22

2014.05.22 12:30 6:30AM ET | USDCHF Currency Pair

SC USDCHF 2014.05.22

Here are the Pivot Points Levels with Support (S) and Resistance (R) for the USDCHF currency pair today. Price action is currently trading below the daily pivot point at the 0.89266 price level, according to data at 6:30 AM ET. The USDCHF high for the day has been 0.89503 while the low of day has reached to 0.89246. The pair earlier today opened the Asian trading session slightly above the daily pivot and initially trended higher before declining to under the daily pivot .

Daily Pivot Point: 0.89306
— S1 – 0.88963
— S2 – 0.88621
— S3 – 0.88278
— R1 – 0.89648
— R2 – 0.89991
— R3 – 0.90333


Weekly Pivot Points: USDCHF

SC USDCHF 2014.05.22

Prices are currently trading over the weekly pivot point at time of writing. The USDCHF has been on an overall weak bullish trend this week after opening the trading week a bit over the weekly pivot.

Weekly Pivot Point: 0.89137
— S1 – 0.88683
— S2 – 0.88121
— S3 – 0.87667
— R1 – 0.89699
— R2 – 0.90153
— R3 – 0.90715


By CountingPips.comForex Trading Blog & Currency Trade Tools

Disclaimer: Foreign Currency trading and trading on margin carries a high level of risk and volatility and can result in loss of part or all of your investment. All information and opinions contained do not constitute investment advice and accuracy of prices, charts, calculations cannot be guaranteed.


GBPUSD Forex Trading Pivot Point Levels: Cable declines under 1.6900

2014.05.22 12:30 6:30AM ET | GBPUSD Currency Pair

SC GBPUSD 2014.05.22

Here are the Pivot Points Levels with Support (S) and Resistance (R) for the GBPUSD currency pair today. Price action is currently trading at the 1.68762 price level and under the daily pivot point, according to data at 6:30 AM ET. The GBPUSD high for the day has been 1.69162 while the low of day has reached to 1.68610. The pair earlier today opened the Asian trading session above the daily pivot and has trended steadily lower into the North American session.

Daily Pivot Point: 1.68829
— S1 – 1.68454
— S2 – 1.67928
— S3 – 1.67553
— R1 – 1.69355
— R2 – 1.69730
— R3 – 1.70256


Weekly Pivot Points: GBPUSD

SC GBPUSD 2014.05.22

Prices are currently trading over the weekly pivot point at time of writing. The GBPUSD has been on an overall bullish trend this week after opening the trading week very close at the weekly pivot while the pair has hit resistance at the R1 resistance area.

Weekly Pivot Point: 1.68158
— S1 – 1.67295
— S2 – 1.66441
— S3 – 1.65578
— R1 – 1.69012
— R2 – 1.69875
— R3 – 1.70729


By CountingPips.comForex Trading Blog & Currency Trade Tools

Disclaimer: Foreign Currency trading and trading on margin carries a high level of risk and volatility and can result in loss of part or all of your investment. All information and opinions contained do not constitute investment advice and accuracy of prices, charts, calculations cannot be guaranteed.


Currency Speculators turned bullish on US Dollar bets, Euro drops to the bearish side

By CountingPips.com

cot-values

The latest data for the weekly Commitments of Traders (COT) report, released by the Commodity Futures Trading Commission (CFTC) on Friday, showed that large traders and speculators turned around their bets to become bullish on the US dollar last week. The previous four weeks had seen speculators and traders on the bearish side.

Non-commercial large futures traders, including hedge funds and large International Monetary Market speculators, had an overall US dollar long position totaling $4.51 billion as of Tuesday May 13th, according to the latest data from the CFTC and calculations by Reuters. This was a weekly change of +$6.54 billion from the -$2.03 billion total short position that was registered on May 6th, according to Reuters that totals the US dollar contracts against the combined contracts of the euro, British pound, Japanese yen, Australian dollar, Canadian dollar and the Swiss franc.

The US dollar aggregate bullish position is the highest USD level since March 11th when total bullish contracts equaled +$10.56 billion. The bullish gain of $6.54 billion was the largest weekly increase since November 12th 2013 when positions jumped by $7.44 billion for the week.

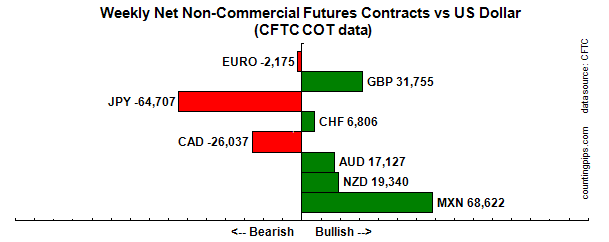
Overall for the week against the other major currencies, speculators bet in favor the Canadian dollar, Australian dollar and the Mexican peso last week while there were weekly declines for the euro, British pound sterling, Japanese yen, Swiss franc and the New Zealand dollar.


cot-standings

Notable changes:

  • Euro positions fell sharply over to the bearish side for the first time since February 2nd as the European Central Bank suggested they were open to easing monetary policy in June
  • British pound sterling positions fell for a 4th straight week after reaching a multi-year high on April 15th
  • Japanese Yen net positions added bearish positions after touching the lowest bearish level since October 15, 2013 the previous week
  • Swiss franc bullish positions declined by roughly half last week to +6,806 contracts
  • Australian dollar net positions rose to their best level since April 30th 2013 after turning bullish on April 8th
  • Canadian dollar positions, still bearish at -26,037 contracts, stood at the least bearish position since November 2013


* All currency positions are in direct relation to the US dollar where, for example, a bet for the euro is a bet that the euro will rise versus the dollar while a bet against the euro will be a bet that the dollar will gain versus the euro. Please see charts and data below.


Weekly Charts: Large Speculators Weekly Positions vs Currency Spot Price

EuroFX:

eurofx

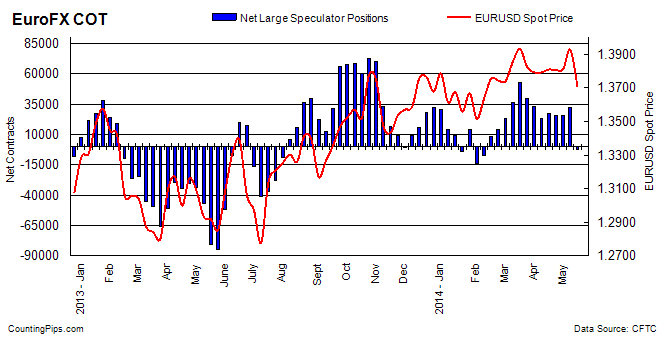
Last Six Weeks data for EuroFX futures

DateOpen InterestLong SpecsShort SpecsLarge Specs NetWeekly Change
04/08/2014261439926356933523300-9938
04/15/201427072210625278564276884388
04/22/20142662591012047543025774-1914
04/29/20142715151022857655125734-40
05/06/201427701311067378122325516817
05/13/20142681428438386558-2175-34726

British Pound Sterling:

gbp

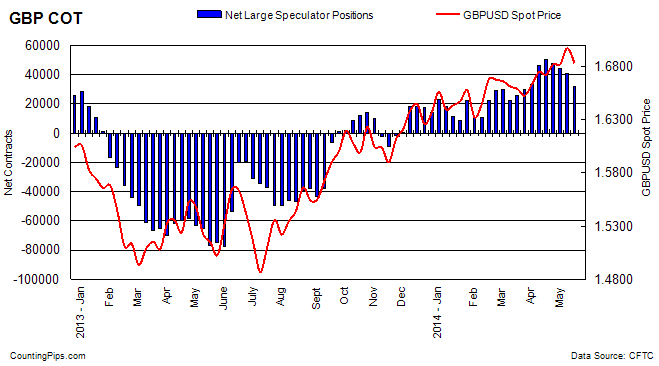
Last Six Weeks data for Pound Sterling futures

DateOpen InterestLong SpecsShort SpecsLarge Specs NetWeekly Change
04/08/201422666791642451654647712905
04/15/20142266888747236874505984121
04/22/2014237055896924189247800-2798
04/29/2014236030859134167944234-3566
05/06/2014241264837944314840646-3588
05/13/2014230333711683941331755-8891


Japanese Yen:

jpy

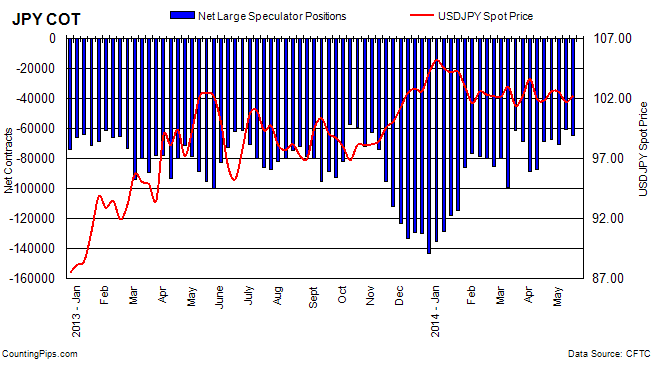
Last Six Weeks data for Yen Futures

DateOpen InterestLong SpecsShort SpecsLarge Specs NetWeekly Change
04/08/201418181413340100802-874621176
04/15/20141648431435183067-6871618746
04/22/20141656741656483807-672431473
04/29/20141688201384684198-70352-3109
05/06/20141670932038181109-607289624
05/13/20141647071747182178-64707-3979


Swiss Franc:

chf

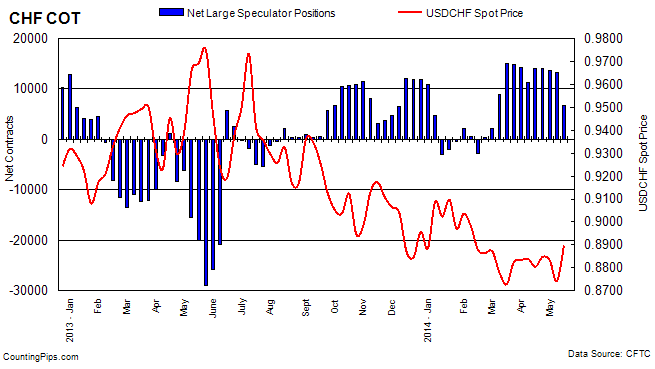
Last Six Weeks data for Franc futures

DateOpen InterestLong SpecsShort SpecsLarge Specs NetWeekly Change
04/08/20144475219275794011335-2896
04/15/201448976239059839140662731
04/22/20144688821732770914023-43
04/29/20144742421960825713703-320
05/06/201455538251021191813184-519
05/13/20144528216951101456806-6378


Canadian Dollar:

cad

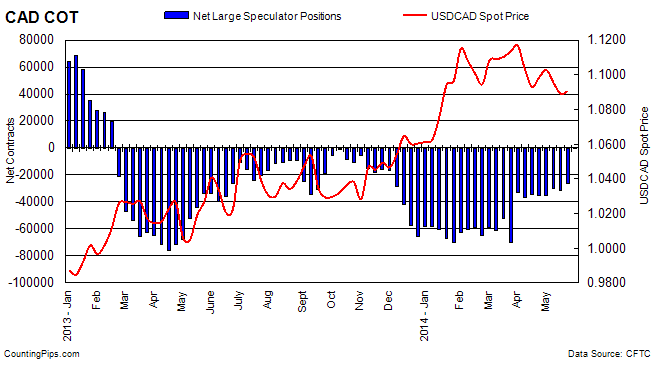
Last Six Weeks data for Canadian dollar futures

DateOpen InterestLong SpecsShort SpecsLarge Specs NetWeekly Change
04/08/20141203362870463011-343072687
04/15/20141195252828863714-35426-1119
04/22/20141187072752962984-35455-29
04/29/20141235893009360388-302955160
05/06/20141222872804459644-31600-1305
05/13/20141216322698653023-260375563


Australian Dollar:

aud

Last Six Weeks data for Australian dollar futures

DateOpen InterestLong SpecsShort SpecsLarge Specs NetWeekly Change
04/08/201496887376303432033108190
04/15/201498933404633236680974787
04/22/20141076964954033170163708273
04/29/2014109934500193931310706-5664
05/06/201410493644805361688637-2069
05/13/20141073025014733020171278490


New Zealand Dollar:

nzd

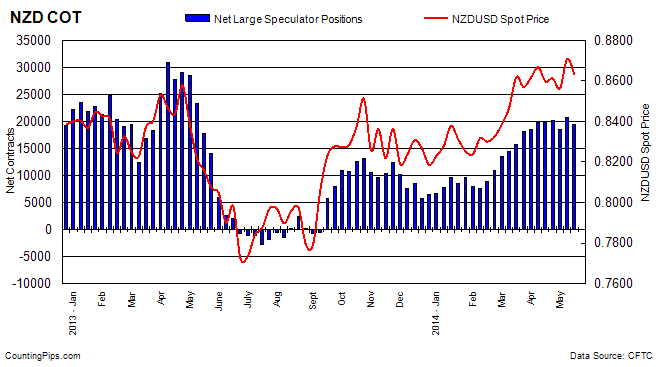
Last Six Weeks data for New Zealand dollar futures

DateOpen InterestLong SpecsShort SpecsLarge Specs NetWeekly Change
04/08/201432898265216755197661286
04/15/2014331002667168241984781
04/22/20143257926056588120175328
04/29/20142985822979449918480-1695
05/06/201433025250274334206932213
05/13/20143093223806446619340-1353


Mexican Peso:

mxn

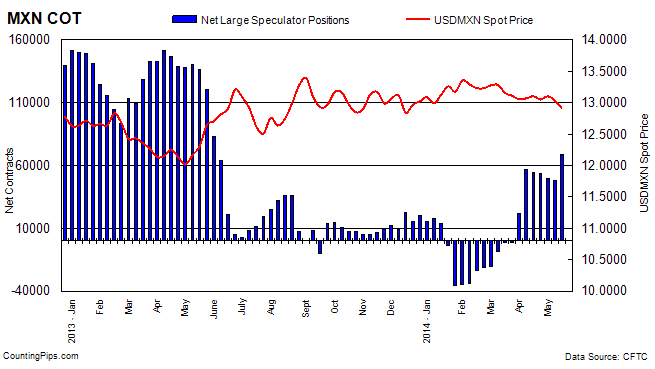
Last Six Weeks data for Mexican Peso futures

DateOpen InterestLong SpecsShort SpecsLarge Specs NetWeekly Change
04/08/201413033170371138705650134717
04/15/2014131412710381680154237-2264
04/22/2014128932683291481853511-726
04/29/2014128100680731845549618-3893
05/06/2014146455676631977947884-1734
05/13/201414920986137175156862220738


*COT Report: The weekly commitment of traders report summarizes the total trader positions for open contracts in the futures trading markets. The CFTC categorizes trader positions according to commercial hedgers (traders who use futures contracts for hedging as part of the business), non-commercials (large traders who speculate to realize trading profits) and nonreportable traders (usually small traders/speculators).

The Commitment of Traders report is published every Friday by the Commodity Futures Trading Commission (CFTC) and shows futures positions data that was reported as of the previous Tuesday (3 days behind).

Each currency contract is a quote for that currency directly against the U.S. dollar, a net short amount of contracts means that more speculators are betting that currency to fall against the dollar and a net long position expect that currency to rise versus the dollar.

(The graphs overlay the forex spot closing price of each Tuesday when COT trader positions are reported for each corresponding spot currency pair.)

See more information and explanation on the weekly COT report from the CFTC website.


Article by CountingPips.comCommitment of Traders (COT) reports & News

VIX Futures Speculators raised bearish positions to highest since September in COT data

By CountingPips.com

Weekly CFTC Net Speculator VIX Report


vix


VIX Futures Contracts: Large traders and speculators added to their overall bearish bets in the VIX futures market last week for a third straight week and to the highest level since September, according to the latest data from the Commodity Futures Trading Commission (CFTC) released on Friday.

The VIX non-commercial futures contracts, comprising of large speculator and hedge fund positions, totaled a net bearish position of -82,686 contracts in the data reported for May 13th. This was a change of -19,220 contracts from the previous week’s total of -63,466 net contracts that was registered on May 6th.

The third straight weekly increase in bearish positions brings overall net contracts to the highest bearish level since September 17th 2013 when net positions stood at a level of -91,017 contracts.

Meanwhile, the VIX index over the same reporting time-frame last week edged lower from a 13.80 reading on Tuesday May 6th to a 12.13 reading on Tuesday May 13th, according to the Chicago Board Options Exchange (CBOE) Volatility Index.


Last 6 Weeks of Large Trader Positions

DateOpen InterestLong SpecsShort SpecsNet Non-CommercialsWeekly ChangeVIX Score
04/08/2014359952105096136842-31746-117314.89
04/15/201436888796296132242-35946-420015.61
04/22/2014362130106598140655-34057188913.19
04/29/2014365215110843156329-45486-1142913.71
05/06/2014391848104252167718-63466-1798013.80
05/13/2014419669111532194218-82686-1922012.13

*COT Report: The weekly commitment of traders report summarizes the total trader positions for open contracts in the futures trading markets. The CFTC categorizes trader positions according to commercial hedgers (traders who use futures contracts for hedging as part of the business), non-commercials (large traders who speculate to realize trading profits) and nonreportable traders (usually small traders/speculators). Find CFTC criteria here: (http://www.cftc.gov/MarketReports/CommitmentsofTraders/ExplanatoryNotes/index.htm).


Article by CountingPips.comForex Apps & Analysis


US 10-Year Treasury Note Speculators sharply decreased their bearish positions

By CountingPips.com

Weekly CFTC Net Speculator Report


10yr

Large Speculators net bearish positions rise to a total of -129,409 contracts

10 Year Treasuries: Large futures market traders and speculators reduced their overall bearish bets in the 10-year treasury note futures last week to the lowest level in six weeks, according to the latest Commitment of Traders (COT) data released by the Commodity Futures Trading Commission (CFTC) on Friday.

The non-commercial futures contracts of the 10-year treasury notes, primarily traded by large speculators and hedge funds, totaled a net position of -82,180 contracts in the data reported for May 13th. This was a change of +47,229 contracts from the previous week’s total of -129,409 net contracts that was recorded on May 6th.

The 10-Year Note non-commercial net bearish positions are now at their lowest level since April 1st when total net positions equaled -68,776 contracts.

Over the weekly reporting time-frame, from Tuesday May 6th to Tuesday May 13th, the yield on the 10-Year treasury note showed no change at the 2.61 level, according to data from the United States Treasury Department.


Last 6 Weeks of Large Trader Non-Commercial Positions

DateOpen InterestLong SpecsShort SpecsNet Large SpecsWeekly Change10 Year Yield
04/08/20142572114327159482333-155174-863982.69
04/15/20142497347344056506334-162278-71042.64
04/22/20142493544349474495339-145865164132.73
04/29/20142528687332918447343-114425314402.71
05/06/20142618485340698470107-129409-149842.61
05/13/20142735107421083503263-82180472292.61


*COT Report: The weekly commitment of traders report summarizes the total trader positions for open contracts in the futures trading markets. The CFTC categorizes trader positions according to commercial hedgers (traders who use futures contracts for hedging as part of the business), non-commercials (large traders who speculate to realize trading profits) and nonreportable traders (usually small traders/speculators). Find CFTC criteria here: (http://www.cftc.gov/MarketReports/CommitmentsofTraders/ExplanatoryNotes/index.htm).


Article by CountingPips.comForex Trading Apps


Crude Oil Speculators added to net bullish positions last week

By CountingPips.com

Weekly CFTC Net Speculator Crude Oil Report

crudeoil

CRUDE OIL: Large futures market traders and speculators raised their overall bullish bets in crude oil futures last week after declines the previous two weeks, according to the latest Commitment of Traders (COT) data released by the Commodity Futures Trading Commission (CFTC) on Friday.

The non-commercial contracts of crude oil futures, primarily traded by large speculators and hedge funds, rose to a total net position of +387,739 contracts in the data reported for May 13th. This was a change of +4,646 contracts from the previous week’s total of +383,093 net contracts for the data reported through May 6th.

Last week’s modest increase brings non-commercial net positions back from the lowest level since February 11th when net positions totaled +382,334 contracts.

Over the same weekly reporting time-frame, from Tuesday May 6th to Tuesday May 13th, the crude oil price gained from $99.81 to $101.86 per barrel, according to Nymex futures price data from investing.com. Brent crude prices, meanwhile, also showed a rise from $107.12 to $108.67 per barrel from Tuesday May 6th to Tuesday May 13th, according to prices from investing.com.

Last 6 Weeks of Large Trader Non-Commercial Positions

DateOpen InterestLong SpecsShort SpecsNet Non-CommercialsWeekly ChangeOil Price
04/08/201416554725120351122483997878004102.33
04/15/201416742765234901139394095519764103.78
04/22/20141619737517023106898410125574101.92
04/29/20141651521522018119691402327-7798100.58
05/06/20141638412492901109808383093-1923499.81
05/13/201416274034950801073413877394646101.86

*COT Report: The weekly commitment of traders report summarizes the total trader positions for open contracts in the futures trading markets. The CFTC categorizes trader positions according to commercial hedgers (traders who use futures contracts for hedging as part of the business), non-commercials (large traders who speculate to realize trading profits) and nonreportable traders (usually small traders/speculators). Find CFTC criteria here: (http://www.cftc.gov/MarketReports/CommitmentsofTraders/ExplanatoryNotes/index.htm).

Article by CountingPips.comForex Trading News


Gold Speculators trim bullish bets following 3 weeks of rises

By CountingPips.com

Weekly CFTC Net Speculator Gold Report

gold

GOLD: Futures market traders and large speculators decreased their net bullish bets in the gold futures market last week after traders had raised their bullish positions for the previous three weeks, according to the latest Commitment of Traders (COT) data released by the Commodity Futures Trading Commission (CFTC) on Friday.

The non-commercial futures contracts of Comex gold futures, traded by large speculators and hedge funds, totaled a net position of +91,634 contracts in the data reported through May 13th. This was a change of -6,322 contracts from the previous week’s total of +97,956 net contracts that was registered on May 6th.

The gold non-commercial net positions stood at the highest level since April 1st before last week’s decrease.

Over the weekly reporting time-frame, from Tuesday May 6th to Tuesday May 13th, the gold price declined from $1,307.60 to $1,295.20 per ounce, according to gold futures price data from investing.com.


Last 6 Weeks of Large Trader Non-Commercial Positions

DateOpen InterestLong SpecsShort SpecsNet Non-CommercialsWeekly ChangeGold Price
04/08/20143654001496936109488599-115461310.10
04/15/20143695771474326814079292-93071302.90
04/22/2014372593146880650478183325411284.90
04/29/2014378092147769625428522733941296.20
05/06/20144047001609826302697956127291307.60
05/13/20143970291571766554291634-63221295.20

*COT Report: The weekly commitment of traders report summarizes the total trader positions for open contracts in the futures trading markets. The CFTC categorizes trader positions according to commercial hedgers (traders who use futures contracts for hedging as part of the business), non-commercials (large traders who speculate to realize trading profits) and nonreportable traders (usually small traders/speculators). Find CFTC criteria here: (http://www.cftc.gov/MarketReports/CommitmentsofTraders/ExplanatoryNotes/index.htm).

Article by CountingPips.comForex Trading Apps


EURUSD Forex Trading Pivot Point Levels: Euro drops under 1.3700

2014.05.15 12:30 6:30AM ET | EURUSD Currency Pair

SC EURUSD 2014.05.15

Here are the Pivot Points Levels with Support (S) and Resistance (R) for the EURUSD currency pair today. Price action is currently trading at the 1.36714 price level and under the daily pivot point, according to data at 6:30 AM ET. The EURUSD high for the day has been 1.37227 while the low of day has fallen to 1.36588. The pair earlier today opened the Asian trading session virtually on top of the daily pivot and has trended sharply lower today with prices declining to the S1 support level.

Daily Pivot Point: 1.37137
— S1 – 1.36972
— S2 – 1.36810
— S3 – 1.36645
— R1 – 1.37299
— R2 – 1.37464
— R3 – 1.37626


Weekly Pivot Points: EURUSD

SC EURUSD 2014.05.15

Prices are currently trading sharply under the weekly pivot point and right near the S1 support level at time of writing. The EURUSD has been on an overall bearish trend this week after opening the trading week below the weekly pivot.

Weekly Pivot Point: 1.38313
— S1 – 1.36695
— S2 – 1.35829
— S3 – 1.34211
— R1 – 1.39179
— R2 – 1.40797
— R3 – 1.41663


By CountingPips.com – Forex Trading Apps & Currency Trade Tools

Disclaimer: Foreign Currency trading and trading on margin carries a high level of risk and volatility and can result in loss of part or all of your investment. All information and opinions contained do not constitute investment advice and accuracy of prices, charts, calculations cannot be guaranteed.