By Orbex
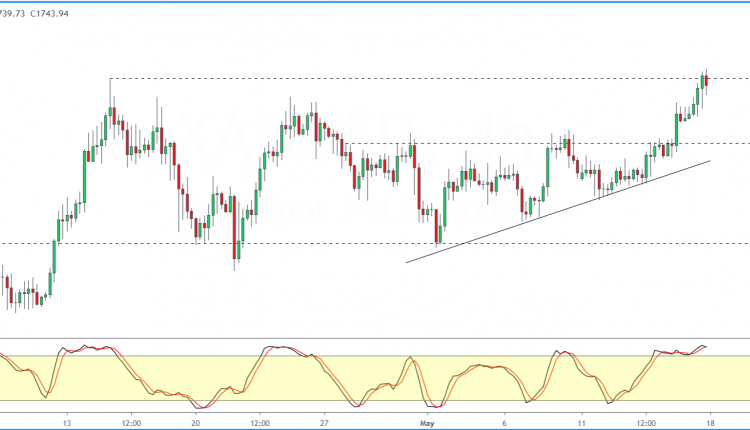
The precious metal rose just under 1% on Friday, settling at 1743.94.
But, this was not before rising to intraday highs of 1751.42. This also marks the upside target of the ascending triangle pattern.
Gold prices were consolidating below the technical resistance level of 1717.65.
Following the higher lows, price action eventually broke past the resistance level.
At 1743.94, gold prices are now testing the April 14 highs.
Free Reports:
 Get Our Free Metatrader 4 Indicators - Put Our Free MetaTrader 4 Custom Indicators on your charts when you join our Weekly Newsletter
 Get our Weekly Commitment of Traders Reports - See where the biggest traders (Hedge Funds and Commercial Hedgers) are positioned in the futures markets on a weekly basis.
If there is no further breakout, expect a pullback. The previous price level at 1717.65 could be tested for support.
By Orbex