By IFCMarkets
Improving US data bullish for SP500
US economic data improved in the last couple of weeks of past year. Will the SP500 stock index continue rising?
US data lately were positive on balance: personal spending and income rose more than expected in November, goods trade deficit narrowed when widening was expected, and Case-Shiller home price index for 20 major metropolitan areas ticked up to 2.2% over year in October from a 2.1% rise in September. US personal income advanced 0.5% over month in November 2019 when 0.3% growth was forecast, and consumer spending rose 0.4% over month when steady 0.3% growth was expected. The trade deficit on goods narrowed to $63.19 billion in November 2019 from $66.8 billion in the previous month when a rise to $68.75 billion was forecast. On the negative side orders for durable goods fell 2% in November, however orders excluding transportation were unchanged while orders excluding defense rose 0.8% over month after stagnant October. At the same time both new home and pending home sales rose over month in November. Against this background of positive dynamics the achievement of interim trade agreement on a phase one deal between the US and China provided additional support to risk appetite. Continuing economic growth is bullish for US equities market.
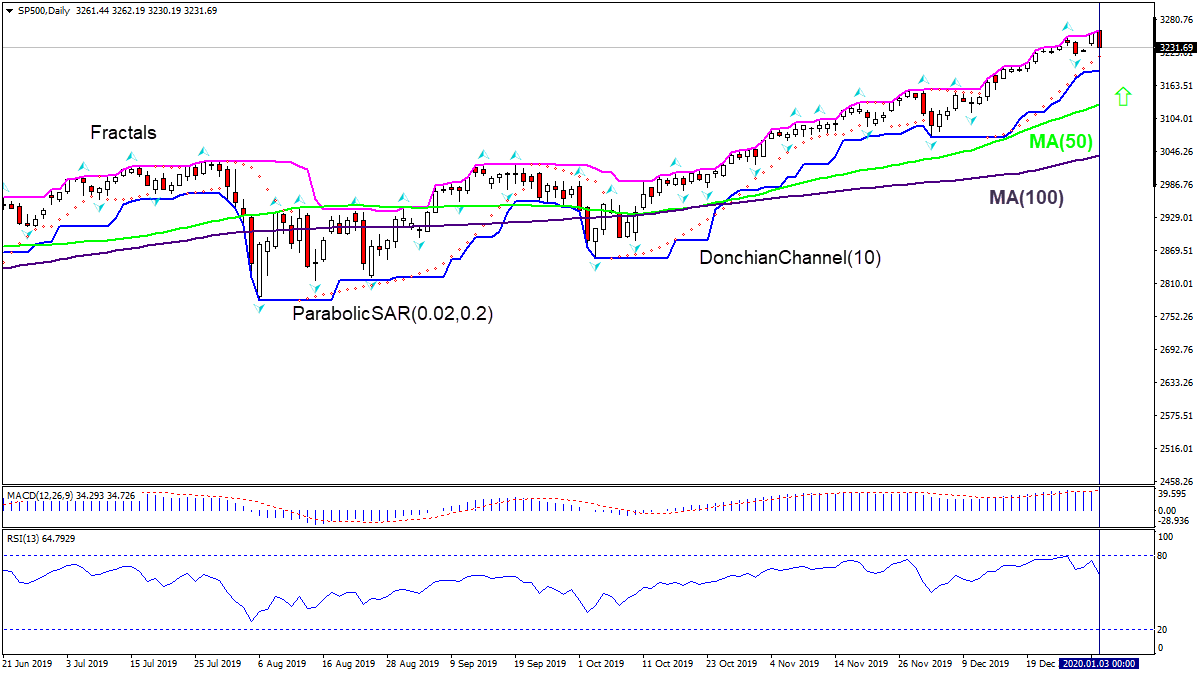
On the daily timeframe SP500: D1 has pulled back after closing at record. Price is above both fifty-day and hundred-day moving averages MA(50) and MA(100) which are both rising.
- The Parabolic indicator gives a buy signal.
- The Donchian channel indicates uptrend: it is widening up.
- The MACD indicator has risen above the signal line and the gap is widening, this is a bullish signal.
- The RSI oscillator was close to overbought zone but hasn’t crossed into it.
We believe the bullish momentum will continue after the price breaches above the upper Donchian boundary at 3262.19. This level can be used as an entry point for placing a pending order to buy. The stop loss can be placed below the lower Donchian boundary at 3188.04. If the price meets the stop-loss level (3188.04) without reaching the order (3262.19) we recommend cancelling the order: the market sustains internal changes which were not taken into account.
Free Reports:
 Get Our Free Metatrader 4 Indicators - Put Our Free MetaTrader 4 Custom Indicators on your charts when you join our Weekly Newsletter
 Get our Weekly Commitment of Traders Reports - See where the biggest traders (Hedge Funds and Commercial Hedgers) are positioned in the futures markets on a weekly basis.
Technical Analysis Summary
| Order | Buy |
| Buy Stop | Above 3262.19 |
| Stop loss | Below 3188.04 |
Market Analysis provided by IFCMarkets