Article By RoboForex.com
BTCUSD, “Bitcoin vs US Dollar”
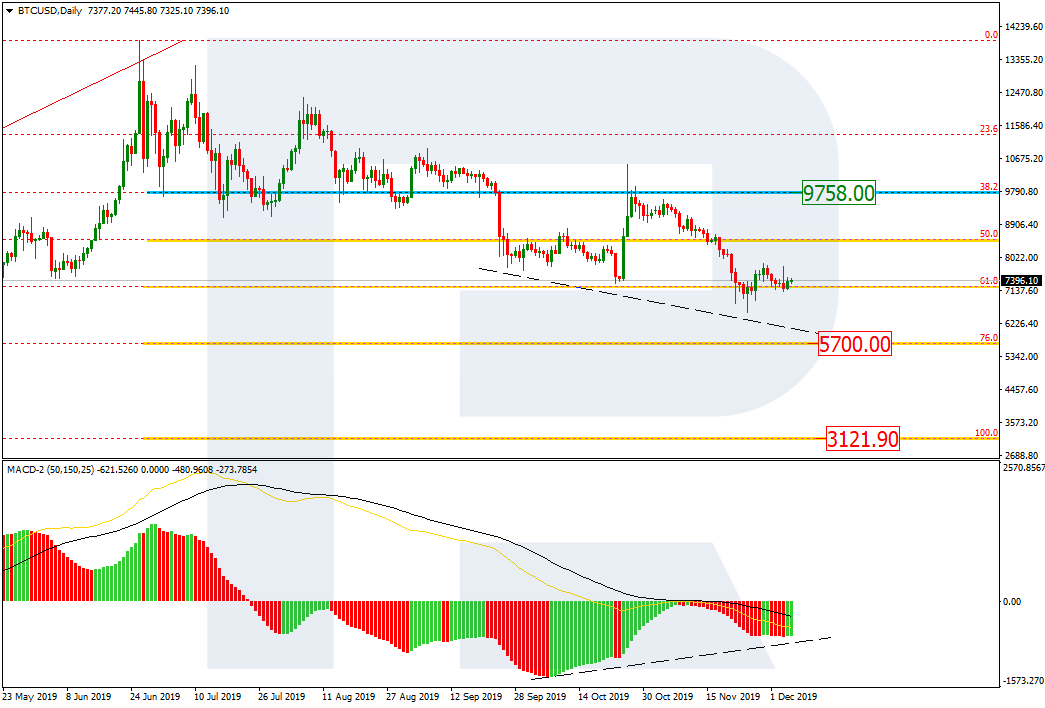
As we can see in the daily chart, after finishing a quick correctional impulse, BTCUSD is forming a new descending wave, which has already reached 61.8% fibo and may start a new short-term correction to the upside. After completing it, the pair may resume falling towards the target at 76.0% (5700.00). At the same time, there is a convergence on MACD, which may indicate a more significant correction after the price reaches the target. The key mid-term downside target is the low at 3121.90. The resistance is 38.2% fibo at 9758.00.

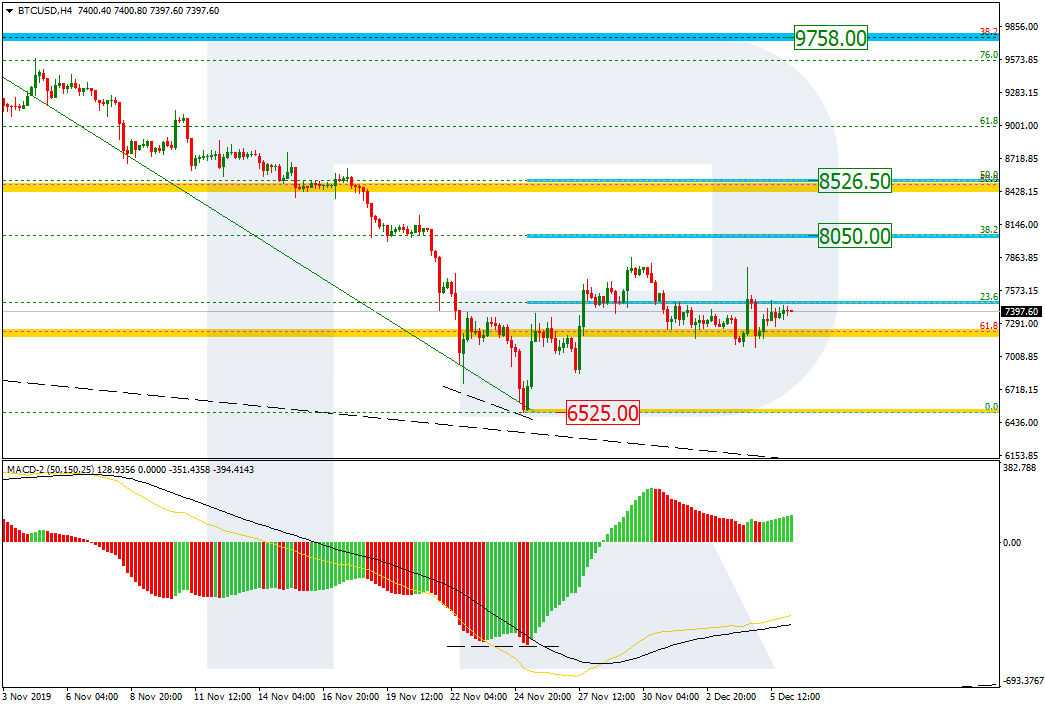
The H4 chart shows more detailed structure of the current local correction. By now, the pair has managed to reach only 23.6% fibo, but may later continue growing towards 38.2% and 50.0% fibo at 8050.00 and 85.26.50 respectively. If the price breaks the local support at 6525.00, the correction will be over.
ETHUSD, “Ethereum vs. US Dollar”
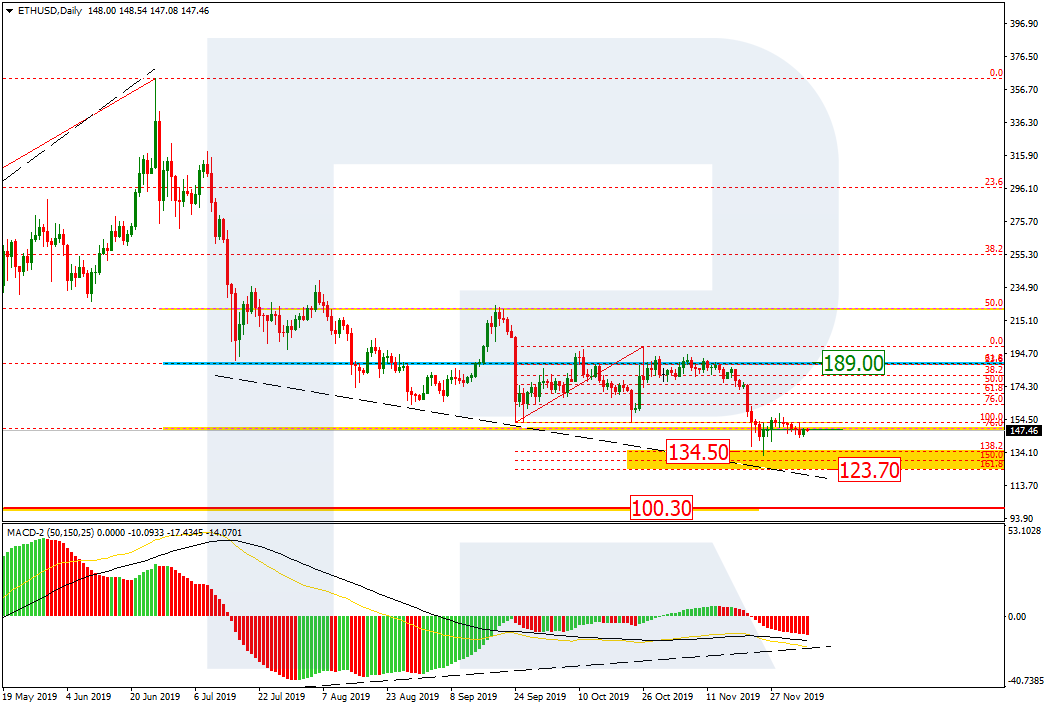
As we can see in the daily chart, the downtrend has reached 76.0% fibo; right now, ETHUSD is expected to start a new correction. The resistance is 61.8% fibo at 189.00. After completing this short-term pullback, the instrument may continue falling towards the post-correctional extension area between 138.2 and 161.8% fibo at 134.50 and 123.70 respectively, and then the psychologically-crucial at 100.30.
Free Reports:
 Get Our Free Metatrader 4 Indicators - Put Our Free MetaTrader 4 Custom Indicators on your charts when you join our Weekly Newsletter
 Get our Weekly Commitment of Traders Reports - See where the biggest traders (Hedge Funds and Commercial Hedgers) are positioned in the futures markets on a weekly basis.
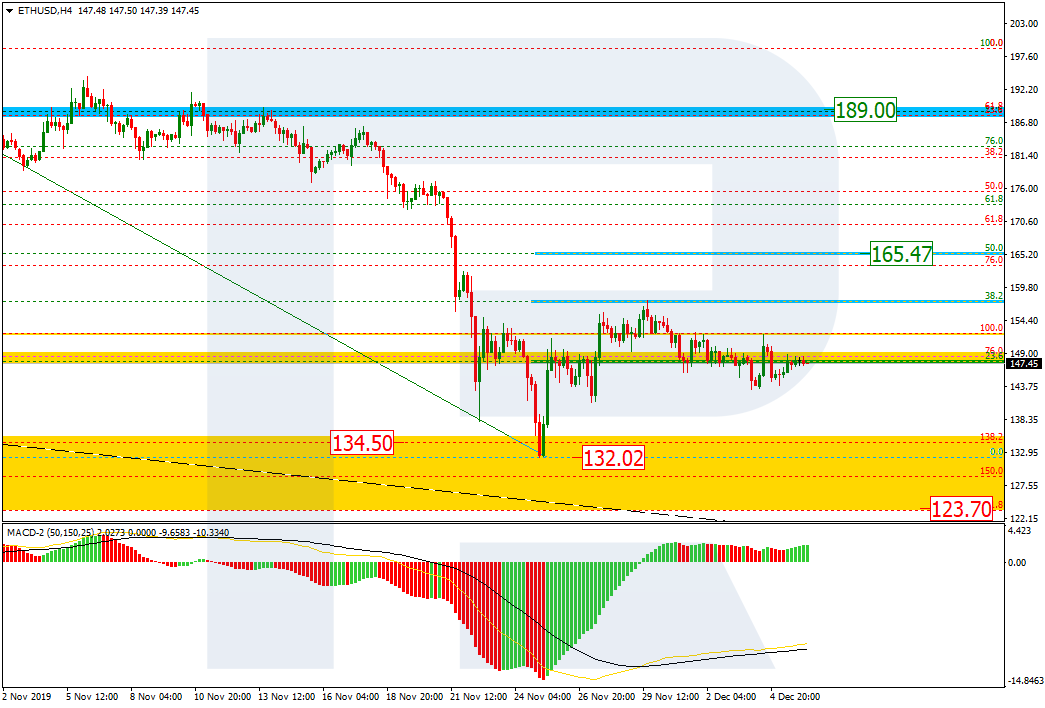
The H4 chart shows more detailed structure of the current correction, which has already reached 38.2% fibo. Later, the price may continue growing towards 50.0% fibo at 165.47. the support is the low at 132.02.
Article By RoboForex.com
Attention!
Forecasts presented in this section only reflect the author’s private opinion and should not be considered as guidance for trading. RoboForex LP bears no responsibility for trading results based on trading recommendations described in these analytical reviews.