October 9, 2019
By IFCMarkets
Positive Canadian data bearish for USDCAD
Recent Canadian housing data were better than expected. Will the USDCAD decline?
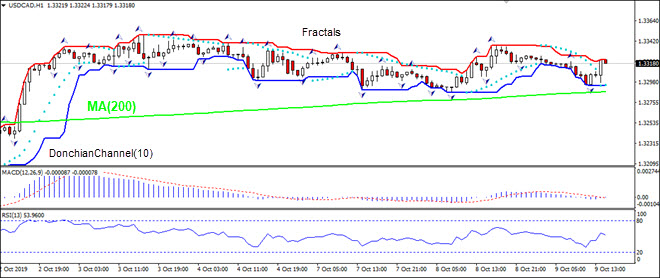
The price chart on 1-hour timeframe shows USDCAD: H1 is trading sideways. The price is above the 200-period moving average MA(200) which is rising. And the RSI is above 50 level but has not reached the overbought zone. There is no trend yet formed, traders have to decide when it would be a best time to enter the market.
Market Analysis provided by IFCMarkets