By IFCMarkets
Getting ready for trade talks between the US and China
On October 10-11, the next trade talks between the USA and China will start. Will the New Zealand dollar quotations grow?
Deliveries of goods to China account for approximately 20% of New Zealand’s exports. Because of this, possible positive factors for the Chinese economy may support the New Zealand currency. US President Donald Trump said that he counts on success in negotiations with China. Another positive factor for the New Zealand dollar may be the good results of the Global Dairy Trade auction of dairy products. Sales volumes increased by 3.7%, and the average price – by 0.2%. Auctions are held 2 times a month, the next will be held on October 15. The dynamics of the New Zealand dollar may be affected by the indicator of business activity in industry (Manufacturing PMI), which will be published on October 11.
На дневном таймфрейме, NZDUSD: D1 вышел из нисходящего тренда наверх. Ряд индикаторов технического анализа сформировали сигналы к повышению. Дальнейший рост котировок возможен в случае публикации позитивных данных в Новой Зеландии и успеха на американо-китайских торговых переговорах.
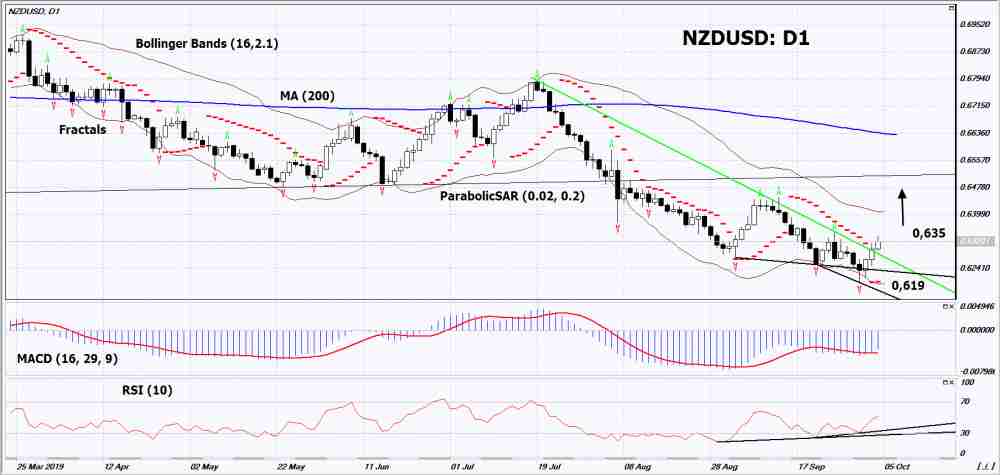
- The Parabolic indicator demonstrates a signal to increase.
- The Bolinger bands narrowed, indicating a volatility decrease. Both Bollinger Lines Tilt Up.
- The RSI indicator is above the 50 mark. It has formed a double divergence to increase.
- The MACD indicator gives a bullish signal.
The bullish momentum may develop if NZDUSD exceeds its last upper fractal: 0.635. This level can be used as an entry point. Initial stop lose may be placed below the last lower fractal, 4-year low, Parabolic signal and the lower Bollinger line: 0.619. After opening the pending order, the stop shall be moved following the Bollinger and Parabolic signals to the next fractal minimum. Thus, we are changing the potential profit/loss to the breakeven point. More risk-averse traders may switch to the 4-hour chart after the trade and place a stop loss moving it in the direction of the trade. If the price meets the stop level (0,619) without reaching the order (0,635), we recommend to cancel the order: the market sustains internal changes that were not taken into account.
Technical Analysis Summary
| Position | Buy |
| Buy stop | Above 0,635 |
| Stop loss | Below 0,619 |
Market Analysis provided by IFCMarkets
Free Reports:
 Get Our Free Metatrader 4 Indicators - Put Our Free MetaTrader 4 Custom Indicators on your charts when you join our Weekly Newsletter
 Get our Weekly Commitment of Traders Reports - See where the biggest traders (Hedge Funds and Commercial Hedgers) are positioned in the futures markets on a weekly basis.