Article By RoboForex.com
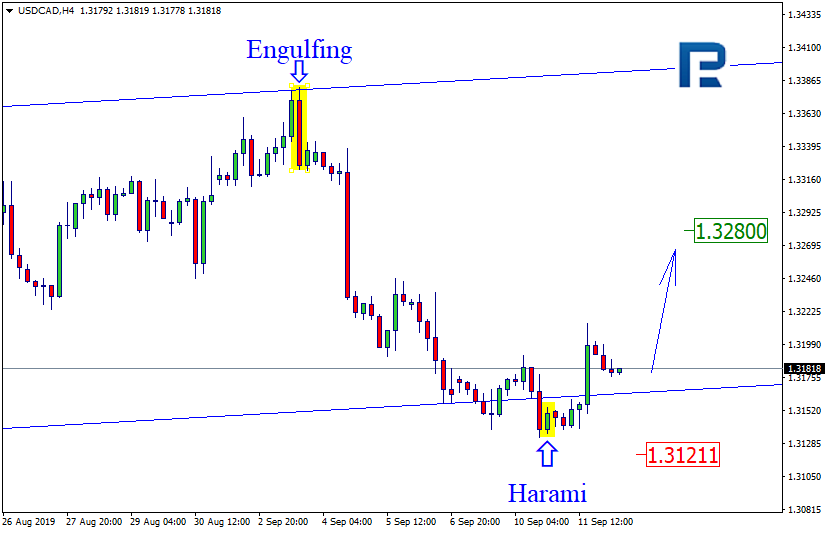
USDCAD, “US Dollar vs Canadian Dollar”
As we can see in the H4 chart, USDCAD continues trading close to the rising channel’s downside border and forming reversal patterns. Right now, the pair is trying to reverse after forming Harami pattern. At the moment, it may be assumed that the price may complete a slight correction and resume growing towards 1.3280. However, we shouldn’t ignore a possibility that the instrument may update the low and continue its decline to reach 1.3121.

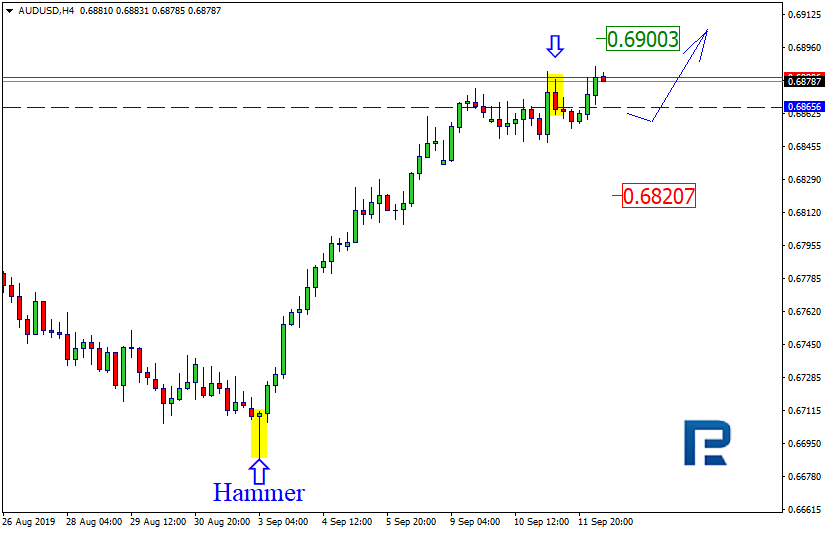
AUDUSD, “Australian Dollar vs US Dollar”
As we can see in the H4 chart, AUDUSD is trading close to the resistance level and forming reversal patterns, including Harami. The pair wasn’t able to reverse and updated the high instead. Judging by the previous movements, we may assume that the price may continue trading upwards to reach 0.6900. However, we shouldn’t ignore a possibility that the instrument may resume falling 0.6820.
Article By RoboForex.com
Free Reports:
 Get Our Free Metatrader 4 Indicators - Put Our Free MetaTrader 4 Custom Indicators on your charts when you join our Weekly Newsletter
 Get our Weekly Commitment of Traders Reports - See where the biggest traders (Hedge Funds and Commercial Hedgers) are positioned in the futures markets on a weekly basis.
Attention!
Forecasts presented in this section only reflect the author’s private opinion and should not be considered as guidance for trading. RoboForex LP bears no responsibility for trading results based on trading recommendations described in these analytical reviews.