By Money Metals News Service
The gold and silver prices have held up remarkably well compared to the broader markets as they continue to sell off today. While the Dow Jones Index is down more than 250 points, gold and silver are just slightly lower. However, gold has traded in the green several times today.
If we look at the 5-minute chart, we can plainly see that gold and silver have been trading in an opposite trend to the Dow Jones. As the Dow declined, the precious metals Silver ETF (SLV) and Gold ETF (GLD) share prices went higher.
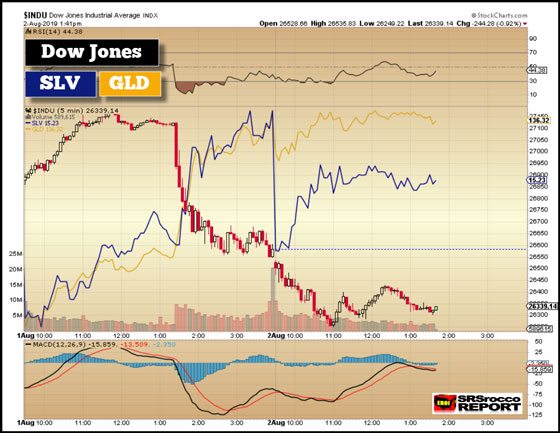
I am using the Gold and Silver ETFs as a comparison because Stockcharts.com does not show Gold or Silver futures in the intraday charts. Here we can see that when the new Chinese tariffs were announced yesterday, both gold and silver shot up higher. And even as the Dow Jones Index sold off today, both the SLV ETF and GLD ETF moved higher.
The silver price sold off during Asian trading as silver has been outperforming both gold and the broader markets over the past month. The next chart shows that silver is up more than 8% over the past month, while the gold was up 4% and the Dow Jones down 2%:
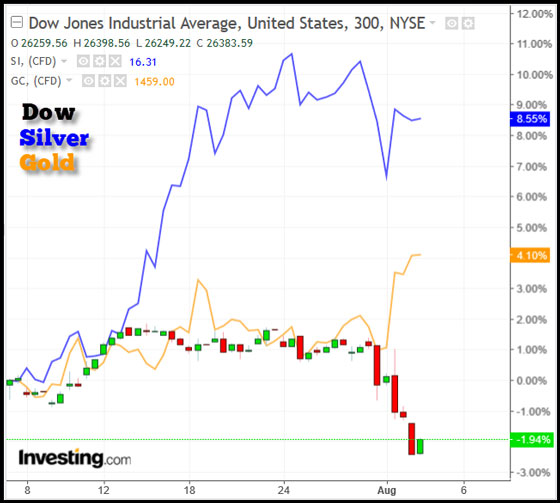
Again, we can see that both gold and silver shot up higher when the Dow Jones sold off the past few days. And according to the Northman Trader (Sven Heinrich), who appears regularly on CNBC, has provided his chart of the S&P 500, showing a large selloff could occur due to the technical pattern:
Free Reports:
 Get Our Free Metatrader 4 Indicators - Put Our Free MetaTrader 4 Custom Indicators on your charts when you join our Weekly Newsletter
 Get our Weekly Commitment of Traders Reports - See where the biggest traders (Hedge Funds and Commercial Hedgers) are positioned in the futures markets on a weekly basis.
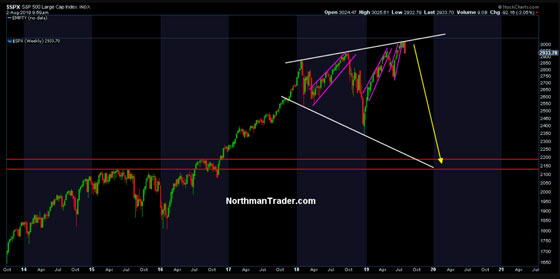
Sven has been writing articles suggesting that the markets are seriously over-valued, due to the Fed and Central bank propping. If the S&P 500 Index does indeed finally correct lower as the technical setup above indicates, then we could see a continued precious metals disconnect as gold and silver move higher.
I did an update of the chart above to show that the GLD & SLV continue to trade at an inverse relationship to the Dow Jones today:
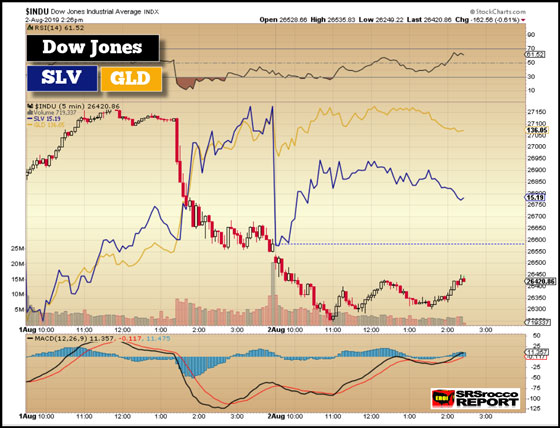
What is interesting is that the GLD and SLV were going up in price along with the Dow Jones before the Chinese tariffs were announced, then decoupled right at 1:30 pm EST on Thursday, Aug 1st. Thus, the GLD and SLV (mimicking the gold & silver prices), are now trading in an inverse trend to the Dow Jones Index.
However, the important thing to note is that the GLD and SLV are both higher than what they were at 1:30 pm EST on Thursday versus the Dow Jones Index which is down more than 700 points.
So, it’s going to be interesting to see how the precious metals trade compared to the broader markets in August.
 The Money Metals News Service provides market news and crisp commentary for investors following the precious metals markets.