By IFCMarkets
Dow and SP500 end in negative territory for 2018
US stocks retreat continued on Tuesday. The S&P 500 fell 1.8% to 2641.9 with all 11 main sectors ending in the red. Dow Jones industrial average dropped 2.2% to 24465.64, led by 4.8% drop in Apple. The Nasdaq extended losses 1.7% to 6908.82. The dollar strengthening resumed despite housing data showed housing starts rose by just 1.5% over month in October instead of an expected 2.2%, registering 2.9% decline from a year ago. The live dollar index data show the ICE US Dollar index, a measure of the dollar’s strength against a basket of six rival currencies, rose 0.7% to 96.80 but is lower currently. Futures on stock indices point to higher openings today.
DAX 30 still loss leader among major European indices
European stocks added to previous session losses on Tuesday. Both the EUR/USD and GBP/USD turned lower but are higher currently. The Stoxx Europe 600 fell 1%. The German DAX 30 dropped 1.5% to 11067.63. France’s CAC 40 lost 1.2% and UK’s FTSE 100 slid 0.8% to 6946.42.
Chinese stock recover while Asian indices down
Asian stock indices are mixed today. Nikkei lost 0.4% to 21507.54 despite yen continued slide against the dollar. Chinese stocks turned higher: the Shanghai Composite Index is up 0.2% and Hong Kong’s Hang Seng index is 0.6% higher. Australia’s All Ordinaries Index however extended losses 0.5% as Australian dollar resumed climb against the greenback.
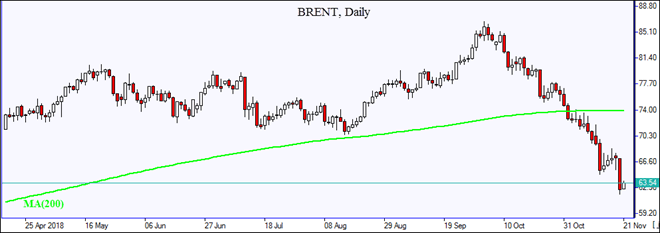
Brent down
Brent futures prices are recovering today after sharp fall yesterday. Prices were supported by the American Petroleum Institute late Tuesday report indicating US crude inventories fell by 1.5 million barrels last week. Prices tumbled yesterday after data October US petroleum inventory was above the five-year average. January Brent fell 6.4% to $62.53 a barrel Tuesday. Today at 16:30 CET the Energy Information Administration will release US Crude Oil Inventories.
Market Analysis provided by IFCMarkets
Free Reports:
 Get Our Free Metatrader 4 Indicators - Put Our Free MetaTrader 4 Custom Indicators on your charts when you join our Weekly Newsletter
 Get our Weekly Commitment of Traders Reports - See where the biggest traders (Hedge Funds and Commercial Hedgers) are positioned in the futures markets on a weekly basis.
Note:
This overview has an informative and tutorial character and is published for free. All the data, included in the overview, are received from public sources, recognized as more or less reliable. Moreover, there is no guarantee that the indicated information is full and precise. Overviews are not updated. The whole information in each overview, including opinion, indicators, charts and anything else, is provided only for familiarization purposes and is not financial advice or а recommendation. The whole text and its any part, as well as the charts cannot be considered as an offer to make a deal with any asset. IFC Markets and its employees under any circumstances are not liable for any action taken by someone else during or after reading the overview.