WTI Crude Prices Declines on Concerns Over China Demand

By HY Markets Forex Blog

Prices for West Texas Intermediate (WTI) crude oil dropped for a second day on the first day of the trading week, as investors express their worries over the oil demand from China and the slow growth in the world’s second-largest oil consumer due to the weak manufacturing data.

The North American WTI for March delivery lost 0.35%, trading at $97.09 per barrel on the New York Mercantile Exchange at the time of writing.  At the same time the Brent crude oil for March settlement declined 0.09%, trading at $106.31 per barrel on the London-based ICE Futures exchange. The Brent crude was at a premium of $8.80 per barrel to WTI.

WTI- China Data

The Drop in oil prices were dragged lower by the downbeat Chinese manufacturing Data and service Purchasing Managers’ Index (PMI) data. The Chinese manufacturing PMI dropped to a six-month low of 50.5 for January, dropping from 51.0 previously recorded in December.

The gauge of non-manufacturing activity, released by China revealed the services sector PMI was dropping close to a two-year low of 53.4, adding signs of China’s growth slowdown.

WTI – US Data

Later during the day, the institute for Supply Management is expected to show manufacturing PMI figures, as analysts are expected to see a decline of 56 in January, compared to 57 recorded in the previous month.

Other news

Over the last week, the surge in crude oil prices were driven by the Federal Reserve’s (Fed) conclusion to cut its monthly bond purchases further as the world’s largest economy shows signs of improvement.

The rise in black gold prices was driven by the US Cushing crude inventories data, which revealed a rise of 237,000. Meanwhile in the Eurozone, the manufacturing gauge is forecasted to remain unchanged at 53.9 for January, while countries in the 18-nation euro region are expected to report final readings for January.


Visit www.hymarkets.com   to find out more about our products and start trading today with only $50 using the latest trading technology today.

The post WTI Crude Prices Declines on Concerns Over China Demand appeared first on | HY Markets Official blog.

Article provided by HY Markets Forex Blog

Australian Dollar Strengthens Ahead RBA Rate Decision

By HY Markets Forex Blog

The Australian dollar rose against the greenback on Monday, before members of the Reserve Bank of Australia’s (RBA) board assemble on Tuesday to discuss monetary policy. Market analysts are forecasting the bank to keep its interest rate unchanged after cutting its official cash rate by 25 basis points since November 2011 to its current record low level of 2.50%.

The Australian dollar rose 0.54% higher at $0.8797 at the time of writing, at the same time the aussie advanced by 0.32% to $1.5351 against the 18-block euro.

Data released earlier on Monday showed that building approvals for new buildings in the country dropped for a third month in December. A separate report released showed the job listings in Australia lowered for the fourth month in a row in January, showing signs that the labour sector has weakened further.

Australian Dollar – RBA Rate Decision

The Reserve Bank of Australia (RBA) has kept its interest rate since August 2013, after trimming its 2.75% benchmark rate by 25 basis points. In the previous meeting, officials of the bank did not close the possibility of reducing the rates further to support the economy growth and meeting the inflation target.

“While the exchange rate had depreciated over the month, members agreed that it remained uncomfortably high and a lower level would likely be needed to achieve balanced growth in the economy,” the December meeting minutes stated.

Fed-Tapering Decision

The Federal Open Market Committee (FOMC) concluded its two-day meeting last week by deciding to reduce the central bank’s monthly purchases of treasuries and mortgage-backed securities (MBS) by an additional $5 billion.

Fed members concluded to reduce the monthly asset purchases despite the weak employment report which came in below analyst forecast. The unemployment rate dropped to 6.7% in December, the lowest since October 2008.


Visit www.hymarkets.com   to find out more about our products and start trading today with only $50 using the latest trading technology today.

The post Australian Dollar Strengthens Ahead RBA Rate Decision appeared first on | HY Markets Official blog.

Article provided by HY Markets Forex Blog

Forex Technical Analysis 03.02.2014 (EUR/USD, GBP/USD, USD/CHF, USD/JPY, AUD/USD, GOLD)

Article By RoboForex.com

Analysis for February 3rd, 2014

EUR/USD

Euro is still moving inside descending channel, which may be considered as correction. We think, today price may reach new minimum and then start new ascending wave to reach target at level of 1.3570.

GBP/USD

Pound is still moving inside the third descending wave. We think, today price may reach new minimum and then start moving upwards to return to level of 1.6560.

USD/CHF

Franc completed its correction. We think, today pair may consolidate for a while and then start forming reversal pattern to continue moving inside descending trend towards target at level of 0.8880.

USD/JPY

Yen is finishing its descending structure with target at 101.70. We think, today price may reach this target and then start forming new ascending structure to reach level of 104.00.

AUD/USD

Australian Dollar is still moving inside descending structure with main target at 0.8400. We think, today price may continue moving downwards to break level of 0.8660, consolidate for a while, and then form continuation pattern to continue this descending movement to reach local target at level of 0.8460.

GOLD

Gold is still forming the fourth wave of current correction. We think, today price may reach level of 1258, and then complete this correction by forming its fifth wave at level of 1230. Later, in our opinion, instrument may form reversal pattern and start new ascending movement towards level of 1360.

RoboForex Analytical Department

Article By RoboForex.com

Attention!
Forecasts presented in this section only reflect the author’s private opinion and should not be considered as guidance for trading. RoboForex LP bears no responsibility for trading results based on trading recommendations described in these analytical reviews.


Patent #20140019367 Threatens to Bring Down the U.S. Mint

By WallStreetDaily.com Patent #20140019367 Threatens to Bring Down the U.S. Mint

Last Wednesday, I was fortunate to appear on CNBC’s Closing Bell to discuss Apple’s (AAPL) precipitous, post-earnings selloff.

You’ll recall, the stock fell to its lowest level in three months, thanks to disappointing iPhone sales.

The crux of our debate centered on investors’ perception that Apple is in an “innovate or die” situation. I disagree.

Well, during the segment, anchor Kelly Evans challenged my assertion that Apple has big plans for a mobile payment system (more on that in a moment).

Meanwhile, Bert Dohmen of Dohmen Capital zinged me at the end for my outlook on the stock.

In any event, check out the footage and let me know what you think.

Apple_Image
Now, during the interview, I couldn’t share all the evidence that Apple is, indeed, laying the groundwork for a mobile payments service.

So let me give you a full rundown now…

  • According to The Wall Street Journal’s sources, CEO Tim Cook and Eddy Cue (who oversees Apple’s iTunes Store and App Store) recently met with industry leaders to discuss handling payments for physical goods and services.
  • The company’s been on the hunt for a mobile payments guru to spearhead its efforts, and decided on longtime Apple executive, Jennifer Bailey.
  • Patent application #20140019367 was made public on January 16. This one is huge, since it details a “method to send payment data through various air interfaces without compromising user data.” (It won’t be long before ALL commerce moves to mobile, which would eliminate the need for cash – and coins – entirely!)
  • Executives from eBay’s (EBAY) subsidiary, PayPal, offered to help Apple manage its mobile payments service. I’m sorry. But when the competition is trying to join forces with you, it’s obvious the threat is real, imminent and significant.
  • And as I shared last February with Tech & Innovation Daily readers, in the span of a few short months, Apple secured all the necessary pieces to incorporate biometric identification and mobile payment capabilities into a device – the patents, the software and the hardware. (Then the company rolled out the iPhone 5S.)

Call me brain dead if you want (Mr. Dohmen did), but it’s pretty clear to me that the company is now bolstering its mobile payment capabilities in preparation for a broad deployment.

For good reason, too.

Forrester Research estimates that Americans will spend $90 billion over mobile payment platforms by 2017, up from only $12.8 billion in 2012. That’s a 603% increase.

And as Forrester’s Denee Carrington says, “Apple is absolutely the sleeping giant in the payments world. They have the capability; they just haven’t tied it all together.”

Not yet, that is. But all the evidence points to it happening as we speak.

Bottom line: As Mr. Icahn stated in his recent letter to Apple shareholders, “We believe a revolutionary payments solution is now a very real opportunity that the company could choose to pursue.”

Newsflash: They’re pursuing it right now! And I’m convinced that it promises to be the pivotal “innovation” that propels Apple’s stock higher in the coming year.

And my colleague, Karim Rahemtulla, has come up with the most ingenious way yet to profit from this inevitability.

It’s an opportunity to put as much as $26,000 in your pocket instantly.

Go here for all the details.

Ahead of the tape,

Louis Basenese

The post Patent #20140019367 Threatens to Bring Down the U.S. Mint appeared first on Wall Street Daily.

Article By WallStreetDaily.com

Original Article: Patent #20140019367 Threatens to Bring Down the U.S. Mint

Japanese Candlesticks Analysis 03.02.2014 (EUR/USD, USD/JPY)

Article By RoboForex.com

Analysis for February 3rd, 2014

EUR/USD

H4 chart of EUR/USD shows bearish tendency, which continued after Three Methods pattern. Price has reached closest Window and formed Tweezers pattern below it, which indicates correction. Three Line Break chart and Heiken Ashi candlesticks confirm descending movement.

H1 chart of EUR/USD shows sideways correction below closest Window. Three Line Break chart and Heiken Ashi candlesticks confirm descending movement; Tweezers pattern indicates possible correction.

USD/JPY

H4 chart of USD/JPY shows bearish tendency. Small lower Window is support level. Three Line Break chart and Heiken Ashi candlesticks confirm descending movement towards Window.

H1 chart of USD/JPY shows descending trend. Three Methods pattern, Three Line Break chart, and Heiken Ashi candlesticks confirm descending movement.

RoboForex Analytical Department

Article By RoboForex.com

Attention!
Forecasts presented in this section only reflect the author’s private opinion and should not be considered as guidance for trading. RoboForex LP bears no responsibility for trading results based on trading recommendations described in these analytical reviews.


The Small-Cap Facts of Life

By MoneyMorning.com.au

I’ll never forget the instructions my old boss gave me when I started out on the trading floor.

I was a freshly-minted analyst for a large European investment bank. My job was to find compelling equity investment opportunities on the US market and sell these ideas to pension and hedge fund managers.

Naturally, I was curious about what kind of companies I should look for. So I asked the boss.

I’ve never forgotten his reply…

I remember it even today. He told me:

‘Tim, don’t even bother looking at companies worth less than a billion dollars. If a stock’s got less market cap than that, our clients can’t build a meaningful position without moving the price too much. In any case, most of their mandates forbid them from even looking at stocks that small. So don’t waste your time on them.’

I was surprised. My managing director was telling me to ignore more than 80% of the potential investments in the market? Well, at least it’ll make my stock searches quicker, I thought.

It’s only now, many years later, that I recognise that the opportunities that big fund managers ignore can be breathtakingly more lucrative than the ones they pursue. Rich rewards tend to come from high-risk investments.

Fund managers’ jobs (not to mention their bonuses) rely on steering multi-billion dollar portfolios to annual percentage returns that are not too far off the return on the index. That means they have to avoid stocks that have the potential to ‘move the needle’ too much one way or another.

But just because fund managers shy away from small-caps doesn’t mean you should.

In fact, as I’ll show you in a moment, the absence of institutional investment leaves rich pickings for you, the individual investor…

An Astonishingly Wide Gap

The simple fact is that smaller companies reliably outperform large ones over the longer term.

Small really is beautiful.

Let me show you the evidence.

The chart below is taken from a long-running research project by two London Business School academics, Elroy Dimson and Paul Marsh.

The chart shows that long-run smaller company outperformance has been great.

It also shows that 2013 was a particularly good year for small-caps around the world.

By the way, you’ll note from the chart that Dimson and Marsh haven’t broken out the Australian market.

If they had, it would have shown the tough time Aussie small-caps endured in 2013.

The factors that dragged on the resource-heavy Aussie small-cap sector last year are well documented…chief among them is the cooling of the mining boom and an investor preference for large-cap dividend yield. That shouldn’t strike you as news.

That being said, the global effect on display in that chart is unmistakable.

The analysis I’m doing right now for Australian Small-Cap Investigator is all pointing to one outcome: when Australian small-caps rejoin this trend of outperformance, 2014 looks set to be a lucrative time for stock investors.

If you compare ‘small versus large’ stock performance across the 30 countries in Dimson and Marsh’s study, the analysis reveals that since 2000, small-caps have beaten their rival large-cap indices by an average of 6.7 percentage points a year.

That’s an astonishingly wide gap.

That’s the potential reward you can get by allocating part of your portfolio from large caps and into emerging small-cap stocks.

The Small-Cap Facts of Life

Those 6.7 percentage points of outperformance reflect a few ‘facts of life’ for the small-cap investor.

These facts of life include higher short-term volatility, poorer liquidity, and more risk.

Those facts can be like kryptonite to generally conservative fund managers.

That explains why my old boss on the equity desk in London told me not to bother researching small-cap stocks for my institutional clients.

But if you’re happy to ride out short-term bumps, and you choose your entry price sensibly, there are fantastic growth opportunities out there just waiting for you to scoop them up.

Don’t get me wrong, I’m not recommending that you run to your broker, sell all your blue chips and replace them with a basket of penny stocks.

Any type of small-cap investing is risky. But what I am saying is that patient investors who know a good business when they see one have the chance to improve their returns in small-caps.

The weight of history supports that theme no matter what time period or geography you choose. But there’s particularly good news here for Aussie investors.

If you choose the time period ’2014′ and geography ‘Australia’, you’ll find a rich vein of small-cap opportunities.

They come from sectors as diverse as high technology, financials, healthcare, biotech…and surprisingly enough, mining.

In fact, my colleague Jason Stevenson has done some fantastic analysis identifying what he says are three of the best value stocks on the Aussie market. You can check out his research here

Tim Dohrmann
Small-Cap Analyst, Australian Small-Cap Investigator

Join Money Morning on Google+


By MoneyMorning.com.au

Why the Recent Lift in Junior Miners Will Likely Continue

By MoneyMorning.com.au

Junior venture companies in Canada are finally seeing a significant lift.

In early January, the S&P/TSX Venture Composite Index rose above the 200-day moving average for the first time in three years. The index is also very close to experiencing a golden cross, which is when the shorter-term 50-day moving average crosses above the 200-day moving average. Historically, traders see this cross as extremely bullish.

You can see on the chart that there have been few occurrences of golden crosses over the past five years, with one in 2009 and another in 2011. Following these crosses, the index saw a spectacular increase.

The Canadian venture index holds 372 micro-capitalisation securities that trade on the S&P/TSX exchange. It’s a resources-heavy index, with more than 80%of the holdings in the energy and materials sector. Making up the top 10 by weight are energy companies including Africa Oil, Mart Resources, Americas PetroGas and Madalena Energy.

Materials stocks such as Atico Mining, Balmoral Resources, Chesapeake Gold, Energold Drilling, Gold Standard Ventures, Rye Patch Gold, and Santacruz Silver Mining are also constituents.

These stocks will be familiar to the shareholders of the World Precious Minerals Fund (UNWPX), as they are representative of the fund’s holdings. Historically, we’ve found that these junior mining companies outperformed their larger counterparts.

As resource investors, we’re particularly encouraged by this ‘golden cross’, but what makes us even more optimistic is further data supporting the cyclical areas of the market.

Cyclical companies in sectors such as information technology, industrial, materials, and consumer discretionary tend to sell goods and services beyond the basic needs. These are the goods and services businesses and consumers buy when times are good.

So consider the potentially major impact that increased investment spending might have on these companies. After curtailing capital expenditures following the Great Recession, businesses may be in the process of reversing that trend after a prolonged period of under-investing.

According to Bank of America Merrill Lynch’s newest fund manager survey, which involved 234 participants that manage nearly $700 billion in assets, participants are frustrated with companies that have been hoarding their cash. Comparing the latest results to survey data going back a full decade, a record 58% of participants said they wanted corporate cash to be spent on capital investment.

Another record 67% say that ‘companies are ‘under-investing,” says BofA-ML survey data.

This is the ‘most conviction since 2001,’ which likely means that the boards of public companies will find it tough to ‘ignore the massive shift’ in sentiment, says Brian Belski of BMO Capital Markets.

We’re pleased with this change of opinion, as capital investment helps propel the economy and boosts productivity and profits. Investors also see a potential boost: As companies begin spending their cash on things such as productivity-boosting software and capital equipment, businesses in technology and industrials sectors likely benefit.

Take a look at BMO’s chart below, which shows the average annual performance during these cyclical uptrends in capital expenditures. The data goes back to 1970, so it provides tremendous historical support. As you can see, information technology and industrials are among the sectors that benefited the most from capital expenditure growth. During these periods, these stocks climbed an average of about 16%.

In contrast, telecommunications and utilities have the weakest performance during the uptrends.

What’s so appealing about this chart is that these cyclical areas of the market have also been tagged in our Holmes Macro Trends Fund (ACBGX) model as relatively strong sectors. And while information technology, industrials and consumer discretionary have already performed well, we’ve identified fundamentals that suggest these areas of the market will continue rising in value.

If this increase in capital expenditures materializes, it could stress factories even further, as capacity utilisation climbs toward its long-term average. Capacity utilisation measures the extent that factories are in use, and currently, manufacturing companies are operating at 79.2% of full capacity. The average since 1980 has been 79.4%.

This rate is significantly different compared to June 2009, when the rate dropped to a record low 66.8%. It’s no surprise that manufacturing has been staging a huge comeback following the recession but the chart below illustrates the continuing rising trend since it hit bottom.

With the potential uptrend in investment spending coupled with factories cranking out goods at a faster, busier pace, chances are good we’ll see continued growth from cyclical areas of the market, especially in tech and industrials.

And if the utilisation rate keeps climbing higher, companies won’t be able to increase their output without incurring additional fixed costs to purchase new machinery or build new facilities. That’s bullish for metals and mining companies, such as many of the businesses held in the S&P/TSX Venture Composite Index.

Frank Holmes,
CEO and Chief Investment Officer, U.S. Global Investors

[U.S. Global Investors Inc., is an investment management firm specialising in gold, natural resources, emerging markets and global infrastructure opportunities around the world. The company, headquartered in San Antonio, Texas, manages 13 no-load mutual funds in the U.S. Global Investors fund family, as well as funds for international clients.]

Ed Note: The above article was originally published in Daily Resource Hunter.

Join Money Morning on Google+


By MoneyMorning.com.au

USDCAD’s upward movement extended to 1.1224

USDCAD’s upward movement from 1.0588 extended to as high as 1.1224. Initial support is at the lower line of the price channel on 4-hour chart, as long as the channel support holds, the uptrend could be expected to continue, and next target would be at 1.1350 area. Key support is at 1.1031, only break below this level will indicate that the uptrend from 1.0588 had completed at 1.1224 already, then the pair will find support around 1.1000 area.

usdcad

Provided by ForexCycle.com

Weekend Market Update by The Practical Investor


Weekend Update by thepracticalinvestor.com

January 31, 2014

— VIX tested mid-Cycle support/resistance and closed higher for the week.  This confirms the change in trend.  It is now due to break through the Triangle trendline near 20.50 and challenge the weekly Cycle Top resistance at 22.05.  Its ultimate target may be above its massive 4-year Ending Diagonal at 27.50.

SPX may threaten the lower Diagonal Trendline next week.


SPX closed solidly beneath its weekly Intermediate-term support/resistance band at 1792.58.  The next support level is the trifecta of supports, consisting of the 14-year Top trendline, weekly Long-term support and the lower Diagonal trendline, all near 1705.00 to 1715.00.  The bear market truly begins beneath that level.

(ZeroHedge)  Another volatile day ended with the Dow is down around 5% in January – the worst start to a year since 2009 (and 2nd worst since 1990) and the worst month since May 2012 (a 3-sigma miss of the average +1.5% per month gain since 2009’s lows).

Trader’s Almanac –  every down January on the S&P 500 since 1938, without exception, has preceded a new or extended bear market, a 10% correction, or a flat year. As we also noted here, The JAJO Effect

NDX careens between support and resistance.

This week NDX declined to weekly Long-term support at 3463.23, then bounced back toward weekly Short-term resistance at 3531.21, but closing beneath it.  The next decline may be much more substantial once it falls beneath the support lines.


(ZeroHedge)  Despite the best efforts of CNBC to have every bull on Amazon explain how great it really is and how they could enable to magical profit machine any minute if they so choose, the hedge fund hotel stock du jour is now down 10% and Bloomberg headlines blare:

  • *SEC Short Sale Rule 201 is in Effect : AMZN (NASDAQ)

Last night’s algo-ramp to VWAP (on rising Prime prices?) is a long-distant memory now…

(ZeroHedge)  Following December’s biggest-surge-in-4-years for UMich consumer confidence (though a miss), UMich data has fallen back to 80.4 – missing expectations by the biggest margin in 8 years.


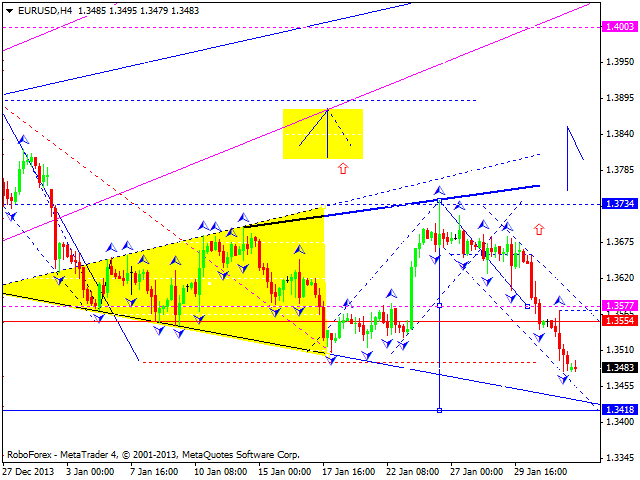
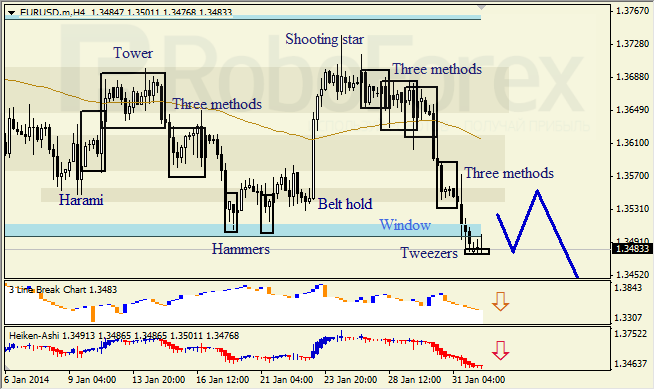
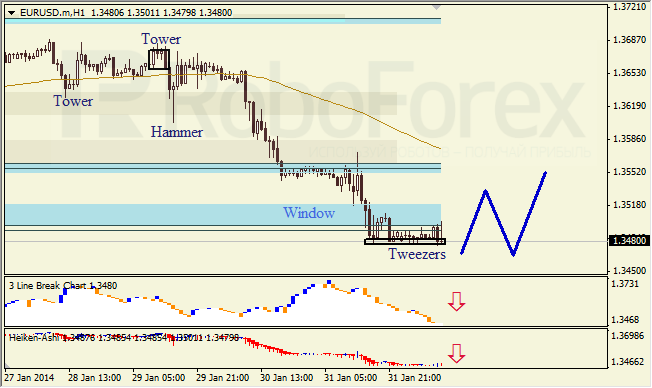
The Euro is losing its grip.

The Euro has broken down beneath its prior weekly lows of the past month, also closing beneath both weekly Short-term and Intermediate-term supports.  The weekly Long-term support at 133.51 remains unbroken, but may be due for a challenge.

(Bloomberg)  Euro-area inflation remained below half of the European Central Bank’s target in January, driven by falling energy prices, adding to the case for policy makers to cut interest rates next week.

Consumer prices rose an annual 0.7 percent after a 0.8 percent gain in December, the European Union’s statistics office in Luxembourg said today. The median estimate in a Bloomberg News survey of 41 economists was for an increase to 0.9 percent. That’s the fourth consecutive reading of less than 1 percent. The Frankfurt-based central bank aims to keep inflation at just under 2 percent.


The Yen may have completed its retracement.

The Yen may have completed its retracement bounce just under weekly Intermediate-term resistance at 98.43.  The Cycles Model suggests a reversal may occur next week. The next break of the Head & Shoulders neckline may bring it beneath its 2008 lows.


(Bloomberg)  The yen extended monthly gains against emerging-market currencies as growing volatility amid a selloff spurs investors to reverse carry trades while seeking haven assets.


The yen strengthened 0.7 percent to 102.04 per dollar at 5 p.m. in New York for a 3.1 percent monthly advance that was the biggest since April 2012. The dollar rose 0.5 percent to $1.3486 per euro, pushing monthly gains to 1.9 percent, the most since February. Japan’s currency appreciated 1.2 percent to 137.63 per euro, having strengthened 5.2 percent since Dec. 31.

U.S. Dollar is building a base to move higher.

The dollar has been building a base from which it may surge higher.  It made an important Cycle low on January 24, tagging the Triangle trendline.  The reversal from the trendline took the dollar back to challenge Long-term resistance at 81.59.  We may see a smaller consolidation occur back to the weekly mid-Cycle support at 81.03 before a strong breakout that has the potential to challenge the Cycle Top at 83.82.


(Reuters) – The euro fell on Friday as soft euro zone inflation data rekindled concerns the European Central Bank may have to act to combat deflation, while the dollar strengthened on mildly encouraging data to close out its best month since May.


The dollar index .DXY, which measures the dollar against six major currencies, rose 0.26 percent to 81.25, still helped by the prior day’s solid reading on U.S. fourth-quarter gross domestic product, which revived hopes that the global economy could, on the whole, take troubles from emerging markets in stride.

The dollar index rose 1.3 percent in January, its biggest monthly gain since May.

Treasuries continue to climb, but not for long.

Treasuries continued their “safe haven” status as the long bond advanced toward weekly Long-term resistance and a potential Trading Channel trendline at 134.66.  It is probable that this rally may continue for a week or more as hot money looks for sanctuary from declining equities.  Unfortunately, this is only a retracement rally within a bear market in bonds.

(ZeroHedge)  You didn’t think the US could at first slowly, and then all of a sudden, expropriate retirement accounts and invest them in the “no risk, guaranteed return” MyRA Ponzi scheme introduced by Obama during the State of the Union address without lots of behavior-modifying indoctrination in the “friendly press” first now did you? Sure enough, here is the first major propaganda salvo, coming from none other than the US Treasury Secretary, Jack Lew, which will be published tomorrow across the McClatchy media empire.


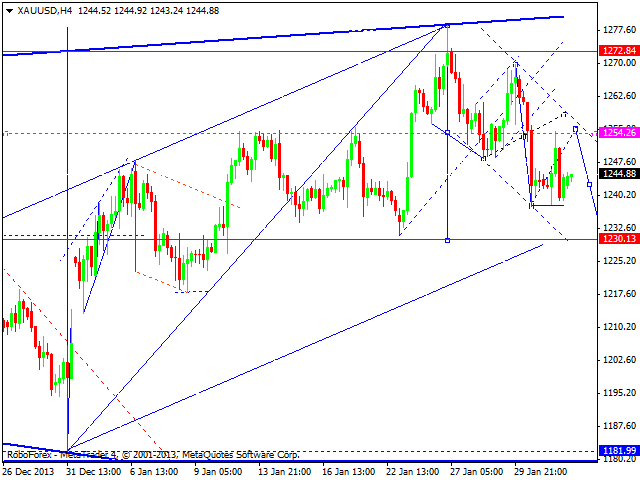
Gold retreats from its retracement high.

Gold retreated from its retracement high after challenging its Trading Channel trendline and weekly Intermediate-term support at 1262.69.  The Cycles Model calls for a month-long decline that may break through the lower trendline, or Lip of a Cup with Handle formation.  The potential consequences appear to be severe.

(FoxBusiness) Gold edged higher on Friday but was still on course for the first weekly fall in six due to strong U.S. economic growth, concerns over the U.S. Federal Reserve’s withdrawal of monetary stimulus and a slump in Chinese demand.

Bullion had gained for most of January until this week, underpinned by weakness in global equities on concerns over emerging economies.

But upbeat U.S. growth data reassured investors worried about capital outflows from emerging markets and also validated the Fed’s decision this week to reduce its monthly bond purchases to $65 billion from $75 billion, as expected.

Crude could not overcome Long-term resistance.


Crude made a substantial retracement of its decline into January 9, but could not overcome Long-Term resistance.  When rallies fail to overcome prior highs in less than 30 days, they are doomed to a more substantial reversal.  There is a Head & Shoulders formation at the base of this rally, which, if pierced, may lead to a much deeper decline.

(Reuters) – U.S. crude oil rose nearly $1 on Thursday on spread trading and higher demand as blistering cold sapped distillate supplies and government data showed solid economic growth in the fourth quarter last year.

The price difference between the European benchmark Brent and U.S. crude oil settled at its narrowest point in more than 2-1/2 months, after news that U.S. gross domestic product grew by a 3.2 percent annual rate, according to the U.S. Commerce Department.


China stock bounce weakens beneath resistance.

The bounce from the January 20 low has weakened, allowing a pullback.  However, the bounce may extend at least to its Short-term resistance at 2089.79 in the next week or so.  Once accomplished, the secular decline resumes with the next significant low in mid-March.

(ZeroHedge)  The topic of China’s real estate bubble, its ghost cities, and its emerging middle class – who now have enough money to invest and have piled into houses not stocks – and have been dubbed “fang nu” or housing slaves (a reference to the lifetime of work needed to pay off their debts); is not a new one here but, as Bloomberg reports, the latest report from economist Gan Li shows China’s households are massively exposed to an oversupplied property market.

 The Chinese have piled their savings into real estate…

The India Nifty begins its plunge…


The CNX Nifty gapped beneath both Short-term and Intermediate-term support and closed beneath them last week.  The loss of near-term support is ominous and the potential loss of Long-term support at 5964.46 could be deadly for India stocks.

(ZeroHedge)  India’s recently crowned central bank head (and predecessor of the IMF’s Nostradamal Olivier Blanchard), Raghuram Rajan, has not had it easy since taking over India’s printer: with inflation through the roof, and only so much scapegoating of gold as the root of all of India’s evils, Rajan announced an unexpected 50 bps interest rate hike two days ago in an attempt to preempt the massive EM capital flight that has roundhoused Turkey, South Africa, Hungary, Argentina and most other current account deficit emerging markets. Whether he succeeds in keeping India away from the EM maelstrom will be unveiled in the coming days, although if last summer is any indication, the INR has a long way to fall.

The Banking Index closed at its Trading Channel trendline.

BKX declined this week to its lower Trading Channel trendline and Intermediate-term support at 67.29.  A break beneath these supports would do serious damage to the uptrend.  The Cycles Model suggests a new low may be seen in a little less than three weeks.

(ZeroHedge)  It would appear the fears of a global bank run are spreading. From HSBC’s limiting large cash withdrawals (for your own good) to Lloyds ATMs going down, Bloomberg reports that ‘My Bank’ – one of Russia’s top 200 lenders by assets – has introduced a complete ban on cash withdrawals until next week. While the Ruble has been losing ground rapidly recently, we suspect few have been expecting bank runs in Russia. Russia sovereign CDS had recently weakned to 4-month wides at 192bps.

(ZeroHedge)  The biggest problem facing European banks – one we highlighted most recently yesterday when we showed the latest 20% surge in Spanish Banco Popular Non-Performing Loans to a fresh record – and one we have been covering since 2010, which as of 2012 amounted to some $4.5 trillion that needs to be “remedied” – is the staggering amount of bad debt on the books of Europe’s numerous banks, the bulk of which especially in the periphery are cojoined with their sovereign host in an unbreakable bond which despite Europe’s theatrical attempts to sever, only keeps getting stronger.

(ZeroHedge)  A classical economist… and Harvard professor… preaching to the world that one’s money is not safe in the US banking system due to Ben Bernanke’s actions? And putting his withdrawal slip where his mouth is and pulling $1 million out of Bank America? Say it isn’t so…

From Terry Burnham, former Harvard economics professor, author of“Mean Genes” and “Mean Markets and Lizard Brains,” provocative poster on this page and long-time critic of the Federal Reserve, argues that the Fed’s efforts to strengthen America’s banks have perversely weakened them. First posted in PBS.

Is your money safe at the bank? An economist says ‘no’ and withdraws his

“Last week I had over $1,000,000 in a checking account at Bank of America. Next week, I will have $10,000.”

(CNNMoney)  When is default a good thing?

That’s the question being asked in China, where the murky rescue of a high-yield fund appears to have prevented a default that would have cost investors millions and undermined faith in the country’s financial system.

But the 11th hour bailout by a mysterious third party has raised questions about China’s readiness to let investors pay the price for failed investments and mounting risk in the country’s shadow banking system.


Have a great week!


Tony Cherniawski


Disclaimer: Nothing in this email should be construed as a personal recommendation to buy, hold or sell short any security.  The Practical Investor, LLC (TPI) may provide a status report of certain indexes or their proxies using a proprietary model.  At no time shall a reader be justified in inferring that personal investment advice is intended.  Investing carries certain risks of losses and leveraged products and futures may be especially volatile.  Information provided by TPI is expressed in good faith, but is not guaranteed.  A perfect market service does not exist.  Long-term success in the market demands recognition that error and uncertainty are a part of any effort to assess the probable outcome of any given investment.  Please consult your financial advisor to explain all risks before making any investment decision.  It is not possible to invest in any index.


The use of web-linked articles is meant to be informational in nature.  It is not intended as an endorsement of their content and does not necessarily reflect the opinion of Anthony M. Cherniawski or The Practical Investor, LLC.


P.O. Box 129  Holt, MI  48842  (517) 699-1554  Fax: (517) 699-1558

Email: [email protected]