By www.CentralBankNews.info The Czech Republic’s central bank left its benchmark two-week repo rate steady at 0.05 percent, as expected by financial markets, and will comment on its decision later.
At its previous meeting in March, the Czech National Bank (CNB) said rates would remain at their current level over a longer horizon until inflation pressures increase significantly.
Inflation in the Czech Republic was steady at 1.7 percent in March from February, below the central bank’s target of 2.0 percent, plus/minus one percentage point.
The CNB also said it was ready to use foreign exchange intervention if further monetary policy easing becomes necessary, a remark that sparked speculation in markets that the CNB’s board would discuss a possible sale of koruna at today’s meeting.
The Czech Gross Domestic Product declined by 0.2 percent in the fourth quarter of 2012, it’s sixth quarterly contraction in a row, for an annual fall of 1.7 percent, up from a decline of 1.5 percent in the third quarter. For the full 2012 year, the economy shrank by 1.2 percent.
The CNB cut its rate by 70 basis in 2012 to technically zero and has held it steady this year. Today it also left the discount rate steady at 0.05 percent and the Lombard rate at 0.25 percent.
Is Windstream the Next Dividend Death Trap?
As the saying goes, once you hit the top, there’s nowhere to go but down.
And that’s especially true for companies making it to the list of the top five highest-yielding stocks in the S&P 500.
Consider: Over the last year or so, Frontier Communications (FTR), RadioShack (RSH) and CenturyLink (CTL) all spent time on the list. And, lo and behold, their dividends got slashed and share prices cratered.
Pitney Bowes (PBI) is the latest company to join the ranks of these dividend disappointers.
On Tuesday, management announced that first-quarter earnings sank 57%, and they were cutting the dividend in half – from $0.375 per quarter to $0.1875.
As Chief Executive, Marc Lautenbach, said, “This action will provide us the added financial flexibility to invest in the business and enhance our capital structure, while continuing to provide a very competitive return to shareholders.”
Sure. Good luck keeping shareholders, Marc! (By the way, share prices already plummeted more than 15% on the news.)
That’s the thing about chasing yield. The downside risk far outweighs the additional income you might receive.
I mean, is the potential for a 9% yield in Pitney – which the company sported at the end of last week – worth suffering a 15% loss of principal this week?
I didn’t think so.
But for some investors, the temptation of double-digit yields is too hard to resist. And that’s exactly why I’m writing to you today…
The Kiss of Death for Dividend Stocks
For the record, I warned investors about Pitney before – along with the other three stocks above. (See here, here, here and here.)
Yet I’m sure some of you ignored those warnings. Again, double-digit yields are tough to pass up, especially in our current income-starved environment.
But today, I’m issuing another warning to never buy any of the top highest-yielding stocks in the S&P 500 Index.
No matter how desperate for yield you become.
You see, companies never make it onto the list because of their overly generous dividend increases. Instead, their sky-high yields come as a result of struggling underlying businesses and, in turn, floundering stock prices.
If you have any doubt, take a look at the current crop of top-yielders.

Every last one is operating a business that’s facing some serious headwinds, if not complete obsolescence. (I’m looking at you, Garmin (GRMN).)
Heck, two previous dividend cutters are still on the list, indicating that their share prices continue to take a pounding.
The most dangerous stock of them all, though, appears to be Windstream (WIN).
It sports an unbelievably high trailing 12-month dividend payout ratio, according to Morningstar. Simply put, that means it’s paying out way more money in dividends than it’s earning. And that’s just not sustainable.
Bottom line: Earning a spot on the list of top five highest-yielding stocks in the S&P 500 Index isn’t a call to action for income-starved investors. It’s the kiss of death. Trust me, in this case, abstinence is the best policy.
Before you sign off, though, feel free to share your horror stories with any of the stocks above by emailing them to [email protected]. Sometimes talking about it is the best medicine for the pain.
Just saying.
Ahead of the tape,
Louis Basenese
Article By WallStreetDaily.com
Original Article: Is Windstream the Next Dividend Death Trap?
Gold’s in an Uptrend, but for How Long?
On the 18th of April, I wrote to you in Money Morning about the huge sell-off in gold. I said that:
‘A collapse like the one we’ve seen will bring a lot of latent demand to the fore. In fact my expectations are that we’ll see a vicious bounce in the gold price, sooner rather than later.
‘I think it’s a bit like jumping on an inflated ball in the pool. The further you push it down the quicker it will whip back in your face.’
Fast forward two weeks and the gold price has bounced over US$150 from the intraday lows near US$1,320. That’s a 10% bounce in the price of gold in a couple of weeks.
The latent demand that I was talking about did come out of the woodwork and there was plenty of anecdotal evidence from dealers that physical gold demand went through the roof. The Perth Mint has even been staying open over the weekend to refine gold in order to fill a huge backlog of orders.
If you bought when I suggested a couple of weeks ago then now would be a good time to take a bit of money off the table here, because there is nothing saying that gold is completely out of trouble yet…
The next hurdle for gold to overcome is the US$1,530–1,550 area where gold initially broke down from in April. A major support level will often become stiff resistance once it is broken so I could imagine gold will have a tough time getting above that level in the short term.
Gold Price Daily Chart

Click to enlargeIf we step back and look at the price action purely from a technical perspective we can see that gold is in short term uptrend, but intermediate (10 day moving average below the 35 day moving average) and long term downtrend (35 day moving average below the 200 day moving average).
Don’t Discount this Possibility
It’s very aggressive to be getting overly bullish just because the short term trend is now up. If the short term trend shifts back down (i.e. the price is below the 10 day exponential moving average according to my rules) then all trends will be pointing down and you could expect to see lower prices in the short term.
If I had to hazard a guess where I thought gold could go from here I would say that we could see a continued rally to the overhead resistance at US$1,530–1,550 which then stalls and leads to another bout of selling pressure. How far gold falls on the next leg down is anyone’s guess of course but we can’t discount the possibility that it could fall all the way back to the recent lows of US$1,320.
If we saw a false break of the lows down there then you would definitely be backing up the truck and buying all the physical gold you could get your hands on.
I’m not sure we’ll be lucky enough to see that occur but you never know. It’s more likely that any sell-off from the major resistance will fall far enough to shake out any traders who entered gold too late in this rally, but not far enough to give a clear buy signal.
The time to start getting bullish gold for the longer term will be when the intermediate trend shifts back up and the weekly MACD indicator turns bullish. Until then you need to be pretty nimble if you’re buying gold and be sure to take some profits off the table at regular intervals.
I do quite like the look of the Australian Gold ETF [ASX: GOLD]. You’re effectively short the Aussie dollar and long gold via this ETF and I think that could be a great position to have on going forward.
Analysing the Aussie Dollar
The Australian dollar has been showing some signs of weakness in the last few weeks. It is still early days of course and the flood of money coming in from offshore is showing no real signs of letting up, but the Aussie dollar is overvalued on most measures and I think it is only a matter of time until the Aussie ends up reuniting with our weak terms of trade.
I also believe that a lot of the money that has found its way into our bonds is relatively hot in that it will look for the exits if the currency starts to nose dive. Who wants to make 3% a year on their bonds and lose 20% on the currency?
If that is the case then the very thing that has been helping to keep the Australian dollar afloat could become the fuel to ignite a sharp fall.
Aussie Dollar Daily Price Chart

Click to enlargeI looked at the Australian dollar last week, so wade through your past emails if you want to have a more detailed view of the Aussie. The main point I want to make today is that the Aussie is still stuck in a range so it is too early to make any big sweeping statements about what comes next, but the last line of support near US$1.015 is important to keep your eyes on.
If that support level gives way then there is not much support below it. You could see the Aussie diving towards US$0.98–1.00 pretty quickly. There is some very major support around parity, and I would expect it to hold for the foreseeable future, but if the 2008 high around US$0.985 can’t hold we could witness a swan dive in the Aussie dollar towards the low 90’s.
A move like that is obviously the outlier at the moment with the continued buying from offshore money hunting yield, but the charts are showing that outcome as a distinct possibility going forward.
So all up the Aussie dollar gold price could be well supported going forward. Keeping an eye on those trends in gold and waiting for the right time to strike could lead to a great long term buying opportunity.
Murray Dawes
Editor, Slipstream Trader
Ed Note: One of the oldest sayings among stock market traders is ‘the trend is your friend’. That’s true a lot of the time, but not all the time. In fact, a key part of Murray’s analysis is identifying when the trend isn’t your friend. In today’s Money Morning Premium, Kris reveals the key metric that has influenced his big call for the market in 2013. Click here to upgrade now.
From the Port Phillip Publishing Library
Special Report: TORRENT SIGNAL 3
Daily Reckoning: Why Apple’s Advantage is Gone
Money Morning: Why the Commodity ‘Supercycle’ Might Only be Halfway Done
Pursuit of Happiness: What the Government’s Latest Money Grab Means for You
The Real Reason You Should Care About Japan
Kudos to those who bought Japanese stocks. The Tokyo Stock Price Index, or Topix, is up 37% for the year and a blistering 60% since November. It was in December that Shinzo Abe came to power in Japan. He promised easy money. And the Bank of Japan delivered by promising to double the money supply. It was like waving a red cape in front of a bull. Olé!
The idea behind this spectacular rally in the one of the world’s largest stock markets is as simple as it is absurd. The impetus for the bullish charge is that printing lots of money is good for stocks.
Well, so far, it seems to be…but I wouldn’t bet on it lasting long…
I was at Grant’s Spring Investment Conference in Manhattan a couple of weeks ago. Mark Yusko, the CEO of Morgan Creek Capital Management, was there. He said Japanese stocks are a buy. Emphatically so. The argument was that a weaker yen would bring profits for exporters. And that inflation (or currency devaluation) is good for stocks.
He particularly liked the financial companies in Japan. ‘These stocks are going to go up,’ he said. ‘It’s not a question of whether they might go up, it’s not a question of whether they might do well and make profits. They’re going to go up…’
Kyle Bass, chief of Hayman Capital Management, was also there and presented right after Yusko. If Yusko was a guy waving a red cape in front of the bulls, Bass was a guy brandishing a sword.
Killing the Bull Argument on Japan
Bass, if you know anything about him, was one of those who made a fortune by predicting the subprime mortgage crisis. You may also know that he’s been predicting disaster in Japan for a few years now. Nonetheless, on quality of the arguments, I give the nod to Bass. He dispatched the Japan bull with a few thrusts of his sword.
The first thrust was to bring up Mexico in 1994 during the so-called Tequila Crisis. The Mexican government, much like Japan today, told the world what it was going to do. It was going to print a lot of money and devalue the peso.
‘In theory,’ Bass said, ‘Mexican equities should have taken off with that 60–70% currency devaluation. But what happened? In 40 days, they dropped 70%. You lost 60–70% on the currency, plus 70% on the equity… And look at how fast it happened. It happened very, very quickly. In a month’s time, things literally fell apart. You couldn’t act fast enough.’
The Japan bull thesis, already dealt a mortal blow, staggered…but Bass wasn’t finished.
Next, he took the sword to Japan’s sorry fiscal condition. Japan is insolvent, he said. Everyone knows it. The only question is how long they can hold on. He walked through some back-of-the-envelope math on what this means for Japanese bonds. On reasonable assumptions, he arrived at an 83% haircut. Ouch.
The bull was bleeding now, breathing heavily. Bass kept at him…
Yusko, and others, say a weak yen will be great for Japanese exporters. What they miss, Bass said, is that about 16% of the Japanese economy is imports. So imported goods immediately become more expensive as the yen weakens. Exports take longer to adjust.
‘Your terms of trade actually worsen at first,’ Bass said. ‘I think that’s going to be a shock to people who own equities.’ (He also used a great term I’ve not heard before — ‘macro tourists’ — to derisively refer to those who buy stocks for flimsy macro reasons but have no expertise in global markets.)
The bull was nearly spent. Bass moved in to deliver the final cut…
‘I think the average Japanese person will lose maybe a third or 40% of their purchasing power,’ he said, getting more apocalyptic as the minutes ticked away. He talked about the social risks in Japan.
‘You don’t want to be the only man standing in a place where everyone is losing 70% of their purchasing power,’ he said. The crisis in Japan would destabilize the whole region, he said, and lead to social unrest. I had visions of mobs, firebombs, tear gas, spilled miso soup…
Breakdown in Japan
The beginning of the end is already here, Bass said. It started on April 5. Japanese bond prices began to move in odd ways not seen by any living traders. The Japanese ‘swaption’ market, used to manage interest rate risks, blew out 50–100% overnight. ‘The brokers were calling us asking, ‘What’s going on?’
‘The move that we saw that Friday was the holy crap moment,’ Bass said. ‘The mindset of investors changed, ever so slightly.’
He mocked those who rely on what governments say: ‘I’ve never been in a meeting with a finance minister or prime minister where a guy says to me, ‘Yeah, you know, you’re absolutely right, we’re screwed.’ I’ve never been in one of those meetings. Period.’
In the Q&A, attendees peppered him with questions about what the world would look like after a Japanese crackup. One Bass observation that stood out for me: ‘On that day, US yields go negative.’ If Japan implodes, it could bring a flight to the dollar — just as in 2008. US interest rates would fall.
Continuing this line of thought, I would add that commodities, too, would get hit hard in dollar terms. It would probably mean gold would fall in US dollar terms, at least in the short term. Perhaps the sell-off in gold we see now is the market anticipating the day of a denouement for Japan.
Anyway, when Bass was through, our host Jim Grant ambled up to the stage to drag off the carcass of the Japan bull.
Intellectually, at least, the bullish argument on Japan was dead. It can take a while for markets to catch up to a real disaster in the making, though — which was the main subject of Bass’ talk, titled ‘The Difficulty With the Psychology of Negative Outcomes’. But it gets there eventually.
Until then… Olé!
Chris Mayer
Contributing Writer, Money Morning
From the Archives…
The Market Rebounds, but We’re Still Not Selling…
26-04-2013 – Kris Sayce
Is This the Last Hurrah for the Australian Dollar?
25-04-2013 – Murray Dawes
Here’s Proof the Silver Bullion Market is Alive and Well
24-04-2013 – Dr. Alex Cowie
Stand By for the Recession Rally in Resource Stocks: Take Two
23-04-2013 – Dr. Alex Cowie
A New Take on Hard Asset Investing
22-04-2013 – Kris Sayce
Why Errors with ‘Growth in a Time of Debt’ Could Cost Us All
There’s a Jamaican saying, ‘The higher the monkey climbs up the tree, the more his butt is exposed.’
The point being that the more we rise, the more vulnerable we become.
That has truly come to pass for a pair of superstars of the dismal science. And it could have a big impact on how successfully (or unsuccessfully) we can get the US economy back on the rails.
You rarely think about economists as celebrities. And that’s likely because most of the things they talk about aren’t subjects that beg celebrity status.
But a pair of Harvard economists has been stuck in the spotlight again, this time for all the wrong reasons.
Carmen Reinhart and Kenneth Rogoff’s 2010 paper ‘Growth in a Time of Debt’ showed that growth rates collapsed in countries whose public debt to GDP ratio rose above 90%. This enforced the notion that you can’t borrow your way out of recession; austerity had a crucial place in facing weak economic conditions.
This had huge financial and political implications, especially as the country tried to un-mire itself from a financial and economic train wreck. There was evidence that austerity was the only way to get back on track and stimulus was the road to ruination.
Then last week it was announced that there was a spreadsheet error in their research — five countries had been left out of their sample accidentally.
The oversight didn’t invalidate their conclusion, but it’s been used by stimulus proponents to claim that austerity isn’t the cure it was thought to be and to push for more state spending.
Given where that spending will lead, the Reinhart/Rogoff fat finger blunder must surely qualify as the most expensive spreadsheet error in world history.
The Price of Fame
Reinhart and Rogoff had made their names by their 2008 book This Time It’s Different, an excellent study of financial crashes through history that was superbly timed to catch the bewilderment of the political class following the 2008 crash.
This helped get their 2010 paper a receptive audience. It seemed to show a sharp dividing line at a 90% public debt to GDP ratio; if debt levels rose above that line, the average growth rate turned negative.
Unfortunately, with the extra five observations included, the negative growth rate was replaced with modest positive growth. There was still a strong correlation between high public debt levels and lousy growth, but there wasn’t a sharp dividing line at which growth disappeared altogether.
But the Reinhart/Rogoff research should not have been conclusive either way. With only 44 countries in their entire data set, only 20 of them ‘advanced’, there were nowhere near enough observations for a statistical conclusion to be valid.
And even after their error was corrected, their overall conclusion that growth declines as debt increases remains true — and is fairly obvious for those who believe in free market economics. Economies cannot be expected to put up good growth rates if they are burdened by immense loads of public sector debt.
Can You Get Out of a Debt Hole?
The two greatest debt loads that have ever been conquered were both by Britain, at about 240% of GDP twice, in 1815 after the Napoleonic Wars and in 1945 after the Second World War.
The strategies used to overcome the debts were diametrically opposite.
After 1815, the British government of Lord Liverpool cut public spending to an infinitesimal level, balancing the budget through the rapid economic growth that became the Industrial Revolution.
In 1819, over the loud objections of Nathan Meyer Rothschild, they returned to the Gold Standard, making sterling the universal transaction currency and London the world’s financial centre.
The result, after an initial double-dip recession, was a boom that grew the economy rapidly, thereby reducing the debt burden to modest levels in only a couple of decades. Middle-class savers prospered as never before.
In 1945, Britain went in the opposite direction. It did little to cut public spending, instead imposing draconian levels of tax on the populace for several decades while tolerating low interest rates and a steadily accelerating level of inflation that reached 25% in 1975.
The debt was reduced by the low interest rates and inflation, with the government basically rescuing itself at the expense of middle class savers. Growth was lousy, especially compared to other European countries.
The Reinhart/Rogoff error has been used by opponents to discredit ‘austerity’ cuts in public spending — actually there has been very little austerity, only some moderation. The EU Commission has announced that the whole austerity approach has been wrong, and Italy has formed a government committed to returning to the public spending gravy train.
What little chance there was of reining in deficits has been lost. Meanwhile, even the ECB, the last holdout against Bernankeism, is hinting that it will cut interest rates further from the current 0.75%, while the US, Japan and Britain are all committed to further money printing.
This will not end well, and its ending will be far more painful than the modest ‘austerity’ that is now being abandoned (incidentally I regard the US sequester as by far the best stroke of economic policy since the 1996 welfare reform, since it has forced genuine spending cuts to be made, albeit modest ones).
Higher spending will come, and will be financed by ever-larger doses of ‘quantitative easing’ by the world’s central banks. Thus the Reinhart/Rogoff spreadsheet error, by providing an excuse for abandoning the last vestiges of common sense, will prove hugely expensive.
Stick with the Midas Metal
As for individual investors, there’s one clear recommendation: Gold.
Don’t believe the hype about the recent gold crash, which was the result of mindless market panic abetted by massive gold-bear commentary from the media (and maybe some sneaky central bank dumping by Bernanke and his chums).
Martin Hutchinson
Contributing Editor, Money Morning
Publisher’s Note: This article originally appeared in Money Morning (USA)
Join Money Morning on Google+
From the Archives…
The Market Rebounds, but We’re Still Not Selling…
26-04-2013 – Kris Sayce
Is This the Last Hurrah for the Australian Dollar?
25-04-2013 – Murray Dawes
Here’s Proof the Silver Bullion Market is Alive and Well
24-04-2013 – Dr. Alex Cowie
Stand By for the Recession Rally in Resource Stocks: Take Two
23-04-2013 – Dr. Alex Cowie
A New Take on Hard Asset Investing
22-04-2013 – Kris Sayce
USDJPY continues its sideways movement
USDJPY continues its sideways movement in a range between 95.83 and 99.94. As long as 95.83 support holds, the price action in the range is treated as consolidation of the uptrend from 77.14 (Sep 13, 2012 low), one more rise towards 105.00 could be expected after consolidation, and a break above 99.94 could signal resumption of the uptrend. On the downside, a breakdown below 95.83 support will indicate that the uptrend from 77.14 had completed at 99.94 already, then pullback to 90.00 area could be seen to follow.
Forex: Australian Dollar falls vs Japanese Yen, AUDJPY under 100
By CountingPips.com
AUD/JPY off multi-year highs of mid-April
The Australian dollar declined today against the Japanese yen in forex trading for a second consecutive day and trades at a major level crossroads. The AUD/JPY currency pair closed the day right at the major level of 100 yen per aussie after opening the day just over the 101 yen per aussie level.
The Aussie had reached a multiyear high versus the yen in April after the Bank of Japan stated their monetary easing policy would be thoroughly implemented, bringing the yen crashing down against other currencies that soared to new highs. The AUD/JPY touched a high of 105.40 on April 11th but has steadily faltered from there to the current 100 exchange level.
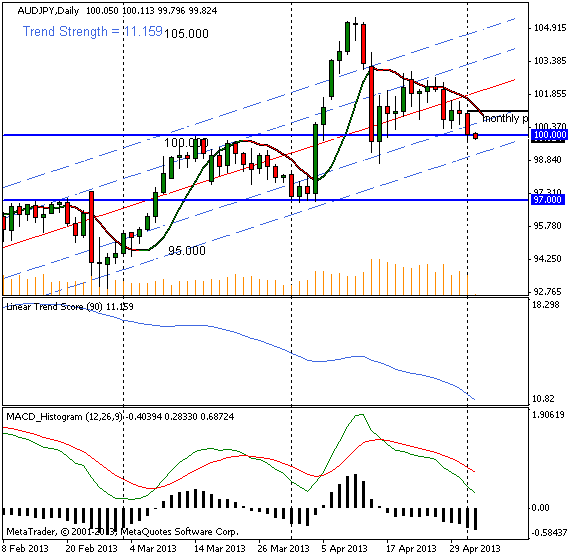
Will falling under the 100 level end the uptrend for the AUDJPY?
The 100 level has previously been a major support and resistance level in trading the AUD/JPY pair as this threshold provided support in April and resistance in March. If prices can keep above this level, further bullish momentum would be possible into 101.50 with 102.50/65 lurking higher on the resistance ladder. Downside action would present the April 16th low near 98.70 as well as 98.50 and then another major previous support and resistance level at 97.00.
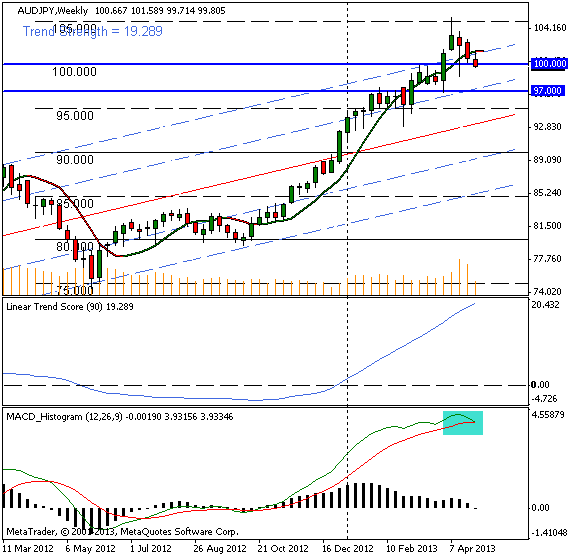
AUD/JPY Weekly Chart: MACD turning over
On the higher time frame, the MACD indicator (bottom window – green box highlighted) shows a crossover taking place on the weekly horizon that has held intact since the middle of October 2012. Of course, like with all indicators, this does not guarantee a downtrend is imminent as we could always reverse or trade sideways for a while but it does give some food for thought.
AUD/JPY Changes & Ranges: Past 6 Weeks
| week date | pct change | true range |
| 2013.03.24 | -1.27 | 1.849 |
| 2013.03.31 | +4.49 | 5.457 |
| 2013.04.07 | -0.34 | 3.747 |
| 2013.04.14 | +0.99 | 4.288 |
| 2013.04.21 | -2.17 | 2.542 |
| *2013.04.28 | -0.86 | 1.925 |
* so far this week at time of writing
Pivots and Trends Data:
Weekly Pivot Point: 101.24
Monthly Pivot Point: 101.03
Linear Regression Indicator Trend / Strength Data:
30-day current trend is BULLISH / Trend strength of 312.0 pips
60-day current trend is BULLISH / Trend strength of 756.1 pips
90-day current trend is BULLISH / Trend strength of 879.5 pips
180-day current trend is BULLISH / Trend strength of 2384.9 pips
365-day current trend is BULLISH / Trend strength of 1995.2 pips
Article by CountingPips Blog, News & Forex Analysis
Euro gains in Forex Trade vs USD, EUR/USD hits highest level since February 25th
By CountingPips.com
EUR/USD finishes April higher after decline in February and March
The European common currency has started the month of May off with gains to follow up on a positive April in the foreign exchange market trade. The euro rose higher today against the US dollar to touch its highest level since February 25th and has advanced each day so far this week.
The EUR/USD peaked in early trading at a high of 1.3241 before giving back most of those gains later on but managed to end the day with a modest increase. The high of 1.3241 marked the best level for the euro since February 25th when the euro was in the midst of a two month downswing that encompassed February and March after rallying in January. Amazingly, the EUR/USD is trading currently (approximately 1.3180 at time of writing) very close to the same level that it began 2013 at (1.3204).
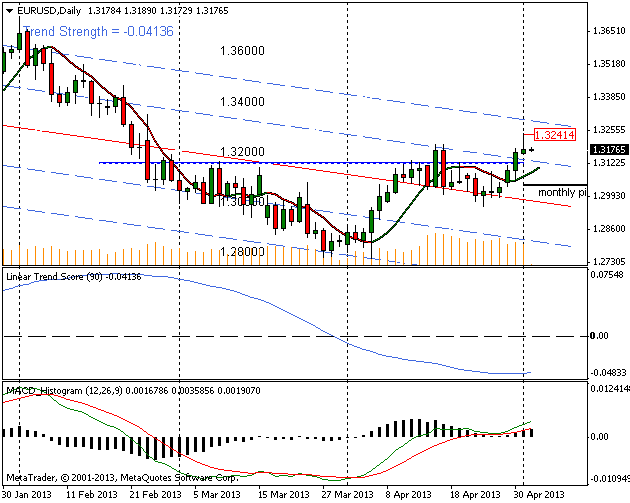
Will the Euro be able to scale 1.3200 post ECB meeting?
While the euro has been on the uptick for the first half of the week, the test will be seen on Thursday when the European Central Bank concludes its monetary policy meeting and decides whether or not to cut its benchmark interest rate (currently at 0.75%). A rate cut may very well add pressure and weight to the euro but some market watchers feel that a rate cut has already been priced into the exchange rate. Either way, it will be worth watching to see if the EUR/USD can get back over 1.3200 level or if the pair quickly fades lower and has reached a top for the week.
Support & Resistance Levels: 1.3200, 1.3100/25, 1.3000
Looking for likely and major support and resistance levels brings out the obvious 1.3200 level which the pair failed to close above today. Further potential upside targets include 1.3260/85 and then 1.3300. On the downside, we run into 1.3125 which was a past resistance level then the major round numbers below at 1.3100 and 1.3000 are likely targets.
EUR/USD Changes & Ranges: Past 6 Weeks
| week date | pct change | true range |
| 2013.03.24 | -1.9 | 0.0297 |
| 2013.03.31 | +1.62 | 0.0295 |
| 2013.04.07 | +0.68 | 0.0170 |
| 2013.04.14 | -0.01 | 0.0200 |
| 2013.04.21 | -0.21 | 0.0140 |
| *2013.04.28 | +1 | 0.0200 |
* so far this week as of time of writing
Pivots and Trends Data:
Weekly Pivot Point: 1.3031
Monthly Pivot Point: 1.3036
Linear Regression Indicator Trend / Strength Data:
30-day current trend is BULLISH / Trend strength of 309.9 pips
60-day current trend is BEARISH / Trend strength of -20.7 pips
90-day current trend is BEARISH / Trend strength of -545.4 pips
180-day current trend is BULLISH / Trend strength of 165.3 pips
365-day current trend is BULLISH / Trend strength of 388.6 pips
Article by CountingPips Forex Blog & Analysis
Adam Hewison’s Financial Market Charts, Trade Triangles & Afternoon Update
Try MarketClub for 30 Days for just $8.95 – Click Here!
Federal Reserve maintains QE, may raise or cut amount
By www.CentralBankNews.info The Federal Reserve, the U.S. central bank, maintained its goal of buying long-term Treasury bonds and housing-related debt worth $85 billion a month along with its target for the federal funds rate at 0-0.25 percent, as expected, saying it “continues to see downside risks to the economic outlook.”
While the Federal Reserve’s policy-making body, the Federal Open Market Committee (FOMC) largely repeated its statement from March, it added today that it may either increase or decrease the amount of bonds it will be purchasing, depending of the state of the U.S. jobs market and inflation.
“The Committee is prepared to increase or reduce the pace of its purchases to maintain appropriate policy accommodation as the outlook for the labor market or inflation changes,” the FOMC said.