Sizemore Capital’s 2012 Year End Letter to Investors

By The Sizemore Letter

The following is an excerpt from Sizemore Capital’s Letter to Investors.  The full PDF version can be downloaded here.

You can breathe now.  2012 has passed, and the world didn’t end.  And in fact, 2012 proved to be an excellent year for Sizemore Capital investors.  I am proud to announce that all of our model portfolios ended the year positive, and three of the four matched or outperformed the S&P 500. In another year dominated by political risk and policy-driven “risk on / risk off” volatility, that is something to celebrate.

Our newly-launched Dividend Growth Portfolio (started in March) performed as expected, returning 5.3% vs. 1.6% for the S&P 500 over the same period.  And this brings me to an important point about 2012: virtually all of the returns for most investors happened in the first quarter.  Stripping out the monster run that U.S. stocks enjoyed from January to March of last year, the major stock market averages barely broke even.

Investors should take heed of this fact, because history may be repeating itself in 2013.  Optimism over the Fiscal Cliff resolution lit a fire under the world’s equity markets in the first day of trading in January.  But unfortunately, we still have a long year of political wrangling in front of us, with all of the uncertainty and market volatility this promises.

Sizemore Capital continues to take an “income first” approach in this environment.  I expect to see the market rise in 2013, but I also expect it to be choppy and trendless for long stretches of time.  And in a sideways market, you can only make money in one of two ways: 1). Generating current income from dividends and interest, or 2). Actively trading, buying low and selling high.  I intend to employ both strategies in 2013, but I consider income to be the more reliable of the two.

Sizemore Capital takes an international approach to investing, and this was a mixed bag for us in 2012.  I proved to be too early in aggressively buying Europe in the first and second quarters of the year.  This hurt Sizemore Capital’s portfolio returns in the first half of the year, though it contributed to their strong performance in the second half of the year, particularly for the Sizemore Investment Letter Portfolio.

At time of writing, I continue to believe that the best values in the world at current prices are in European blue chips with strong business exposure to emerging market consumers and in emerging market equities themselves.  I consider these areas to be the proverbial “low-hanging fruit,” and these will likely be a focus for Sizemore Capital through at least the first quarter of 2013.

Finally, I have an announcement to make.  After winning the InvestorPlace Best Stocks contest in 2011 with my selection of Visa Inc (NYSE:$V), I was runner up in the 2012 contest with a 37% return in my selection of Turkcell (NYSE: $TKC).  I was actually in the lead for much of December and even held the lead into the final hour of trading on December 31.  Alas, TheStreet.com’s Philip VanDoorn came from behind to beat me in the closing minutes with a late surge in the price of his selection, CapitalOne (NYSE:$COF).  CapitalOne finished the year with a 38% return. My congratulations to Philip on an excellent investment choice, and I look forward to the rematch.

My selection for the 2013 contest is Mercedes-Benz maker Daimler AG (OTC:DDAIF).  Turkcell and Daimler are both current holdings of the Sizemore Investment Letter Portfolio, and Visa was formerly a holding.

Looking forward to another great year,

Charles Lewis Sizemore, CFA

The post Sizemore Capital’s 2012 Year End Letter to Investors appeared first on Sizemore Insights.
Central Bank News Link List – Jan. 3, 2013: Egyptian pound weakens to record after 3rd central bank auction

By www.CentralBankNews.info

Here’s today’s Central Bank News link list, click through if you missed the previous link list. The list comprises news about central banks that is not covered by Central Bank News. The list is updated during the day with the latest developments so readers don’t miss any important newsg)

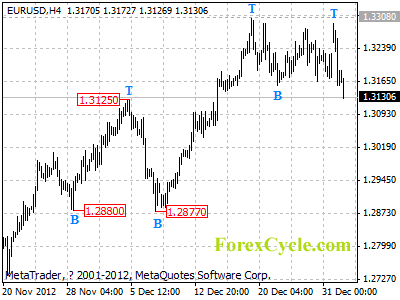
EURUSD remains in uptrend from 1.2661

EURUSD remains in uptrend from 1.2661, the fall from 1.3308 is likely consolidation of the uptrend. Deeper decline would likely be seen, and the target would be at 1.3100 area. Key resistance is at 1.3308, above this level will suggest that the uptrend has resumed, then further rise towards 1.3500 could be seen. Key support is at 1.3000, only break below this level could indicate that lengthier consolidation of the longer term uptrend from 1.2042 is underway, then further decline to 1.2800 area could be expected.

eurusd

Daily Forex Analysis

We Got it Wrong With Dividend Stocks…and Investors Still Made Money

By MoneyMorning.com.au

dividend stocks

Fiscal Cliff, Schmiscal Cliff.

If you ask us, it’s all a load of hooey.

To the extent that we won’t even bother talking about it. But if you’re interested, check out John Stepek’s column in today’s other Money Morning article from the UK.

Off the top of our head, it has probably been two years since we advised you to forget about the central planning goons.

The Fiscal Cliff is just another marketing exercise by the central planners. It’s the latest in a long line of self-inflicted problems designed to show how important the central planners think they are.

Once they’ve self-harmed, they then claim they know the cure. But before long, the next self-inflicted wound appears.

We don’t know about you, but we’re sick of it. But here’s something we’re not sick of…punting on stocks

Not many people will admit it when they’re wrong these days. But it’s something we’re more than happy to do. Why? Because we know we’re not omnipotent…we aren’t all-knowing.

All we can do is make our best guess on things and hope we’re right.

At the end of 2011 we made a bold prediction. We bet that the stock market would be volatile…that it would go up and down, but that by the end of the year it would be no higher – or lower – than it was at the start of the year.

How did we go with that prediction? This picture tells the story:

XJO

Source: CMC Markets Stockbroking


As recently as November things were looking pretty good. Yes the stock market was up, but it had turned south, and just a 5% drop from there would make the market square for the year.

But before we knew it – whoosh – the stock market took off and went 5%…and then another 5% the other way. In 2012, Aussie stocks gained 15%.

As a stock investor, that’s great news. We don’t mind getting something wrong if it means stock prices go up.

However, things haven’t been that simple. As you’re probably aware, we specialise in a certain type of stock. The type of stock risk-averse blue-chip investors wouldn’t dream of touching. We’re talking about small-cap stocks.

We Told You to Buy Dividend Stocks…But for the Wrong Reason

What we’d love to tell you is that small-cap stocks have had a great year too. We’d love to tell you that small-cap stocks beat blue-chip stocks hands down.

But we can’t tell you that. As the following chart shows, while blue-chips went vertical from November onwards, small-caps went vertical too…only in the wrong direction:

XEC

Source: CMC Markets Stockbroking


Normally, when stocks take off, it’s the smallest and riskiest stocks that take off first.

That didn’t happen this year. Why? The only explanation that makes sense to us is that as the meddling central planners at the Reserve Bank of Australia (RBA) cut interest rates – which cut the interest rate on savings accounts – investors switched from relatively safe cash, to relatively less safe dividend paying stocks.

The big beneficiaries of this move have been the big banks: ANZ Bank [ASX: ANZ], Commonwealth Bank [ASX: CBA], and Westpac [ASX: WBC]. And other big dividend payers like Telstra [ASX: TLS] have done just as well.

Now, we can’t claim we saw these capital gains coming (Telstra gained more than 30% in 2012, and Commonwealth Bank gained more than 20%), because we didn’t. But we did strongly suggest you have a big chunk of your savings (your ‘safe money’) in dividend paying stocks.

Our bet was that dividend payers would give you a steady income stream while stock prices went nowhere. Turns out – if you followed our advice – you got a steady stream of dividends and capital growth.

One Thing Won’t Change in 2013

But don’t get too carried away. We’re still not convinced the stock market is in the middle of a multi-year bull market run. The dividends will still likely flow, but is it reasonable to expect 20% and 30% gains for lumbering blue-chip stocks?

As we say, we’re not convinced.

So we’re making a new bet…hopefully we’ll get this one right. Our new bet is that after seeing big stocks gain, this should give investors and punters more confidence in stocks.

As investors and punters gain confidence, they will be more likely to look for stocks that offer the chance of even bigger returns.

In some ways this is a human reaction rather than a stock reaction. Frustrated at missing out on the recent gains, many investors and punters will try to make up for the missed opportunity. That means taking bigger risks…and for big risks, nothing beats small-cap stocks.

Of course, nothing is certain…except one thing: and that is this continues to be a risk-takers market, and it’s likely to remain that way for the foreseeable future.

Cheers,
Kris

[Ed note: for our sins, your editor owns Telstra shares.]

From the Port Phillip Publishing Library

Special Report: The Fuse is Lit

Daily Reckoning:
The Great Monetary Devolution Away from the Gold Standard

Money Morning:
Australian Stocks: Still the Best Wealth Builder in Town

Pursuit of Happiness:
Gun Control: Did Obama Shed Tears for These Kids?

Australian Small-Cap Investigator:
Why Invest In Small-Cap Stocks?

Forget the Fiscal Cliff – There’s a Much Bigger Threat Out There

By MoneyMorning.com.au

fiscal cliff

Happy New Year!

Broken any of your resolutions yet? If not, well done.

If so – well, never mind. You’re in good company.

With their last-minute deal on the ‘fiscal cliff‘, US politicians have proven yet again that government promises to cut spending are about as reliable as our own annual vows to do more press-ups, eat less cake, and stick to 21 units of alcohol a week.

It seems the ‘cliff’ was more of a speed bump than the precipice that everyone had dreaded. But what does the deal mean for your money?

We’ll be Back at the Fiscal Cliff Edge
in a Couple of Months

Cast your minds back to August 2011. That summer, the US lost its AAA credit rating. Why? Because politicians couldn’t agree on what to do about the country’s huge debt pile.

Back then, the Democrats and the Republicans were squabbling over raising the federal debt ceiling above $14.5trn. The debt ceiling is a completely arbitrary legal ceiling on the amount of money the US government can borrow.

When it was first introduced, the idea was that it would act as some sort of break on government spending. Instead, it’s simply been raised every time a government has decided it wants to spend more.

On this occasion, however, the conflict was more bitter. The ceiling was raised, but only after both sides agreed to a package of automatic spending cuts that would come in from 2 January 2013 – i.e. today – unless politicians agreed on an alternative deal. On top of that, ‘temporary’ tax cuts introduced by George W Bush were also set to expire at almost the same time.

So Americans would be paying more tax, while government spending would be slashed. That promised to be a painful dose of austerity, which many believed would send the economy tumbling back into recession.

Understandably, markets were nervous about such an outcome. That’s why they’ve all shot up this morning after a deal was reached last night in the US.

But what’s the deal?

So far, the Bush-era tax cuts have been kept for everyone except Americans who earn more than $400,000 a year (or $450,000 for families). Meanwhile, the automatic budget cuts have been delayed for at least two months.

In other words, they’ve ‘kicked the can down the road’ yet again. Given that the point of all this panic was to cut spending, it’s hardly an impressive outcome. Various proposals floating around until now had looked at ways to cut between $2trn and $4trn over ten years from the national debt. As it stands, this ‘fiscal cliff’ deal will actually add $4trn to US debt over ten years.

Amusingly enough, it also means that in just two months’ time, America’s politicians will find themselves back where they were in August 2011. They’ll be squabbling over whether to raise the debt ceiling, and how to cut spending. Only this time, the national debt will be up at $16.4trn, not $14.5trn.

This is the problem. As Reuters points out, the fiscal cliff is now turning into more of a mountain range to be navigated. Once the February deadline is passed, there are other deadlines in March. And at each of these turning points, Republicans will be calling for spending cuts, and Democrats will be looking for tax hikes.

It’s not quite as bad as the rolling crises we’ve seen in the eurozone over the past few years, but there’s more than enough potential drama to keep markets on their toes over the coming months. That means you can expect plenty of noise and artificial panic and headline-grabbing on this topic between now and March at least.

Forget the Day-to-Day Drama –
the End-Game is Inflation

As an investor, you need to take a step back from all this. What have we learned from Europe, or even the UK’s own attempts to cut? It’s that when push comes to shove, politicians would rather not take the hard choices.

The path of least resistance is the inflationary path. That means loose monetary policy – which we already have almost everywhere – and loose fiscal policy, where possible. Like everywhere else, the US would much rather inflate its way out of trouble, rather than repay its debts or live more within its means.

So you can expect deals to be reached every time the politicians meet up. Even if it means the fiscal cliff face just keeps being shunted further off into the future.

John Stepek
Editor, MoneyWeek

Publisher’s Note: This is an edited version of an article that originally appeared in MoneyWeek

From the Archives…

Why Small-Cap Stocks Could Be Your Best Investment in 2013
14-12-2012 – Kris Sayce

How the Global Oil Grab Affects You…
13-12-2012 – Byron King

The Price of Risk in the Stock Market
12-12-2012 – Murray Dawes

Why Silver Could Be the Best Investment in 2013
11-12-2012 – Dr. Alex Cowie

The Long, Drawn Out Retreat in Australian House Prices
10-12-2012 – Dr. Alex Cowie

The Fiscal Pop-N-Drop for Equities – Look Out

By Chris Vermeulen – thegoldandoilguy.com

Today’s gap higher in stocks has many investors feeling really good about but will this rally last?

My to the point answer is “Yes” but there will be some bumps and navigating positions along the way.

Looking at the charts below you will notice how stocks are trading up over 4% in two trading sessions and several indicators and technical resistance levels are now being tested. Naturally when several resistance levels across multiple time frames, cycles and indicators we must be open to the idea that stocks could pause or pullback for a few days before continuing higher.

Here is a quick snapshot of charts I follow closely to help determine short term overbought and oversold market conditions.

Momentum Extremes:

This chart helps me know when stocks are overbought or oversold. This trend can be follows using the 30 or 60 minute charts helping you spot short term tops and bottoms.

BroadMarketMomentum1

Stocks Trading Above 20 Day Moving Average:

This chart helps me time swing trades which last for 1-3 weeks in length and I use the daily chart to spot these reversals and trends.

SwingTradeOverbought2


Daily SP500 Index Chart:

This chart shows the big gap in price, test of upper bollingerband, momentum and swing trading cycles topping and 12 buyers to ever one seller on the NYSE which tells me everyone is running to buy everything they can today and that is a contrarian signal.

IndexChart3


Trading Conclusion:

This strong bounce which started on Monday from a very oversold market condition does look as though it has some power behind it. And over the next 1-3 days we could see prices grind higher until this momentum stalls out. Once that happens we should see most of the gap filled. This will provide us with a lower entry price and reduce our downside risk for index, sector and commodity ETFs.

If you are a stock trader then be sure to checkout my partners stock trading website www.ActiveTradingPartners.com where his last two trades Dec 31 pocketed 12.3% with gold stocks ETF NUGT, and took more profits with PRLB Jan 2nd for a 9.2% gain.

This type of bounce and momentum can lead to a running correction which makes it impossible for traders to by on a dip. A running correction is when prices slow chop higher in a narrow range for some time then explode higher continuing its rally. This is when you just need to jump in trades and chase prices higher but we will not do that until I see signs of a running correction.

Today many of the major market moving stocks are testing resistance which means if they start to get sold the broad market will pullback with them.

Follow All My Trades for 2013 – Start Today and Get 12 Months for only 6 Months: http://www.thegoldandoilguy.com/signup-newyear.php


Keystone XL: Welcome to the Proxy Energy War

By OilPrice.com

Now that elections are over, everyone is waiting for a decision on the Keystone XL pipeline, but it’s not so easy amid the atmosphere of protests that have even traditionally oil-friendly Texans putting up a fight.

Lawsuits, intensifying protests, conflicts of interest and the underlying notion that the pipeline is not really essential are causing the Obama administration no end of discomfort.

At stake in this atmosphere of civil disobedience is a $7 billion, 1,179-mile pipeline project that will transport Canadian tar sands to refineries in south Texas, courtesy of TransCanada. In Texas alone, the pipeline affects some 850 landowners.

TransCanada has been playing dirty, and Texans won’t have it. If there is one state in the US where the phrase ‘ eminent domain’ sparks revolutionary panic, it’s Texas. And while the pipeline protests were earlier the strict purview of ‘tree-hugging’ activists, it became a local Texas issue when TransCanada started having private land condemned by the court so it could buy it up on the cheap. So far, it has acquired 100 tracts of land in this manner, out of the 800 it has to date acquired.

One Texan has gone so far as to sue the state over its handling of the pipeline, which is supposed to cross his land. Specifically, he’s suing the Railroad Commission of Texas, which is tasked with regulating pipelines. According to the lawsuit, the Commission wrongfully granted TransCanada a permit and is failing to protect water supplies and ensure safety precautions. The landowner is also seeking an injunction and restraining order against the Commission.

On Monday, the situation took a headline-grabbing turn when two activists blockaded themselves inside a pipeline in East Texas.

In Oklahoma, things have gone a bit smoother, with construction already under way in full force.

In Nebraska, the pipeline is challenged by the environmental risk to the Sandhills region. On 4 December, a public hearing opened on the Nebraska route, which will lay the groundwork for a final decision by the state’s governor.

In Washington, though, support for Keystone XL seems to be moving along nicely, though it still does not have the final approval of the State Department, which is necessary as the pipeline crosses an international boundary.

While some politicians say the pipeline is a no-brainer, others disagree. Democrats are divided over the issue, with those in states whose economies depend on oil generally supporting the construction, while others balk. Republicans are generally united in support over Keystone XL.

Will the pipeline bring thousands of jobs? Probably—estimates range from 3,000 up to 20,000. Is it vital to US energy security? In so much as Canada is vital to US security. So, not really.

Energy security expert Michael Levi, of the Council on Foreign Relations, told Oilprice.com that the Keystone XL Pipeline is both “non-essential to US energy security” and “not disastrous to climate change.”

“It has been overblown by both sides in the debate. It is one pipeline that would carry a modest, but non-trivial amount of crude, and that would help create economic incentives to increase production, again, by a modest but not earth-shattering amount.”

From Levi’s perspective, the real issue here is trends. “I think if you replicate a pattern like the one that some would like to see for Keystone and you start blocking pipelines all over the place, then that becomes a larger economic problem.”

So welcome to the proxy war over energy.

Overall, there is a general optimism that the pipeline will go ahead, eventually. But here’s another new sticking point: the nomination for US Secretary of State, Susan Rice, who happens to hold shares in TransCanada, which is seeking State Department approval for Keystone XL.

It’s a bit of a conflict of interest that promises to get messy. Rice and her husband have stock in TransCanada valued at between $300,000 and $600,000. She also has some $1.25 million in stock in Canada’s Imperial Oil Ltd. (IMO), as well as in a handful of smaller Canadian oil companies.

Source: http://oilprice.com/Energy/Energy-General/Keystone-XL-Welcome-to-the-Proxy-Energy-War.html

By. Jen Alic of Oilprice.com – The No.1 source for oil prices


Market Trends 02.01.2013

Source: ForexYard

printprofile

Hey Everyone,

Below are some market trends for today.

Good luck!

-Dan

Gold- May see downward movement today
Support- 1673.20
Resistance- 1696.83

Silver- May see downward movement today
Support- 30.14
Resistance- 31.23

Crude Oil- May see downward movement today
Support- 91.86
Resistance-93.75

Dax 30- May see upward movement today
Support- 7682.27
Resistance- 7850.00

EUR/USD May see downward movement today
Support- 1.3180
Resistance- 1.3354

Read more forex news on our forex blog

Forex Market Analysis provided by ForexYard.

© 2006 by FxYard Ltd

Disclaimer: Trading Foreign Exchange carries a high level of risk and may not be suitable for all investors. There is a possibility that you could sustain a loss of all of your investment and therefore you should not invest money that you cannot afford to lose. You should be aware of all the risks associated with Foreign Exchange trading.

Market Review 02.01.2013

Source: ForexYard

printprofile

Following the last minute deal reached by US lawmakers to avoid the “fiscal cliff” of tax increases and budget cuts yesterday, higher-yielding assets (EUR, AUD, NZD, crude oil) all saw upward movement after markets opened for the day.

Safe-haven currencies, including the US dollar and Japanese yen, turned bearish, as investors shifted their funds to riskier assets.

Main News for Today

US ISM Manufacturing PMI- 14:00 GMT
• Analysts are forecasting the figure to come in at 50.2, which if true, would signal expansion in the US Manufacturing Sector.
• If the figure comes in above expectations, higher-yielding assets could see additional gains during afternoon trading.

Read more forex news on our forex blog

Forex Market Analysis provided by ForexYard.

© 2006 by FxYard Ltd

Disclaimer: Trading Foreign Exchange carries a high level of risk and may not be suitable for all investors. There is a possibility that you could sustain a loss of all of your investment and therefore you should not invest money that you cannot afford to lose. You should be aware of all the risks associated with Foreign Exchange trading.