Archive for Stock Market News – Page 4

This AI Co.’s Upside Potential Is Substantial, Analyst Says

Technical Analyst Clive Maund reviews Treatment.com AI Inc.’s charts to explain why he believes it is currently a Strong Buy.

Source: Clive Maund  (2/16/24)

Treatment.com AI Inc. (TRUE:CSE; TREIF:OTCMKTS) is a company that should have a very bright future as it has been pioneering the development of an AI healthcare platform using AI and advanced machine learning technologies that has the potential to revolutionize healthcare due to the streamlining of healthcare provision and the massive cost savings across the industry that should result.

The growth potential of this industry is enormous, as is made clear when you consider that the AI healthcare market, which was valued at US$11 billion in 2021, is projected to grow to US$187 billion in 2030, and with Treatment.com AI having already developed its own platform it is centrally placed to be a part of this.

The fields in which AI is set to make a big contribution are Virtual Assistance and Chatbots, Diagnosis and Treatment Planning, Streamlining Administrative Tasks, and Predictive Analytics.

Treatment.com AI’s platform is powered by its proprietary Global Library of Medicine, which incorporates AI machine learning and has been trained by hundreds of physician experts across the globe.

The company is already in partnership with the Mayo Clinic and the University of Minnesota Medical School and is in discussion with another 52 organizations.

More details on all these developments are available in the company presentation.

We will now examine a range of charts to determine exactly what is happening with Treatment.com AI stock. These charts reveal clear technical patterns that enable us to see with almost pinpoint accuracy where the stock is in its lifecycle and, therefore, what we can expect to see unfold going forward.

The upside potential from the current historically low level is very substantial, especially in percentage terms.

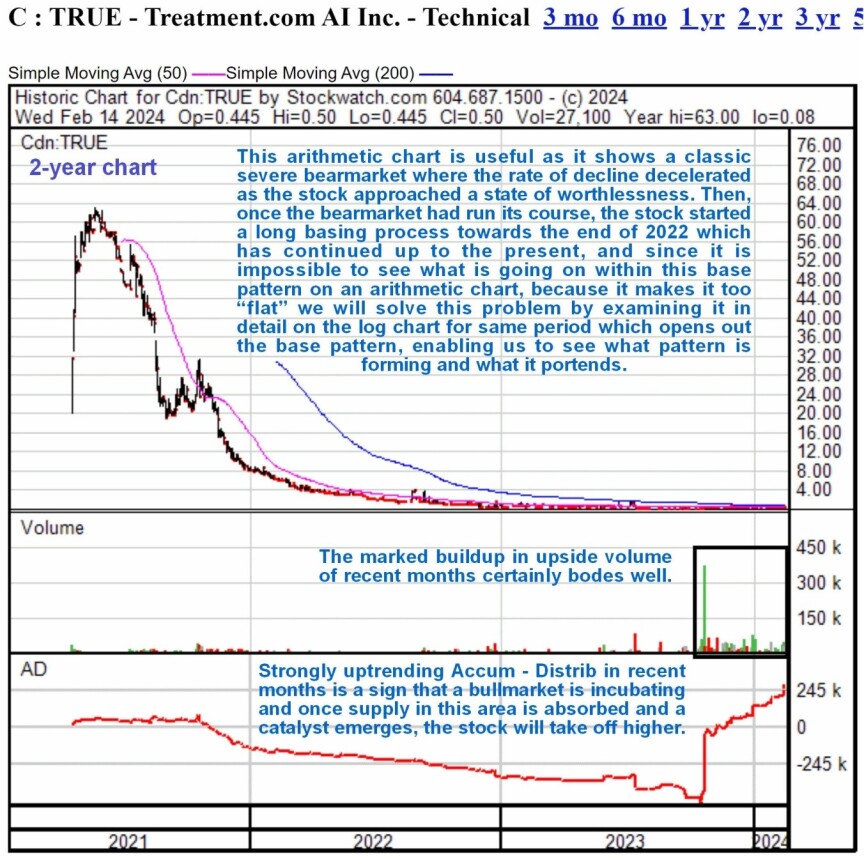
We will start with the 2-year arithmetic chart, which makes brutally clear the severity of the bear market that followed from the peak at almost CA$63 towards the middle of 2021.

This savage bear market resulted in the stock losing well over 99% of its value from that peak. The value of this chart is not just that it clearly shows this bear market in its entirety, but it also shows how the rate of decline decelerated during the second half of 2022 before it settled into a long and very low base pattern that has continued from late 2022 all through 2023 and into this year.

Beyond observing these points, this chart is of little use technically because it squashes the base pattern so flat that we can’t see what is going on within it, but we can solve that problem by means of a log chart for the same timeframe, which we will now proceed to look at, but before leaving this chart to observe how upside volume has expanded quite dramatically since mid-October which has resulted in the Accumulation line shown at the bottom of it trending steeply higher — this is a clear indication of persistent accumulation of the stock presumably by those investors who believe that the company is set to do well and that its stock will, in consequence, enter a bullmarket. These are, therefore, very bullish indications.

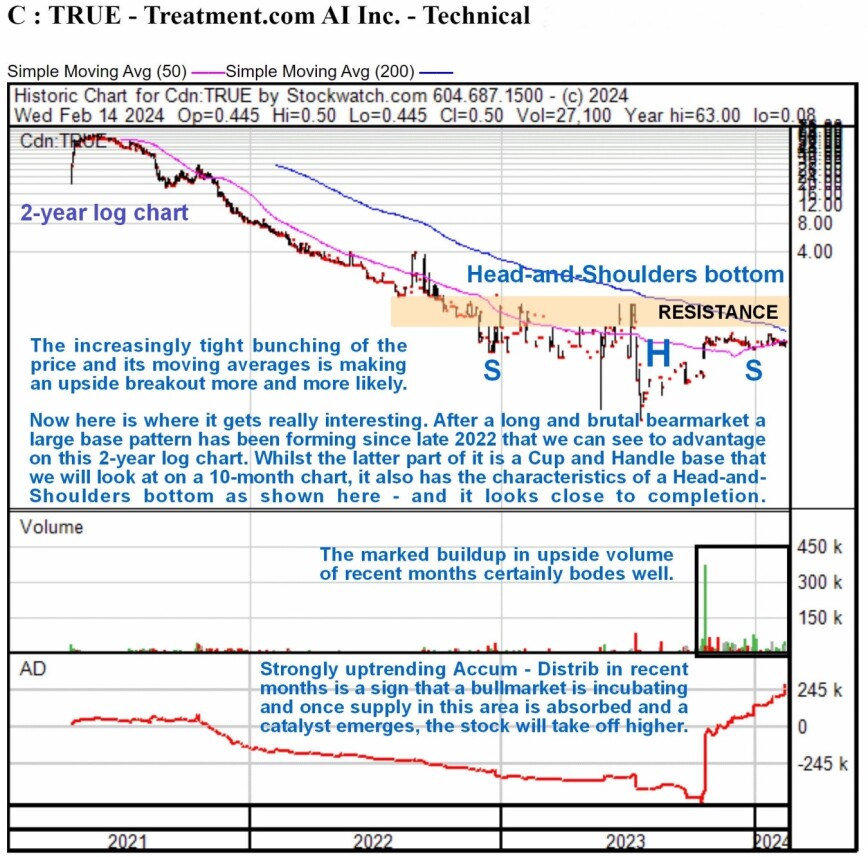
Now, we will look at the 2-year log chart, which looks dramatically different from the arithmetic chart above for the same timeframe, which is due to the fact that the base pattern still in progress has formed at a very low level. This most useful chart makes it possible for us to see exactly what has been going on.

A Head-and-Shoulders pattern has built out whose Left Shoulder formed as far back as late 2022, so 14 months ago. The Right Shoulder of the pattern has been forming for several months now and is not yet complete, but with the price and its moving averages having converged in a most potent manner, we are believed to be fast approaching an upside breakout from this base pattern, especially as the Accumulation line is so strong.

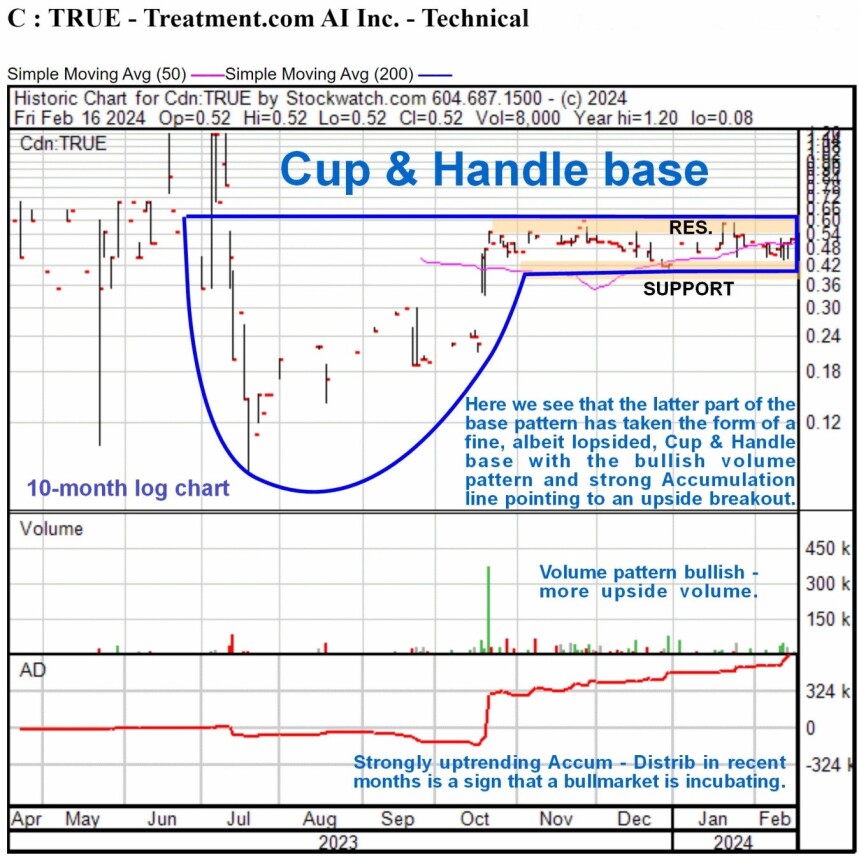
We will now move on to review recent action in much more detail on a 10-month chart where we see that, embedded within the latter part of the Head-and-Shoulders bottom, is a fine, albeit lopsided, Cup & Handle base whose most distinguishing characteristic is high volume on the rally to complete the right side of the Cup part of it, which is exactly what we saw back in October.

These kinds of hybrid patterns, where the price chart has the characteristics of different base patterns simultaneously, are not uncommon, and happily, both the patterns we see on the Treatment.com AI chart are decidedly bullish. The Handle part of this Cup & Handle base, which started to form in mid-October, has been a remarkably narrow trading range, and the good news is that we can be reasonably confident of an upside breakout before much longer, thanks to the Accumulation line trending higher throughout, due to a preponderance of upside volume.

The conclusion is, with a breakout from the base pattern looking increasingly likely soon, the stock is rated a Strong Buy for all timeframes, and the upside potential from the current historically low level is very substantial, especially in percentage terms. The number of shares in issue is a reasonable 38.5 million.

Treatment.com AI closed at CA$0.52 on February 15, 2024.


Important Disclosures:

  1. As of the date of this article, officers and/or employees of Streetwise Reports LLC (including members of their household) own securities of Treatment.com AI Inc..
  2. Author Certification and Compensation: [Clive Maund of clivemaund.com] is being compensated as an independent contractor by Street Smart, an affiliate of Streetwise Reports, for writing this article. Maund received his UK Technical Analysts’ Diploma in 1989.  The recommendations and opinions expressed in this content accurately reflect the personal, independent, and objective views of the author regarding any and all of the designated securities discussed. No part of the compensation received by the author was, is, or will be directly or indirectly related to the specific recommendations or views expressed.
  3. Statements and opinions expressed are the opinions of the author and not of Streetwise Reports, Street Smart, or their officers. The author is wholly responsible for the accuracy of the statements. Streetwise Reports requires contributing authors to disclose any shareholdings in, or economic relationships with, companies that they write about. Any disclosures from the author can be found below. Streetwise Reports relies upon the authors to accurately provide this information and Streetwise Reports has no means of verifying its accuracy.
  4.  This article does not constitute investment advice and is not a solicitation for any investment. Streetwise Reports does not render general or specific investment advice and the information on Streetwise Reports should not be considered a recommendation to buy or sell any security. Each reader is encouraged to consult with his or her personal financial adviser and perform their own comprehensive investment research. By opening this page, each reader accepts and agrees to Streetwise Reports’ terms of use and full legal disclaimer. Streetwise Reports does not endorse or recommend the business, products, services or securities of any company.

For additional disclosures, please click here.

Clivemaund.com Disclosures

The above represents the opinion and analysis of Mr. Maund, based on data available to him, at the time of writing. Mr. Maund’s opinions are his own, and are not a recommendation or an offer to buy or sell securities. As trading and investing in any financial markets may involve serious risk of loss, Mr. Maund recommends that you consult with a qualified investment advisor, one licensed by appropriate regulatory agencies in your legal jurisdiction and do your own due diligence and research when making any kind of a transaction with financial ramifications. Although a qualified and experienced stock market analyst, Clive Maund is not a Registered Securities Advisor. Therefore Mr. Maund’s opinions on the market and stocks can only be construed as a solicitation to buy and sell securities when they are subject to the prior approval and endorsement of a Registered Securities Advisor operating in accordance with the appropriate regulations in your area of jurisdiction.

Drone Co.s Revenue and Income Forecasts Climb Through 2025

Source: Dr. Ashok Kumar  (2/20/24)

Current released revenues for Red Cat Holdings Inc. show that the company is doing well in the market, noted a Think Equity research note. 

Red Cat Holdings Inc.’s (RCAT:NASDAQ) updated third quarter for 2024’s fiscal year shows that the company’s Teal 2 is doing well in the marketplace, according to Think Equity analyst Dr. Ashok Kumar in a February 20 research note. 

The company disclosed initial revenue figures for the three-month period, which ended on January 31, 2024, which represents the third fiscal quarter of 2024. Revenue for those months totaled around US$5.8 million. Additionally, the value of confirmed future orders and contracts currently stands at approximately US$5.1 million. For the following fiscal quarter, ending April 30, 2024, revenue estimates come to about US$7 million, based on current projections. Kumar noted that Red Cat is perceiving regained positive momentum after spending 12 months focused on business development and building relationships in NATO member nations and Saudi Arabia.

Finalist for Army’s Drone Program

Kumar stated that Red Cat was chosen as one of the final contenders for the U.S. Army’s Short Range Reconnaissance Tranche 2 drone program. Separately, an unspecified U.S. federal government agency placed orders with Red Cat for 344 drones amounting to around US$5.2 million total.

He also reported that Red Cat also secured a contract with U.S. Customs and Border Protection for 106 of its Teal 2 drone systems. In addition, Red Cat’s drones received Remote ID certification from the Federal Aviation Administration to operate legally in U.S. airspace.

“Teal2 sUAS is now available through the federal government’s GSA Advantage. Red Cat continues its global expansion by entering Latin America,” Kumar said.

IPO With Unusual Machines

Red Cat also shared that Unusual Machines bought two subsidiaries, Rotor Riot and Fat Shark, from the company for a total price of US$20 million. The payment was structured as US$1 million in cash upfront, a US$2 million promissory note from Unusual Machines to Red Cat promising future payment, and US$17 million worth of Unusual Machines stock, which at the current valuation equals 4,250,000 shares. After finalizing this acquisition deal, Red Cat will hold a 48.66% ownership stake in Unusual Machines based on the outstanding common shares of Unusual Machines.

Midterm Revenue and Catalysts

For the upcoming fourth quarter financial period, the projected revenue goal is US$7 million. Achieving that quarterly target would amount to an annual revenue pace of US$28 million within only nine months of introducing the Teal 2 drone system to market. Looking even further ahead to the 2025 fiscal year, current forecasts have estimated annual revenue of US$35 million based on current business performance and expected further expansion.

“We forecast total revenues to grow from US$9.9 million in fiscal 2023 to US$35.0 million in fiscal 2025. Over the same period, we expect operating income to improve from US$27 million to US$9 million,” Kumar wrote.

Kumar pointed out that some primary catalysts for the rest of 2024 will be to increase revenue, improve gross profit margins, and keep operating expenses under control. With the recent influx of capital from an initial public offering with Unusual Machines that raised US$1 million, Kumar believes that the company now has the necessary funding to work toward achieving those key objectives over the course of the next year.

With this, Kumar gave Red Cat Holdings Inc. a Buy rating with a US$5 target price. 


Important Disclosures:

  1. As of the date of this article, officers and/or employees of Streetwise Reports LLC (including members of their household) own securities of Red Cat Holdings Inc.
  2.  This article does not constitute investment advice and is not a solicitation for any investment. Streetwise Reports does not render general or specific investment advice and the information on Streetwise Reports should not be considered a recommendation to buy or sell any security. Each reader is encouraged to consult with his or her personal financial adviser and perform their own comprehensive investment research. By opening this page, each reader accepts and agrees to Streetwise Reports’ terms of use and full legal disclaimer. Streetwise Reports does not endorse or recommend the business, products, services or securities of any company.

For additional disclosures, please click here.

Disclosures for Think Equity, Red Cat Holdings Inc., February 20, 2024

Analyst Certification The analyst, Ashok Kumar, responsible for the preparation of this research report attests to the following: (1) that the views and opinions rendered in this research report reflect his or her personal views about the subject companies or issuers; and (2) that no part of the research analyst’s compensation was, is, or will be directly related to the specific recommendations or views in this research report.

Financial Interests The analyst, Ashok Kumar, has no financial interest in the debt or equity securities of the subject company of this report. Further, no member of his household has any financial interest in the securities of the subject company. Neither the analyst, nor any member of his household, is an officer, director, or advisory board member of the issuer(s) or has another significant affiliation with the issuer(s) that is the subject of this research report. The analyst has not received compensation from the subject company. The CEO of ThinkEquity, LLC., owns shares in the company. At the time of this research report, the analyst does not know, or have reason to know, of any other material conflict of interest.

Company Specific Disclosures ThinkEquity, LLC is a member of FINRA and SIPC. ThinkEquity, LLC or an affiliate has a client relationship with and has received compensation from this subject company Red Cat Holdings, Inc. in the last 12 months.

ThinkEquity, LLC ThinkEquity, LLC is a member of FINRA and SIPC. ThinkEquity expects to receive or intends to seek investment banking business from the subject company in the next three months. ThinkEquity does not make a market in the securities of the subject company of this report at the time of publication. ThinkEquity does not hold a beneficial ownership of more than 1% or more of any class of common equity securities of the subject company. This report is for information purposes only. Under no circumstances is it to be used or considered as an offer to sell, or a solicitation of an offer to buy any security. While the information contained in this report has been obtained from sources believed to be reliable, we have not independently verified the information and we do not represent or guarantee that the report is accurate or complete and it should not be relied upon as such. Any references or citations to, or excerpts from, third-party information or data sources (including, but not limited to, Bloomberg and Capital IQ) do not and are not intended to provide financial or investment advice and are not to be relied upon by anyone as providing financial or investment advice. Based on public information available to us, prices and opinions expressed in this report reflect judgments as of the date hereof and are subject to change without notice. The securities covered by or mentioned in this report involve substantial risk and should generally be purchased only by investors able to accept such risk. This research report and the securities mentioned herein, some of which may not be registered under the Securities Act of 1933, are intended only for Qualified Institutional Buyers (QIBs), as defined under Rule 144A. Any opinions expressed assume that this type of investment is suitable for the investor.

Nvidia earnings preview: Moment of truth…

By ForexTime 

  • Nvidia’s Q4 earnings in focus
  • US chipmaking giant up 40% YTD
  • High-stakes event could rock markets
  • Stock firmly bullish on D1/W1 timeframe
  • Key levels of interest at 663.17 & 752.04

Everybody is talking about Nvidia, and why not?

The poster child of the AI boom is set to announce its earnings after surpassing Alphabet last week as the third most valuable US company!

Given how the US chipmaking giant has been at the heart of the AI mania, the stakes are high with investors looking for extraordinary results that would justify the eye-popping stock gains.

Fun fact: Nvidia shares are up 40% year-to-date, adding to its 239% gain in 2023.

When will earnings be released:

  • Nvidia will report its 2023 fourth-quarter earnings after US markets close on Wednesday.

What are markets expecting?

  • The AI chip giant is expected to post earnings of $4.60 a share, and a rise in quarterly revenue to $20.4 from $6.1 billion a year ago – marking an increase of 234%!

Why is Nvidia’s earnings so important?

  • Much of the stock market rally last year was fuelled by expectations around AI and the potential impacts it could have on productivity amid its continual adoption. To put things into context, Nvidia’s AI chips are in hot demand, used for large language models including OpenAI’s ChatGPT.
  • The company’s earnings and forward guidance could serve as a major gauge for the AI mania while also confirming whether its valuations are justified.

How will Nvidia react to earnings?

  • Markets are forecasting a whooping 11% move, either Up or Down, for Nvidia stocks on Thursday post earnings.
  • Given how Nvidia shares are trading around $694.34 as of writing, this is equivalent a rally towards $770.74 or selloff to $617.94.

What does this mean for traders?

  • With a 1.7 trillion valuation, an 11% move in the price of its stock is almost $190 billion.

This is equivalent to the entire market cap of many large companies in the S&P 500, such as Intel Corp, Pfizer, and Nike. Essentially, extreme levels of volatility could be on the horizon.

  • Should Nvidia’s earnings satisfy investors’ lofty expectations along with the forward guidance, this could push the stock higher.
  • If Nvidia’s earnings disappoint in the slightest, this could trigger a heavy selloff.

How about the technicals?

Nvidia is in a weekly uptrend that started early November 2023 and has seen the stock price reach colossal heights.

It pushed through 3 weekly resistance levels that became support levels before stalling near a potential weekly resistance level at 752.04. The market structure clearly shows that a correction wave is currently in progress.

On the D1 chart, the W1 chart correction wave can be seen as a down trend.  The price is approaching a weekly support level.

Although the D1 chart is in a confirmed down trend with a lower top and a lower bottom with the short cycle Stochastics Oscillator adding validation, both the 21 Simple Moving Average as well as the longer cycle Moving Average Convergence Divergence (MACD) Oscillator are still to the upside. This means caution should be exercised with tight risk management for any short opportunities at this time.

If the price, however, breaks through the weekly support level at 663.17, the downside might gather more momentum as buyers will tend to cover their positions, thus adding to the selling positions in the process.

If the weekly support level at 663.17 holds, the buyers might be encouraged to add to their longer-term positions and this might boost the potential upside momentum.


Forex-Time-LogoArticle by ForexTime

ForexTime Ltd (FXTM) is an award winning international online forex broker regulated by CySEC 185/12 www.forextime.com

COT Stock Market Charts: Speculator bets led by S&P500 & MSCI EAFE

By InvestMacro

Here are the latest charts and statistics for the Commitment of Traders (COT) data published by the Commodities Futures Trading Commission (CFTC).

The latest COT data is updated through Tuesday February 13th and shows a quick view of how large traders (for-profit speculators and commercial entities) were positioned in the futures markets.

Weekly Speculator Changes led by S&P500-Mini & MSCI EAFE-Mini

The COT stock markets speculator bets were lower this week as three out of the seven stock markets we cover had higher positioning while the other five markets had lower speculator contracts.

Leading the gains for the stock markets was the S&P500-Mini (17,184 contracts) with the MSCI EAFE-Mini (2,480 contracts) and the Nikkei 225 (92 contracts) also showing positive weeks.

The markets with the declines in speculator bets this week were the Russell-Mini (-4,458 contracts), the VIX (-1,979 contracts), the DowJones-Mini (-616 contracts) and the Nasdaq-Mini (-812 contracts) also registering lower bets on the week.


Speculators Leaderboard

Legend: Weekly Speculators Change | Speculators Current Net Position | Speculators Strength Score compared to last 3-Years (0-100 range)


Strength Scores led by DowJones-Mini & Nasdaq-Mini

COT Strength Scores (a normalized measure of Speculator positions over a 3-Year range, from 0 to 100 where above 80 is Extreme-Bullish and below 20 is Extreme-Bearish) showed that the DowJones-Mini (93 percent) and the Nasdaq-Mini (89 percent) lead the stock markets this week. The VIX (75 percent) and Russell-Mini (68 percent) come in as the next highest in the weekly strength scores.

On the downside, the S&P500-Mini (33 percent) comes in at the lowest strength level currently with the next lowest strength score being the MSCI EAFE-Mini (38 percent).

Strength Statistics:
VIX (75.2 percent) vs VIX previous week (76.5 percent)
S&P500-Mini (32.6 percent) vs S&P500-Mini previous week (30.0 percent)
DowJones-Mini (93.4 percent) vs DowJones-Mini previous week (94.4 percent)
Nasdaq-Mini (88.9 percent) vs Nasdaq-Mini previous week (90.1 percent)
Russell2000-Mini (67.7 percent) vs Russell2000-Mini previous week (70.9 percent)
Nikkei USD (42.5 percent) vs Nikkei USD previous week (41.9 percent)
EAFE-Mini (37.6 percent) vs EAFE-Mini previous week (35.0 percent)


MSCI EAFE-Mini & DowJones-Mini top the 6-Week Strength Trends

COT Strength Score Trends (or move index, calculates the 6-week changes in strength scores) showed that the MSCI EAFE-Mini (9 percent) leads the past six weeks trends for the stock markets.

The Russell-Mini (-17 percent) leads the downside trend scores currently with the Nasdaq-Mini (-11 percent) coming in as the next market with lower trend scores.

Strength Trend Statistics:
VIX (-4.0 percent) vs VIX previous week (4.8 percent)
S&P500-Mini (-0.3 percent) vs S&P500-Mini previous week (-6.0 percent)
DowJones-Mini (1.3 percent) vs DowJones-Mini previous week (16.0 percent)
Nasdaq-Mini (-10.8 percent) vs Nasdaq-Mini previous week (7.6 percent)
Russell2000-Mini (-16.7 percent) vs Russell2000-Mini previous week (-5.4 percent)
Nikkei USD (0.2 percent) vs Nikkei USD previous week (-4.6 percent)
EAFE-Mini (9.2 percent) vs EAFE-Mini previous week (12.5 percent)


Individual Stock Market Charts:

VIX Volatility Futures:

VIX Volatility Futures COT ChartThe VIX Volatility large speculator standing this week came in at a net position of -50,966 contracts in the data reported through Tuesday. This was a weekly lowering of -1,979 contracts from the previous week which had a total of -48,987 net contracts.

This week’s current strength score (the trader positioning range over the past three years, measured from 0 to 100) shows the speculators are currently Bullish with a score of 75.2 percent. The commercials are Bearish with a score of 23.4 percent and the small traders (not shown in chart) are Bullish with a score of 77.5 percent.

Price Trend-Following Model: Downtrend

Our weekly trend-following model classifies the current market price position as: Downtrend. The current action for the model is considered to be: Hold – Maintain Short Position.

VIX Volatility Futures StatisticsSPECULATORSCOMMERCIALSSMALL TRADERS
– Percent of Open Interest Longs:21.146.27.3
– Percent of Open Interest Shorts:35.231.18.3
– Net Position:-50,96654,671-3,705
– Gross Longs:76,506167,38126,308
– Gross Shorts:127,472112,71030,013
– Long to Short Ratio:0.6 to 11.5 to 10.9 to 1
NET POSITION TREND:
– Strength Index Score (3 Year Range Pct):75.223.477.5
– Strength Index Reading (3 Year Range):BullishBearishBullish
NET POSITION MOVEMENT INDEX:
– 6-Week Change in Strength Index:-4.02.98.0


S&P500 Mini Futures:

SP500 Mini Futures COT ChartThe S&P500 Mini large speculator standing this week came in at a net position of -215,778 contracts in the data reported through Tuesday. This was a weekly lift of 17,184 contracts from the previous week which had a total of -232,962 net contracts.

This week’s current strength score (the trader positioning range over the past three years, measured from 0 to 100) shows the speculators are currently Bearish with a score of 32.6 percent. The commercials are Bullish with a score of 60.9 percent and the small traders (not shown in chart) are Bullish with a score of 62.3 percent.

Price Trend-Following Model: Uptrend

Our weekly trend-following model classifies the current market price position as: Uptrend. The current action for the model is considered to be: Hold – Maintain Long Position.

S&P500 Mini Futures StatisticsSPECULATORSCOMMERCIALSSMALL TRADERS
– Percent of Open Interest Longs:12.574.310.9
– Percent of Open Interest Shorts:21.767.88.2
– Net Position:-215,778152,51263,266
– Gross Longs:292,4661,738,023254,739
– Gross Shorts:508,2441,585,511191,473
– Long to Short Ratio:0.6 to 11.1 to 11.3 to 1
NET POSITION TREND:
– Strength Index Score (3 Year Range Pct):32.660.962.3
– Strength Index Reading (3 Year Range):BearishBullishBullish
NET POSITION MOVEMENT INDEX:
– 6-Week Change in Strength Index:-0.33.5-9.3


Dow Jones Mini Futures:

Dow Jones Mini Futures COT ChartThe Dow Jones Mini large speculator standing this week came in at a net position of 20,369 contracts in the data reported through Tuesday. This was a weekly decrease of -616 contracts from the previous week which had a total of 20,985 net contracts.

This week’s current strength score (the trader positioning range over the past three years, measured from 0 to 100) shows the speculators are currently Bullish-Extreme with a score of 93.4 percent. The commercials are Bearish-Extreme with a score of 4.7 percent and the small traders (not shown in chart) are Bullish with a score of 57.3 percent.

Price Trend-Following Model: Uptrend

Our weekly trend-following model classifies the current market price position as: Uptrend. The current action for the model is considered to be: Hold – Maintain Long Position.

Dow Jones Mini Futures StatisticsSPECULATORSCOMMERCIALSSMALL TRADERS
– Percent of Open Interest Longs:31.651.115.3
– Percent of Open Interest Shorts:11.973.412.7
– Net Position:20,369-23,1162,747
– Gross Longs:32,66552,81515,867
– Gross Shorts:12,29675,93113,120
– Long to Short Ratio:2.7 to 10.7 to 11.2 to 1
NET POSITION TREND:
– Strength Index Score (3 Year Range Pct):93.44.757.3
– Strength Index Reading (3 Year Range):Bullish-ExtremeBearish-ExtremeBullish
NET POSITION MOVEMENT INDEX:
– 6-Week Change in Strength Index:1.3-3.78.3


Nasdaq Mini Futures:

Nasdaq Mini Futures COT ChartThe Nasdaq Mini large speculator standing this week came in at a net position of 32,076 contracts in the data reported through Tuesday. This was a weekly decline of -812 contracts from the previous week which had a total of 32,888 net contracts.

This week’s current strength score (the trader positioning range over the past three years, measured from 0 to 100) shows the speculators are currently Bullish-Extreme with a score of 88.9 percent. The commercials are Bearish-Extreme with a score of 11.7 percent and the small traders (not shown in chart) are Bullish-Extreme with a score of 90.6 percent.

Price Trend-Following Model: Uptrend

Our weekly trend-following model classifies the current market price position as: Uptrend. The current action for the model is considered to be: Hold – Maintain Long Position.

Nasdaq Mini Futures StatisticsSPECULATORSCOMMERCIALSSMALL TRADERS
– Percent of Open Interest Longs:32.952.413.8
– Percent of Open Interest Shorts:22.065.012.1
– Net Position:32,076-37,2135,137
– Gross Longs:97,292155,16140,984
– Gross Shorts:65,216192,37435,847
– Long to Short Ratio:1.5 to 10.8 to 11.1 to 1
NET POSITION TREND:
– Strength Index Score (3 Year Range Pct):88.911.790.6
– Strength Index Reading (3 Year Range):Bullish-ExtremeBearish-ExtremeBullish-Extreme
NET POSITION MOVEMENT INDEX:
– 6-Week Change in Strength Index:-10.811.1-8.4


Russell 2000 Mini Futures:

Russell 2000 Mini Futures COT ChartThe Russell 2000 Mini large speculator standing this week came in at a net position of -24,451 contracts in the data reported through Tuesday. This was a weekly lowering of -4,458 contracts from the previous week which had a total of -19,993 net contracts.

This week’s current strength score (the trader positioning range over the past three years, measured from 0 to 100) shows the speculators are currently Bullish with a score of 67.7 percent. The commercials are Bearish with a score of 30.9 percent and the small traders (not shown in chart) are Bullish with a score of 56.9 percent.

Price Trend-Following Model: Uptrend

Our weekly trend-following model classifies the current market price position as: Uptrend. The current action for the model is considered to be: Hold – Maintain Long Position.

Russell 2000 Mini Futures StatisticsSPECULATORSCOMMERCIALSSMALL TRADERS
– Percent of Open Interest Longs:12.080.16.5
– Percent of Open Interest Shorts:16.876.94.8
– Net Position:-24,45116,1688,283
– Gross Longs:60,783405,97132,713
– Gross Shorts:85,234389,80324,430
– Long to Short Ratio:0.7 to 11.0 to 11.3 to 1
NET POSITION TREND:
– Strength Index Score (3 Year Range Pct):67.730.956.9
– Strength Index Reading (3 Year Range):BullishBearishBullish
NET POSITION MOVEMENT INDEX:
– 6-Week Change in Strength Index:-16.716.8-9.2


Nikkei Stock Average (USD) Futures:

Nikkei Stock Average (USD) Futures COT ChartThe Nikkei Stock Average (USD) large speculator standing this week came in at a net position of -3,388 contracts in the data reported through Tuesday. This was a weekly increase of 92 contracts from the previous week which had a total of -3,480 net contracts.

This week’s current strength score (the trader positioning range over the past three years, measured from 0 to 100) shows the speculators are currently Bearish with a score of 42.5 percent. The commercials are Bearish with a score of 45.5 percent and the small traders (not shown in chart) are Bullish with a score of 66.6 percent.

Price Trend-Following Model: Strong Uptrend

Our weekly trend-following model classifies the current market price position as: Strong Uptrend. The current action for the model is considered to be: Hold – Maintain Long Position.

Nikkei Stock Average Futures StatisticsSPECULATORSCOMMERCIALSSMALL TRADERS
– Percent of Open Interest Longs:10.864.225.0
– Percent of Open Interest Shorts:30.954.914.3
– Net Position:-3,3881,5761,812
– Gross Longs:1,82910,8434,222
– Gross Shorts:5,2179,2672,410
– Long to Short Ratio:0.4 to 11.2 to 11.8 to 1
NET POSITION TREND:
– Strength Index Score (3 Year Range Pct):42.545.566.6
– Strength Index Reading (3 Year Range):BearishBearishBullish
NET POSITION MOVEMENT INDEX:
– 6-Week Change in Strength Index:0.2-2.76.6


MSCI EAFE Mini Futures:

MSCI EAFE Mini Futures COT ChartThe MSCI EAFE Mini large speculator standing this week came in at a net position of -27,856 contracts in the data reported through Tuesday. This was a weekly boost of 2,480 contracts from the previous week which had a total of -30,336 net contracts.

This week’s current strength score (the trader positioning range over the past three years, measured from 0 to 100) shows the speculators are currently Bearish with a score of 37.6 percent. The commercials are Bullish with a score of 61.4 percent and the small traders (not shown in chart) are Bearish with a score of 37.7 percent.

Price Trend-Following Model: Uptrend

Our weekly trend-following model classifies the current market price position as: Uptrend. The current action for the model is considered to be: Hold – Maintain Long Position.

MSCI EAFE Mini Futures StatisticsSPECULATORSCOMMERCIALSSMALL TRADERS
– Percent of Open Interest Longs:7.988.83.2
– Percent of Open Interest Shorts:14.383.32.2
– Net Position:-27,85623,7034,153
– Gross Longs:33,926382,51313,677
– Gross Shorts:61,782358,8109,524
– Long to Short Ratio:0.5 to 11.1 to 11.4 to 1
NET POSITION TREND:
– Strength Index Score (3 Year Range Pct):37.661.437.7
– Strength Index Reading (3 Year Range):BearishBullishBearish
NET POSITION MOVEMENT INDEX:
– 6-Week Change in Strength Index:9.2-5.7-16.4


Article By InvestMacroReceive our weekly COT Newsletter

*COT Report: The COT data, released weekly to the public each Friday, is updated through the most recent Tuesday (data is 3 days old) and shows a quick view of how large speculators or non-commercials (for-profit traders) were positioned in the futures markets.

The CFTC categorizes trader positions according to commercial hedgers (traders who use futures contracts for hedging as part of the business), non-commercials (large traders who speculate to realize trading profits) and nonreportable traders (usually small traders/speculators) as well as their open interest (contracts open in the market at time of reporting). See CFTC criteria here.

US30 aiming for new all-time highs?

By ForexTime 

  • US30 trapped within range
  • Index could see increased volatility
  • RSI signals negative divergence
  • Potential breakout on horizon
  • Key level of interest at 38792

The US30 which tracks the benchmark Dow Jones Industrial Average remains trapped within a 520 pip range on the daily charts.

At the time of writing, it is about 250 pips away from reaching a new all-time high, repeating last Friday’s feat.

With Disney scheduled to report its earnings after US markets close, this could translate to increased volatility for the index. Investors will direct their attention towards the company’s earnings guidance for clarity on its future business outlook. Should earnings beat forecasts, this could provide support for the US30.

Beyond earnings, investors will also have their sights on the CPI revisions scheduled for Friday which has the potential to impact the index.

Technically speaking, the US30 has seen narrowing price ranges on the monthly charts since making the monster move back in November. It has also seen some significant movements over the past few months.

  • November:  Over 3000 pips

  • December: Almost 2000 pips

  • January: Nearly 1500 pips

On the daily time frame, US30 is confronted with a negative divergence, with the RSI failing to make a new high in lockstep with the February 2nd all-time-high.

The index bulls(those looking to see the index go higher), will be looking for a strong close above the ranges resistance at 38681 to reach new all0-time highs above 38792.1.

On the other hand, US30 bears (those looking to profit from a decline in the index may have the following levels in their sights.

  • 381460: The sideways channel support

  • 38071.1: The 21-day Exponential Moving Average (EMA)

  • 37800: A significant price level

  • 37305.2: The 50-Day Exponential Moving Average


Forex-Time-LogoArticle by ForexTime

ForexTime Ltd (FXTM) is an award winning international online forex broker regulated by CySEC 185/12 www.forextime.com

Understanding Meta’s 0.4% Yield and Its Growth Potential

By Ino.com |  Source: Understanding Meta’s 0.4% Yield and Its Growth Potential

Dividend-loving investors worldwide woke up with exciting news on Friday, as Facebook parent Meta Platforms, Inc. (META) announced its first-ever quarterly dividend and authorized a $50 billion share buyback program.

The company will pay a cash dividend of 50 cents per share on March 26 to shareholders of record as of February 22, joining other peers, including Apple Inc. (AAPL), Microsoft Corporation (MSFT), and Oracle Corporation (ORCL), which have regular payouts. META’s board intends to issue a cash dividend on a quarterly basis.

“Introducing a dividend just gives us a more balanced capital return program and some added flexibility in how we return capital in the future,” Meta’s Chief Financial Officer Susan Li told analysts on its earnings call.

META’s annual dividend of $2 translates to a yield of 0.4% at the prevailing share price. The stock finished nearly 20% higher to $474.99 on Friday after reporting better-than-expected fourth-quarter and full-year 2023 earnings.

The average yield for a dividend-paying stock in the S&P 500 is nearly 2%. Meta’s dividend payout is lower than that rate; however, companies generally start small. Now, investors can look forward to its dividend growth and stock gains.

Looking at Microsoft, the company initiated its cash dividend on January 16, 2003. Its annual dividend was $0.08 per share, which resulted in a yield of about 0.3%. A year following the dividend declaration, MSFT’s stock was up 10%, and the annual dividend for 2024 was raised to $0.16. Currently, the company pays a quarterly dividend of $0.75.

Talking about Apple, it stopped paying cash dividends in 1995 but then declared again in January 2013. Adjusting for all the splits, cash dividends in 2013 translated to an annualized yield of nearly 1.4%. A year after the dividend restart, AAPL’s stock was approximately 24% up as the company continued payouts. Since the restart, Apple has paid a total of around $34 per share.

Dividends are typically welcomed by shareholders and signal management’s confidence about the company’s future growth. Moreover, initial dividend payouts open up to investors who only hold stock in dividend payers.

Further, Meta’s recently released report marked the fourth quarter of the company’s self-described “year of efficiency,” which founder and CEO Mark Zuckerberg announced in February 2023. The company’s turnaround strategy involved layoffs and other cuts to spending, which in turn ended up being a successful effort to reverse the previous year’s revenue declines and share price weakness.

Outstanding Last Reported Financials

For the fourth quarter that ended December 31, 2023, META reported revenue of $39.17 billion, an increase of 24.7% year-over-year. The revenue surpassed analysts’ estimate of $40.11 billion. The company’s revenue from the Advertising segment grew 23.8% year-over-year, and its revenue from the Family of Apps segment rose 24.2%.

Meanwhile, META’s total costs and expenses reduced by 7.9% year-over-year to $23.73 billion. Its operating margin more than doubled to 41%, a clear sign that several cost-cutting measures are boosting profitability.

Facebook parent Meta’s income from operations rose 156% from the prior year’s period to $16.38 billion. Its net income increased 201.3% from the year-ago value to $14.02 billion. The company posted earnings per share attributable to Class A and Class B common stockholders of $5.33, compared to the consensus estimate of $1.76, and up 202.8% year-over-year.

As of December 31, 2023, META’s cash and cash equivalents stood at $41.86 billion, compared to $14.68 billion as of December 31, 2022. The company’s total assets were $229.62 billion versus $185.73 billion as of December 31, 2022.

Family daily active people (DAP) came in at 3.19 billion on average for December 2023, up 8% year-over-year. Family monthly activity people (MAP) was 3.98 billion as of December 31, 2023, an increase of 6% year-over-year.

Also, Facebook daily active users (DAUs) and Facebook monthly active users (MAUs) were 2.11 billion on average and 3.07 billion as of December 31, 2023, up 6% and 3% year-over-year, respectively.

As of December 31, 2023, the tech giant completed the data center initiatives and the employee layoffs, along with the facilities consolidation initiatives. META’s headcount was 67,317 at the end of the year 2023, a decline of 22% year-over-year.

“We had a good quarter as our community and business continue to grow,” said CEO Zuckerberg. “We’ve made a lot of progress on our vision for advancing AI and the metaverse.”

Fiscal 2024 Outlook

For the first quarter of 2024, META expects total revenue to be in the range of $34.50-37 billion. For the full year 2024, the management expects total expenses to be in the range of $94-99 billion, unchanged from the previous outlook.

The company anticipates full-year capital expenditures to be in the range of $30-37 billion, an increase of $2 billion in the high end of its prior range. Meta expects growth to be driven by investments in servers, including AI and non-AI hardware and data centers, and it plans to ramp up construction on sites with its previously announced new data center architecture.

META’s updated outlook reflects its evolving understanding of its AI capacity demands as the company anticipates what will be needed for the next generations of foundational research and product development.

Ramping up Efforts in AI and Metaverse

Meta is making consistent efforts to secure its place in the increasing AI arms race. Last month, CEO Mark Zuckerberg announced that META plans to build its own artificial general intelligence, known as AGI, which is artificial intelligence that meets or exceeds human intelligence in almost every area. He added that the company further plans to open it up to developers.

In a video posted to Meta’s social network Threads, Zuckerberg said building the best AI for chatbots, creators, and businesses requires enhanced advancement in AI across the board. “Our long term vision is to build general intelligence, open source it responsibly, and make it widely available so everyone can benefit,” he said in a post on Threads.

The tech giant announced building out its infrastructure to accommodate this push to get AI into products, and it planned to have about 350,000 H100 GPUs (graphics processing units) from chip designer NVIDIA Corporation (NVDA) by the end of this year. In combination with equivalent chips from other suppliers, Meta will have around 600,000 total GPUs by the end of the year, Zuckerberg said.

He added that the company plans to grow and bring its two major AI research groups – FAIR and GenAI – together to accelerate its work. He further said he believes that Meta’s vision for AI and the AR/VR-driven metaverse are connected.

“By the end of the decade, I think lots of people will talk to AIs frequently throughout the day using smart glasses like what we’re building with Ray Ban Meta.”

Mark Zuckerberg’s recent announcement is one of the company’s biggest pledges to double down on AI. Earlier last year, after the viral success of OpenAI’s ChatGPT, Zuckerberg announced that Meta is creating a new “top-level product group” to “turbocharge” the company’s work on AI tools.

Since then, Meta has introduced tools and information aimed at assisting users understand how AI influences what they see on its apps. The company has launched a commercial version of its Llama large language model (LLM), ad tools that can generate image backgrounds from text prompts, and a “Meta AI” chatbot that can be accessed directly via its Ray-Ban smart glasses.

In his posts last month, Meta CEO said the company is currently training a third version of the Liama model.

Impressive Historical Growth

Over the past three years, META’s revenue and EBITDA grew at CAGRs of 16.2% and 15%, respectively. The company’s net income and EPS rose at respective CAGRs of 10.3% and 13.8% over the same timeframe. Its levered free cash flow improved at 25.6% CAGR over the same period.

Moreover, the social networking company’s total assets increased at a CAGR of 13% over the same timeframe.

Favorable Analyst Estimates

Analysts expect META’s revenue for the first quarter (ending March 2024) to grow 25.3% year-over-year to $35.88 billion. The consensus EPS estimate of $4.25 for the ongoing quarter indicates a 93.3% year-over-year increase. Moreover, Meta has topped consensus revenue and EPS estimates in each of the trailing four quarters, which is remarkable.

Furthermore, Street expects Meta’s revenue and EPS for the fiscal year (ending December 2024) to grow 17.3% and 32.4% year-over-year to $158.20 billion and $19.69, respectively. For the fiscal year 2025, the company’s revenue and EPS are expected to increase 11.2% and 15.3% from the previous year to $175.98 billion and $22.70, respectively.

Solid Profitability

META’s trailing-12-month gross profit margin of 80.72% is 64.5% higher than the 49.07% industry average. Likewise, the stock’s trailing-12-month EBIT margin and net income margin of 36.33% and 28.98% are considerably higher than the industry averages of 8.47% and 3.50%, respectively.

In addition, the stock’s trailing-12-month ROCE, ROTC, and ROTA of 28.04%, 17.84% and 17.03% favorably compared to the respective industry averages of 4.09%, 3.52%, and 1.43%. Also, its trailing-12-month levered FCF margin of 23.52% is 202.7% higher than the industry average of 7.77%.

Bottom Line

Facebook parent META recently reported a big beat on earnings and revenue for the fourth quarter of fiscal 2023. The company, which owns Facebook, Instagram, and WhatsApp, also announced its first-ever dividend of $0.50 per share and authorized a $50 billion share buyback program. Dividends generally signal management’s confidence about the company’s future growth.

Moreover, Meta’s market capitalization last month surpassed $1 trillion. The company last exceeded this mark in the market cap in 2021, when it was still known as Facebook.

Meta’s “year of efficiency” and several cost-cutting measures paid off in a significant way and offered a sweetener for investors, sending its shares higher. The stock is up nearly 38% over the past month and has gained more than 150% over the past year.

2023 was a pivotal year for the social networking giant, where it raised its operating discipline, delivered solid execution across its product priorities, and significantly improved ad performance for the businesses that rely on its services. In 2024, the company further seems well-positioned to build on its progress in each of these areas while advancing its ambitious efforts in AI and Reality Labs.

Given META’s robust financials, accelerating profitability, dividend initiation, and solid growth outlook, primarily as it seeks to strengthen its position in AI, it could be wise to invest in this stock now.

By Ino.com – See our Trader Blog, INO TV Free & Market Analysis Alerts


COT Stock Market Charts: Speculator bets led by Nasdaq & DowJones

By InvestMacro

Here are the latest charts and statistics for the Commitment of Traders (COT) data published by the Commodities Futures Trading Commission (CFTC).

The latest COT data is updated through Tuesday January 30th and shows a quick view of how large traders (for-profit speculators and commercial entities) were positioned in the futures markets.

Weekly Speculator Changes led by Nasdaq-Mini & DowJones-Mini

The COT stock markets speculator bets were lower this week as just two out of the seven stock markets we cover had higher positioning while the other five markets had lower speculator contracts.

Leading the gains for the stock markets was Nasdaq-Mini (6,209 contracts) with the DowJones-Mini (6,162 contracts) also showing positive weeks.

The markets with the declines in speculator bets this week were the S&P500-Mini (-36,489 contracts), the VIX (-5,347 contracts), the Russell-Mini (-4,315 contracts), the Nikkei 225 (-175 contracts) and the MSCI EAFE-Mini (-596 contracts) also registering lower bets on the week.


Stock Markets Speculators Leaderboard

Legend: Weekly Speculators Change | Speculators Current Net Position | Speculators Strength Score compared to last 3-Years (0-100 range)


Strength Scores led by Nasdaq-Mini & DowJones-Mini

COT Strength Scores (a normalized measure of Speculator positions over a 3-Year range, from 0 to 100 where above 80 is Extreme-Bullish and below 20 is Extreme-Bearish) showed that the Nasdaq-Mini (100 percent) and the DowJones-Mini (100 percent) lead the stock markets this week and are at the top of their 3-year ranges. The Russell-Mini (78 percent) comes in as the next highest in the weekly strength scores.

On the downside, the S&P500-Mini (31 percent) comes in at the lowest strength level currently with the next lowest strength score being the MSCI EAFE-Mini (36 percent).

Strength Statistics:
VIX (72.8 percent) vs VIX previous week (76.4 percent)
S&P500-Mini (31.0 percent) vs S&P500-Mini previous week (36.5 percent)
DowJones-Mini (100.0 percent) vs DowJones-Mini previous week (90.0 percent)
Nasdaq-Mini (100.0 percent) vs Nasdaq-Mini previous week (90.4 percent)
Russell2000-Mini (77.6 percent) vs Russell2000-Mini previous week (80.7 percent)
Nikkei USD (39.1 percent) vs Nikkei USD previous week (40.4 percent)
EAFE-Mini (35.8 percent) vs EAFE-Mini previous week (36.4 percent)


DowJones-Mini & Nasdaq-Mini top the 6-Week Strength Trends

COT Strength Score Trends (or move index, calculates the 6-week changes in strength scores) showed that the DowJones-Mini (28 percent) leads the past six weeks trends for the stock markets. The Nasdaq-Mini (26 percent), the Russell-Mini (14 percent) and the MSCI EAFE-Mini (9 percent) are the next highest positive movers in the latest trends data.

The VIX (-16 percent) leads the downside trend scores currently with the Nikkei 225 (-11 percent) coming in as the next market with lower trend scores.

Strength Trend Statistics:
VIX (-16.3 percent) vs VIX previous week (-1.9 percent)
S&P500-Mini (-4.6 percent) vs S&P500-Mini previous week (-18.5 percent)
DowJones-Mini (28.1 percent) vs DowJones-Mini previous week (24.1 percent)
Nasdaq-Mini (26.5 percent) vs Nasdaq-Mini previous week (38.7 percent)
Russell2000-Mini (13.9 percent) vs Russell2000-Mini previous week (31.5 percent)
Nikkei USD (-10.8 percent) vs Nikkei USD previous week (-9.7 percent)
EAFE-Mini (8.7 percent) vs EAFE-Mini previous week (26.6 percent)


Individual Stock Market Charts:

VIX Volatility Futures:

VIX Volatility Futures COT ChartThe VIX Volatility large speculator standing this week equaled a net position of -54,540 contracts in the data reported through Tuesday. This was a weekly lowering of -5,347 contracts from the previous week which had a total of -49,193 net contracts.

This week’s current strength score (the trader positioning range over the past three years, measured from 0 to 100) shows the speculators are currently Bullish with a score of 72.8 percent. The commercials are Bearish with a score of 25.0 percent and the small traders (not shown in chart) are Bullish-Extreme with a score of 83.7 percent.

Price Trend-Following Model: Downtrend

Our weekly trend-following model classifies the current market price position as: Downtrend. The current action for the model is considered to be: Hold – Maintain Short Position.

VIX Volatility Futures StatisticsSPECULATORSCOMMERCIALSSMALL TRADERS
– Percent of Open Interest Longs:20.245.98.1
– Percent of Open Interest Shorts:35.929.58.8
– Net Position:-54,54057,042-2,502
– Gross Longs:70,187159,58128,032
– Gross Shorts:124,727102,53930,534
– Long to Short Ratio:0.6 to 11.6 to 10.9 to 1
NET POSITION TREND:
– Strength Index Score (3 Year Range Pct):72.825.083.7
– Strength Index Reading (3 Year Range):BullishBearishBullish-Extreme
NET POSITION MOVEMENT INDEX:
– 6-Week Change in Strength Index:-16.314.411.4


S&P500 Mini Futures:

SP500 Mini Futures COT ChartThe S&P500 Mini large speculator standing this week equaled a net position of -225,962 contracts in the data reported through Tuesday. This was a weekly decline of -36,489 contracts from the previous week which had a total of -189,473 net contracts.

This week’s current strength score (the trader positioning range over the past three years, measured from 0 to 100) shows the speculators are currently Bearish with a score of 31.0 percent. The commercials are Bullish with a score of 59.5 percent and the small traders (not shown in chart) are Bullish with a score of 70.4 percent.

Price Trend-Following Model: Strong Uptrend

Our weekly trend-following model classifies the current market price position as: Strong Uptrend. The current action for the model is considered to be: Hold – Maintain Long Position.

S&P500 Mini Futures StatisticsSPECULATORSCOMMERCIALSSMALL TRADERS
– Percent of Open Interest Longs:12.374.311.5
– Percent of Open Interest Shorts:22.168.17.8
– Net Position:-225,962142,19483,768
– Gross Longs:284,5591,715,110264,947
– Gross Shorts:510,5211,572,916181,179
– Long to Short Ratio:0.6 to 11.1 to 11.5 to 1
NET POSITION TREND:
– Strength Index Score (3 Year Range Pct):31.059.570.4
– Strength Index Reading (3 Year Range):BearishBullishBullish
NET POSITION MOVEMENT INDEX:
– 6-Week Change in Strength Index:-4.62.64.7


Dow Jones Mini Futures:

Dow Jones Mini Futures COT ChartThe Dow Jones Mini large speculator standing this week equaled a net position of 24,410 contracts in the data reported through Tuesday. This was a weekly boost of 6,162 contracts from the previous week which had a total of 18,248 net contracts.

This week’s current strength score (the trader positioning range over the past three years, measured from 0 to 100) shows the speculators are currently Bullish-Extreme with a score of 100.0 percent. The commercials are Bearish-Extreme with a score of 0.0 percent and the small traders (not shown in chart) are Bullish with a score of 53.4 percent.

Price Trend-Following Model: Strong Uptrend

Our weekly trend-following model classifies the current market price position as: Strong Uptrend. The current action for the model is considered to be: Hold – Maintain Long Position.

Dow Jones Mini Futures StatisticsSPECULATORSCOMMERCIALSSMALL TRADERS
– Percent of Open Interest Longs:36.448.213.8
– Percent of Open Interest Shorts:13.872.712.0
– Net Position:24,410-26,3511,941
– Gross Longs:39,32552,04014,936
– Gross Shorts:14,91578,39112,995
– Long to Short Ratio:2.6 to 10.7 to 11.1 to 1
NET POSITION TREND:
– Strength Index Score (3 Year Range Pct):100.00.053.4
– Strength Index Reading (3 Year Range):Bullish-ExtremeBearish-ExtremeBullish
NET POSITION MOVEMENT INDEX:
– 6-Week Change in Strength Index:28.1-28.611.9


Nasdaq Mini Futures:

Nasdaq Mini Futures COT ChartThe Nasdaq Mini large speculator standing this week equaled a net position of 39,251 contracts in the data reported through Tuesday. This was a weekly gain of 6,209 contracts from the previous week which had a total of 33,042 net contracts.

This week’s current strength score (the trader positioning range over the past three years, measured from 0 to 100) shows the speculators are currently Bullish-Extreme with a score of 100.0 percent. The commercials are Bearish-Extreme with a score of 0.0 percent and the small traders (not shown in chart) are Bullish-Extreme with a score of 100.0 percent.

Price Trend-Following Model: Strong Uptrend

Our weekly trend-following model classifies the current market price position as: Strong Uptrend. The current action for the model is considered to be: Hold – Maintain Long Position.

Nasdaq Mini Futures StatisticsSPECULATORSCOMMERCIALSSMALL TRADERS
– Percent of Open Interest Longs:32.053.014.2
– Percent of Open Interest Shorts:18.769.311.3
– Net Position:39,251-47,8938,642
– Gross Longs:94,317156,08641,844
– Gross Shorts:55,066203,97933,202
– Long to Short Ratio:1.7 to 10.8 to 11.3 to 1
NET POSITION TREND:
– Strength Index Score (3 Year Range Pct):100.00.0100.0
– Strength Index Reading (3 Year Range):Bullish-ExtremeBearish-ExtremeBullish-Extreme
NET POSITION MOVEMENT INDEX:
– 6-Week Change in Strength Index:26.5-24.313.6


Russell 2000 Mini Futures:

Russell 2000 Mini Futures COT ChartThe Russell 2000 Mini large speculator standing this week equaled a net position of -10,504 contracts in the data reported through Tuesday. This was a weekly reduction of -4,315 contracts from the previous week which had a total of -6,189 net contracts.

This week’s current strength score (the trader positioning range over the past three years, measured from 0 to 100) shows the speculators are currently Bullish with a score of 77.6 percent. The commercials are Bearish-Extreme with a score of 19.5 percent and the small traders (not shown in chart) are Bullish with a score of 69.4 percent.

Price Trend-Following Model: Uptrend

Our weekly trend-following model classifies the current market price position as: Uptrend. The current action for the model is considered to be: Hold – Maintain Long Position.

Russell 2000 Mini Futures StatisticsSPECULATORSCOMMERCIALSSMALL TRADERS
– Percent of Open Interest Longs:16.475.96.7
– Percent of Open Interest Shorts:18.476.24.3
– Net Position:-10,504-1,48811,992
– Gross Longs:83,470387,38734,014
– Gross Shorts:93,974388,87522,022
– Long to Short Ratio:0.9 to 11.0 to 11.5 to 1
NET POSITION TREND:
– Strength Index Score (3 Year Range Pct):77.619.569.4
– Strength Index Reading (3 Year Range):BullishBearish-ExtremeBullish
NET POSITION MOVEMENT INDEX:
– 6-Week Change in Strength Index:13.9-16.319.6


Nikkei Stock Average (USD) Futures:

Nikkei Stock Average (USD) Futures COT ChartThe Nikkei Stock Average (USD) large speculator standing this week equaled a net position of -3,868 contracts in the data reported through Tuesday. This was a weekly reduction of -175 contracts from the previous week which had a total of -3,693 net contracts.

This week’s current strength score (the trader positioning range over the past three years, measured from 0 to 100) shows the speculators are currently Bearish with a score of 39.1 percent. The commercials are Bearish with a score of 47.2 percent and the small traders (not shown in chart) are Bullish with a score of 69.8 percent.

Price Trend-Following Model: Strong Uptrend

Our weekly trend-following model classifies the current market price position as: Strong Uptrend. The current action for the model is considered to be: Hold – Maintain Long Position.

Nikkei Stock Average Futures StatisticsSPECULATORSCOMMERCIALSSMALL TRADERS
– Percent of Open Interest Longs:11.563.924.6
– Percent of Open Interest Shorts:34.552.912.6
– Net Position:-3,8681,8572,011
– Gross Longs:1,93110,7364,133
– Gross Shorts:5,7998,8792,122
– Long to Short Ratio:0.3 to 11.2 to 11.9 to 1
NET POSITION TREND:
– Strength Index Score (3 Year Range Pct):39.147.269.8
– Strength Index Reading (3 Year Range):BearishBearishBullish
NET POSITION MOVEMENT INDEX:
– 6-Week Change in Strength Index:-10.80.423.8


MSCI EAFE Mini Futures:

MSCI EAFE Mini Futures COT ChartThe MSCI EAFE Mini large speculator standing this week equaled a net position of -29,562 contracts in the data reported through Tuesday. This was a weekly fall of -596 contracts from the previous week which had a total of -28,966 net contracts.

This week’s current strength score (the trader positioning range over the past three years, measured from 0 to 100) shows the speculators are currently Bearish with a score of 35.8 percent. The commercials are Bullish with a score of 61.8 percent and the small traders (not shown in chart) are Bearish with a score of 43.9 percent.

Price Trend-Following Model: Uptrend

Our weekly trend-following model classifies the current market price position as: Uptrend. The current action for the model is considered to be: Hold – Maintain Long Position.

MSCI EAFE Mini Futures StatisticsSPECULATORSCOMMERCIALSSMALL TRADERS
– Percent of Open Interest Longs:7.489.23.2
– Percent of Open Interest Shorts:14.483.52.0
– Net Position:-29,56224,1715,391
– Gross Longs:31,441376,77413,648
– Gross Shorts:61,003352,6038,257
– Long to Short Ratio:0.5 to 11.1 to 11.7 to 1
NET POSITION TREND:
– Strength Index Score (3 Year Range Pct):35.861.843.9
– Strength Index Reading (3 Year Range):BearishBullishBearish
NET POSITION MOVEMENT INDEX:
– 6-Week Change in Strength Index:8.7-11.212.6


Article By InvestMacroReceive our weekly COT Newsletter

*COT Report: The COT data, released weekly to the public each Friday, is updated through the most recent Tuesday (data is 3 days old) and shows a quick view of how large speculators or non-commercials (for-profit traders) were positioned in the futures markets.

The CFTC categorizes trader positions according to commercial hedgers (traders who use futures contracts for hedging as part of the business), non-commercials (large traders who speculate to realize trading profits) and nonreportable traders (usually small traders/speculators) as well as their open interest (contracts open in the market at time of reporting). See CFTC criteria here.

NAS100 poised for new all-time high?

By ForexTime 

  • NAS100 waits for big tech earnings
  • Microsoft & Alphabet in focus
  • Index bullish but RSI overbought
  • Key levels of interest at 17306.2 & 17650.4

The NAS100 is set to make significant moves over the next few days as 5 of the so-called “Magnificent 7” tech titans report quarterly earnings.

Microsoft and Alphabet kick-off updates after US markets close on Tuesday to an incredibly busy week for US equities.

On Thursday, Apple, Amazon, and Meta are scheduled to publish their latest results.

When factoring the Fed decision mid-week and the US jobs report on Friday, this could be a pivotal week for the index.

With advancement in Artificial Intelligence fueling growth in the Magnificent 7 companies, a bullish earnings guidance could be on the cards.

This may influence NAS100 bulls – those looking to see the index move higher.

NOTE: This new NAS100 index tracks the underlying benchmark Nasdaq 100 index.


Technically speaking, NAS100 is in a sideways range formed over the last 7 trading days.

At the time of writing, it is testing the resistance zone of this range.

The Relative strength index (an indicator that highlights overbought and oversold zones) reveals that NAS100 is overbought.

NAS100 bulls will be looking for a strong close above the channel at 17650.4, with their eyes set no new highs above the all-time high of 17686.8.

Bears (those looking to see the index decline) on the other hand will see a miss in earnings as an opportunity to test the range’s support zone at 17306.2.

A strong close below the range support zone may see the index test the following support levels

· 17105.1: The 21-Exponential Moving Average (EMA)

· 17008.8: The upward-sloping trendline drawn from the October 26th low


Forex-Time-LogoArticle by ForexTime

ForexTime Ltd (FXTM) is an award winning international online forex broker regulated by CySEC 185/12 www.forextime.com

Target Thursdays: SPX500_m, EURUSD & XAGUSD hit target prices

By ForexTime 

Check out these potential profits that you may have missed from our Daily Market Analysis.

  1. SPX500_m bulls deliver

Back on Monday, we covered the SPX500_m in our trade of the week. Prices were firmly bullish, especially after surging to record highs last Friday.

  • TP hit: YES, the SPX500_m hit the 4900 level
  • Why: Investor optimism for strong corporate earnings, rising tech stocks
  • Technicals: Intraday breakout above 4870 fuelled upside

  1. EURUSD hits resistance ahead of ECB

It has been a choppy week for the EURUSD as anticipation mounts ahead of the ECB meeting. Nevertheless, prices have hit some of our targets before this big event.

  • TP hit: YES, the EURUSD hit 21-Day EMA and 50% Fib level
  • Why: Mixed Eurozone data dampened ECB cut bets, weak US dollar
  • Technicals: Prices in a range waiting for significant breakout

  1. XAGUSD eyes 4th target level

Silver bulls have been busy this morning, cutting through the bullish price targets like a hot knife through butter.

  • TP hit: YES, 3 out of the 4 profit targets have been hit his morning.
  • Why: A weaker dollar could be offering support to the precious metal
  • Technicals: Prices are respecting an uptrend on the 15-minute timeframe

The above scenario (XAGUSD) is based on the FXTM Signals that are posted twice a day (before the London and New York sessions) for all FXTM clients to follow. This can found in the MyFXTM profile under Trading Services… FXTM Trading Signals.


Forex-Time-LogoArticle by ForexTime

ForexTime Ltd (FXTM) is an award winning international online forex broker regulated by CySEC 185/12 www.forextime.com

US stock indices hit all-time highs. PBoC left key lending rates unchanged

By JustMarkets

At Friday’s close, the Dow Jones Index (US30) was up by 1.05% (+0.12% for the week), while the S&P 500 Index (US500) added 1.23% (+1.01% for the week) on Friday. The NASDAQ Technology Index (US100) closed positive by 1.70% on Friday (up +2.07% for the week). At the same time, all three indices updated their all-time highs.

Stocks rose to record highs on Friday on optimism about the US economic outlook. According to the University of Michigan, inflation expectations in the US fell this month, bolstering hopes that the Fed could provide a soft landing for the economy. In addition, Friday’s rally in chip stocks is also boosting tech stocks and the broader market after Taiwan Semiconductor Manufacturing Co gave an upbeat outlook for this year, bolstering hopes for a rebound in chip sales.

Weakening political risks supported stocks after Congress passed a resolution late Thursday night to keep the government running through March and avoid a shutdown on Saturday. The temporary measure would fund some US agencies through March 1 and others through March 8.

Shares of iRobot fell by more than 25% after Bloomberg reported that the European Union’s antitrust authority intends to block the company’s planned acquisition of Amazon.com.

Equity markets in Europe were mostly down on Friday. Germany’s DAX (DE40) decreased by 0.07% (-1.01% for the week), France’s CAC 40 (FR 40) fell by 0.40% (-1.29% for the week), Spain’s IBEX 35 (ES35) lost 0.22% (-2.58% for the week), and the UK’s FTSE 100 (UK100) closed positive by 0.04% (2.14% for the week).

Over the past week, expectations of an ECB interest rate cut have weakened. In the swap market, the probability of an ECB rate cut at the March meeting has fallen to 16% from over 50% at the beginning of the month. Swaps currently estimate the odds of a 25 bps ECB rate cut at 3% at the next meeting on January 25 and 16% at the next meeting on March 7. The first-rate cut is now expected in April. Germany’s producer price index for December fell more than expected, which is dovish for ECB policy.

In December, UK retailers suffered their biggest drop in sales in nearly three years, raising the risk that the economy slipped into recession late last year. UK retail sales in December 2023 fell by 2.4% compared to the same month in 2022, driven by a marked decline in sales. This was the largest monthly fall since January 2021.

Crude oil and gasoline prices declined moderately on Friday. Expectations that global oil supplies will remain ample despite geopolitical risks in the Middle East are weighing on crude oil prices. But against the backdrop of OPEC+ production cuts, as well as periodic escalation of the conflict in the Red Sea, traders should not expect a significant decline in prices for black gold in the coming weeks.

Asian markets traded mixed last week. Japanese Nikkei 225 (JP225) jumped by 0.92%, Chinese FTSE China A50 (CHA50) remained unchanged in price for five trading days, Hong Kong Hang Seng (HK50) fell by 0.54% for the week, and Australian ASX 200 (AU200) gained 1.02%.

On Monday, the People’s Bank of China (PBoC) kept key lending rates unchanged amid downward pressure on the yuan, disappointing investors expecting stimulus measures. Last week, the People’s Bank of China surprised markets by leaving the medium-term lending rate unchanged. Chinese markets continued to decline amid lingering concerns about a slowing economic recovery.

S&P 500 (US500) 4,839.81 +58.87 (+1.23%)

Dow Jones (US30) 37,863.80 +395.19 (+1.05%)

DAX (DE40)  16,555.13 −12.22 (−0.07%)

FTSE 100 (UK100) 7,461.93 +2.84 (+0.04%)

USD Index  103.24 −0.30 (−0.29%)

News feed for 2024.01.22:
  • – China PBoC Loan Prime Rate (m/m) at 03:15 (GMT+2).

By JustMarkets


This article reflects a personal opinion and should not be interpreted as an investment advice, and/or offer, and/or a persistent request for carrying out financial transactions, and/or a guarantee, and/or a forecast of future events.