By InvestMacro
Here are the latest charts and statistics for the Commitment of Traders (COT) data published by the Commodities Futures Trading Commission (CFTC).
The latest COT data is updated through Tuesday April 16th and shows a quick view of how large traders (for-profit speculators and commercial entities) were positioned in the futures markets.
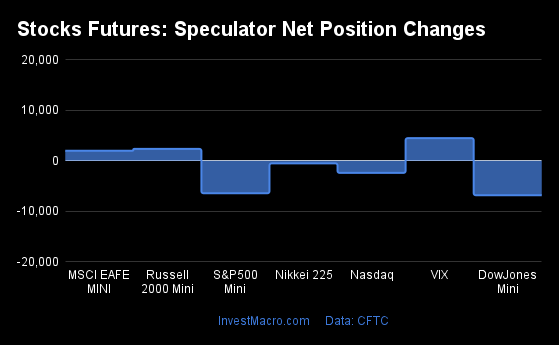
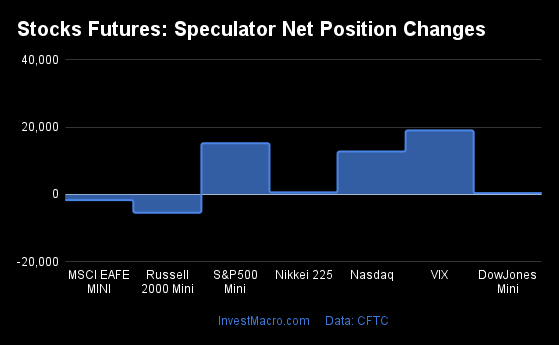
Weekly Speculator Changes led by S&P500-Mini
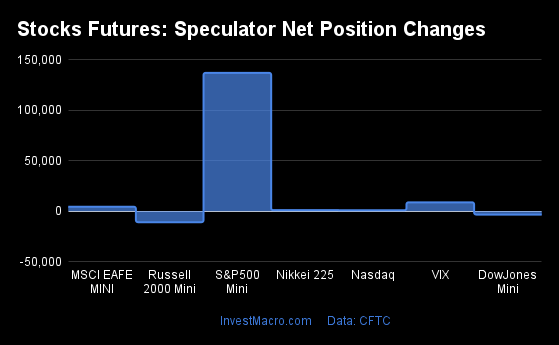
The COT stock markets speculator bets were higher this week as five out of the seven stock markets we cover had higher positioning while the other two markets had lower speculator contracts.
Leading the gains for the stock markets was the S&P500-Mini with a huge jump by 137,028 contracts followed by the VIX (8,848 contracts), the MSCI EAFE-Mini (4,472 contracts), the Nikkei 225 (1,062 contracts) and with the Nasdaq-Mini (986 contracts) rounding out the positive weeks.
The markets with the declines in speculator bets this week were the Russell 2000 Mini (-10,835 contracts) and the DowJones-Mini (-3,282 contracts) also seeing lower spec bets for the week.
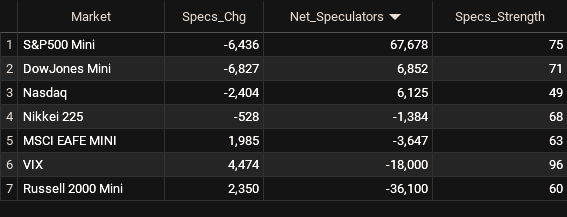
Net Speculators Leaderboard
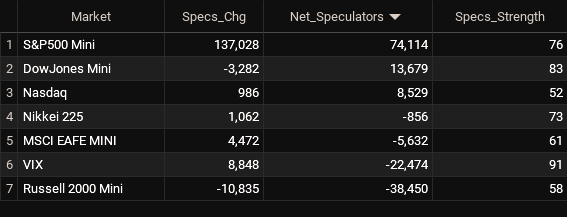
Legend: Weekly Speculators Change | Speculators Current Net Position | Speculators Strength Score compared to last 3-Years (0-100 range)
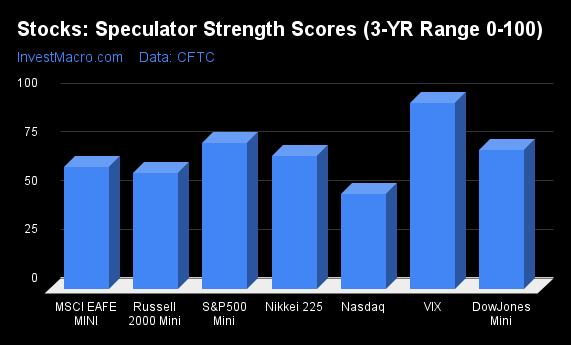
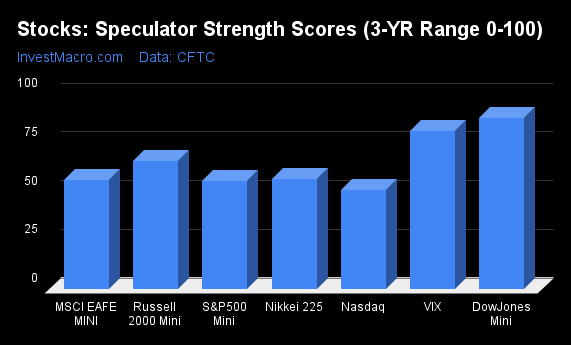
Strength Scores led by VIX & DowJones-Mini
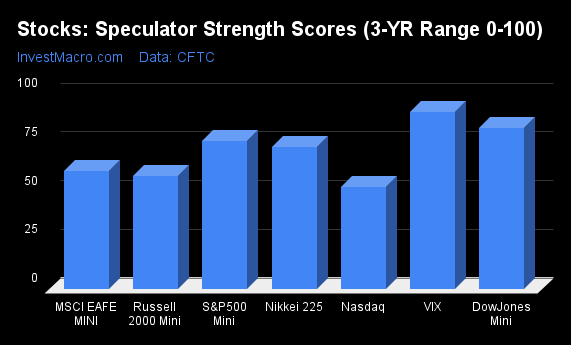
COT Strength Scores (a normalized measure of Speculator positions over a 3-Year range, from 0 to 100 where above 80 is Extreme-Bullish and below 20 is Extreme-Bearish) showed that the VIX (91 percent) and the DowJones-Mini (83 percent) led the stock markets this week. The S&P500-Mini (76 percent) and the Nikkei 225 (73 percent) come in as the next highest in the weekly strength scores.
On the downside, the Nasdaq-Mini (52 percent) is at the lowest strength level currently out of the stock markets.
Strength Statistics:
VIX (90.8 percent) vs VIX previous week (81.2 percent)
S&P500-Mini (75.8 percent) vs S&P500-Mini previous week (55.4 percent)
DowJones-Mini (82.5 percent) vs DowJones-Mini previous week (87.9 percent)
Nasdaq-Mini (52.4 percent) vs Nasdaq-Mini previous week (50.8 percent)
Russell2000-Mini (57.8 percent) vs Russell2000-Mini previous week (65.5 percent)
Nikkei USD (72.9 percent) vs Nikkei USD previous week (63.8 percent)
EAFE-Mini (60.6 percent) vs EAFE-Mini previous week (56.0 percent)
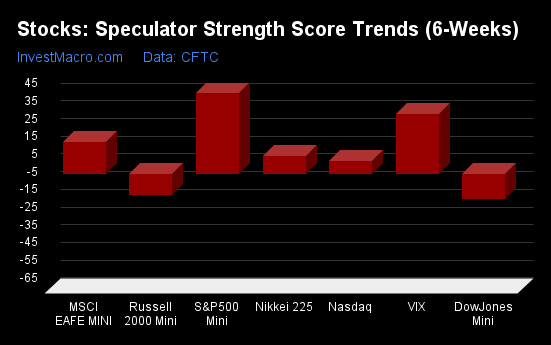
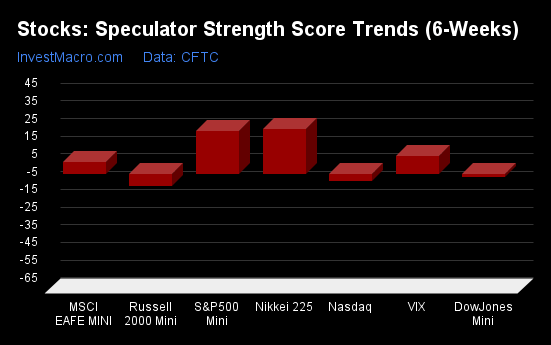
S&P500-Mini tops the 6-Week Strength Trends
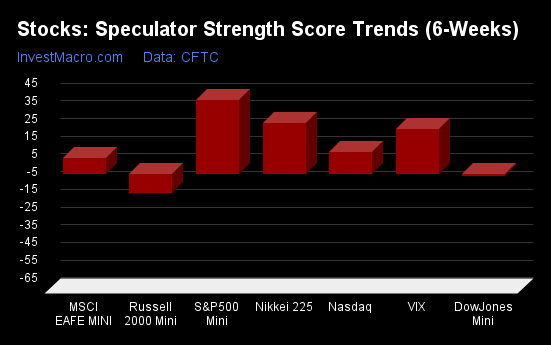
COT Strength Score Trends (or move index, calculates the 6-week changes in strength scores) showed that the S&P500-Mini (42 percent) leads the past six weeks trends for the stock markets. The Nikkei 225 (28 percent), the VIX (25 percent) and the Nasdaq-Mini (12 percent) are the next highest positive movers in the latest trends data.
The Russell-Mini (-11 percent) leads the downside trend scores currently with the DowJones-Mini (-2 percent) coming in as the next market with lower trend scores.
Strength Trend Statistics:
VIX (25.4 percent) vs VIX previous week (10.2 percent)
S&P500-Mini (41.5 percent) vs S&P500-Mini previous week (24.1 percent)
DowJones-Mini (-1.5 percent) vs DowJones-Mini previous week (-2.0 percent)
Nasdaq-Mini (12.2 percent) vs Nasdaq-Mini previous week (-4.2 percent)
Russell2000-Mini (-11.1 percent) vs Russell2000-Mini previous week (-6.7 percent)
Nikkei USD (28.5 percent) vs Nikkei USD previous week (28.8 percent)
EAFE-Mini (8.9 percent) vs EAFE-Mini previous week (6.8 percent)
Individual Stock Market Charts:
VIX Volatility Futures:
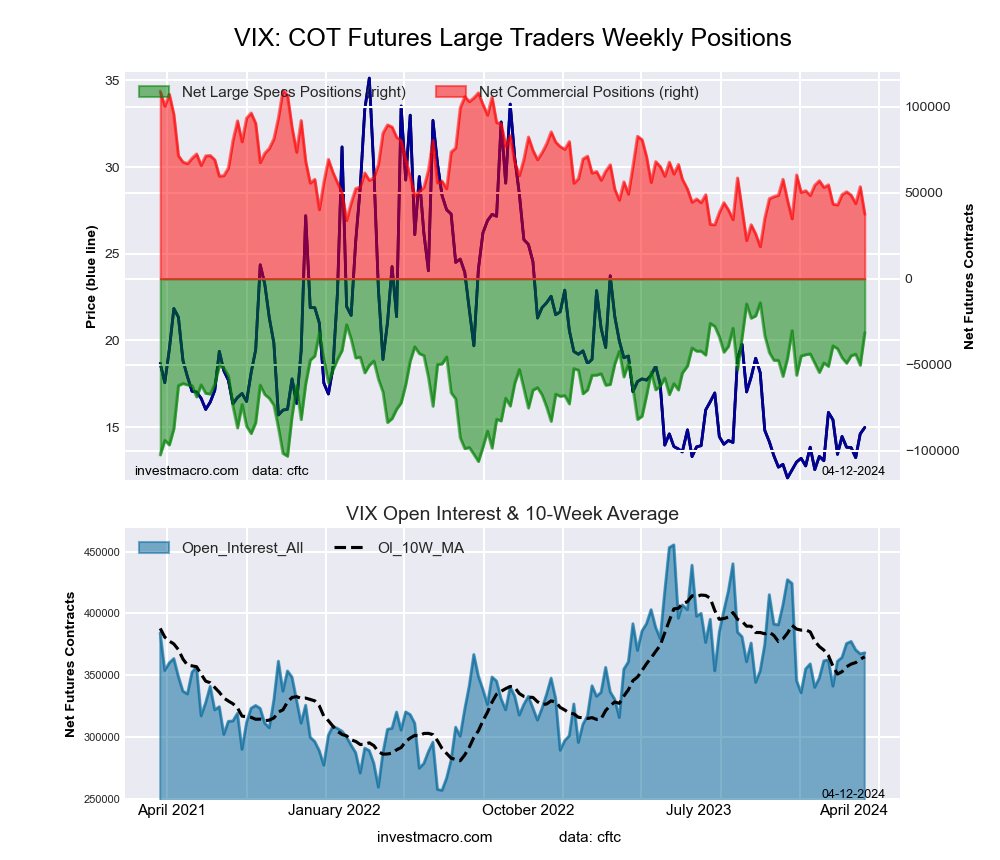
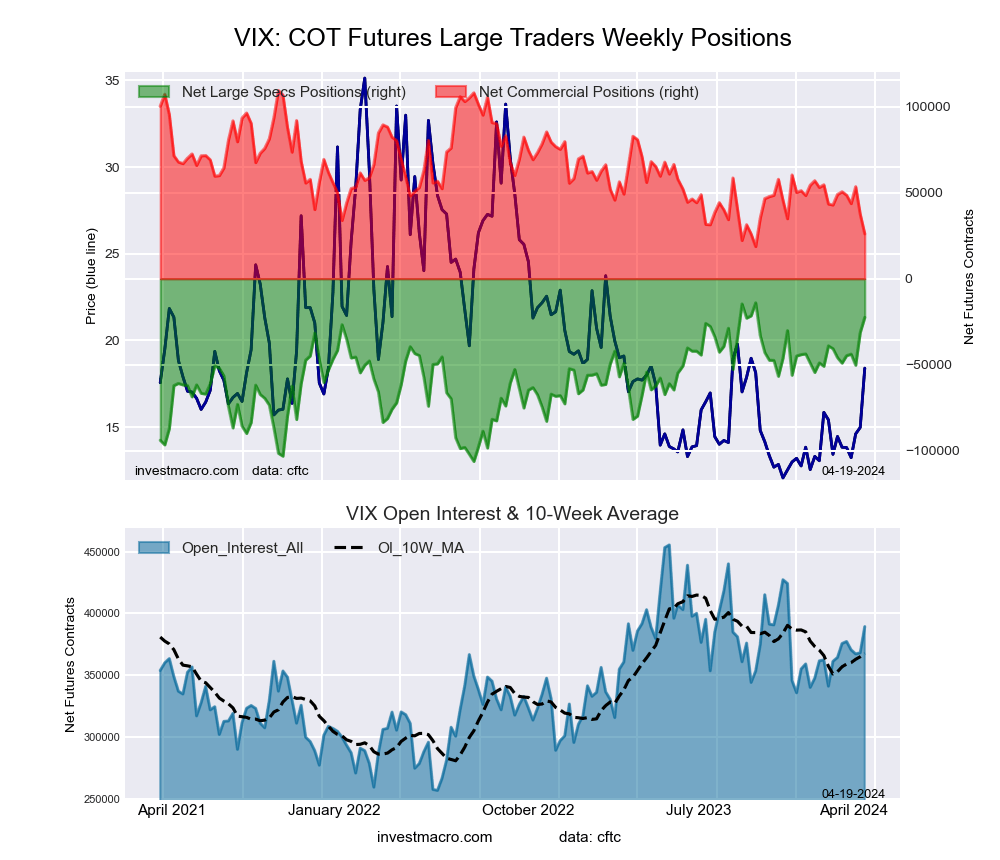 The VIX Volatility large speculator standing this week came in at a net position of -22,474 contracts in the data reported through Tuesday. This was a weekly increase of 8,848 contracts from the previous week which had a total of -31,322 net contracts.
This week’s current strength score (the trader positioning range over the past three years, measured from 0 to 100) shows the speculators are currently Bullish-Extreme with a score of 90.8 percent. The commercials are Bearish-Extreme with a score of 8.1 percent and the small traders (not shown in chart) are Bullish with a score of 77.9 percent.
Price Trend-Following Model: Strong Uptrend
Our weekly trend-following model classifies the current market price position as: Strong Uptrend. The current action for the model is considered to be: Hold – Maintain Long Position.
| VIX Volatility Futures Statistics | SPECULATORS | COMMERCIALS | SMALL TRADERS |
| – Percent of Open Interest Longs: | 24.5 | 42.2 | 6.7 |
| – Percent of Open Interest Shorts: | 30.2 | 35.5 | 7.6 |
| – Net Position: | -22,474 | 26,113 | -3,639 |
| – Gross Longs: | 95,276 | 164,265 | 25,933 |
| – Gross Shorts: | 117,750 | 138,152 | 29,572 |
| – Long to Short Ratio: | 0.8 to 1 | 1.2 to 1 | 0.9 to 1 |
| NET POSITION TREND: | | | |
| – Strength Index Score (3 Year Range Pct): | 90.8 | 8.1 | 77.9 |
| – Strength Index Reading (3 Year Range): | Bullish-Extreme | Bearish-Extreme | Bullish |
| NET POSITION MOVEMENT INDEX: | | | |
| – 6-Week Change in Strength Index: | 25.4 | -25.2 | -2.9 |
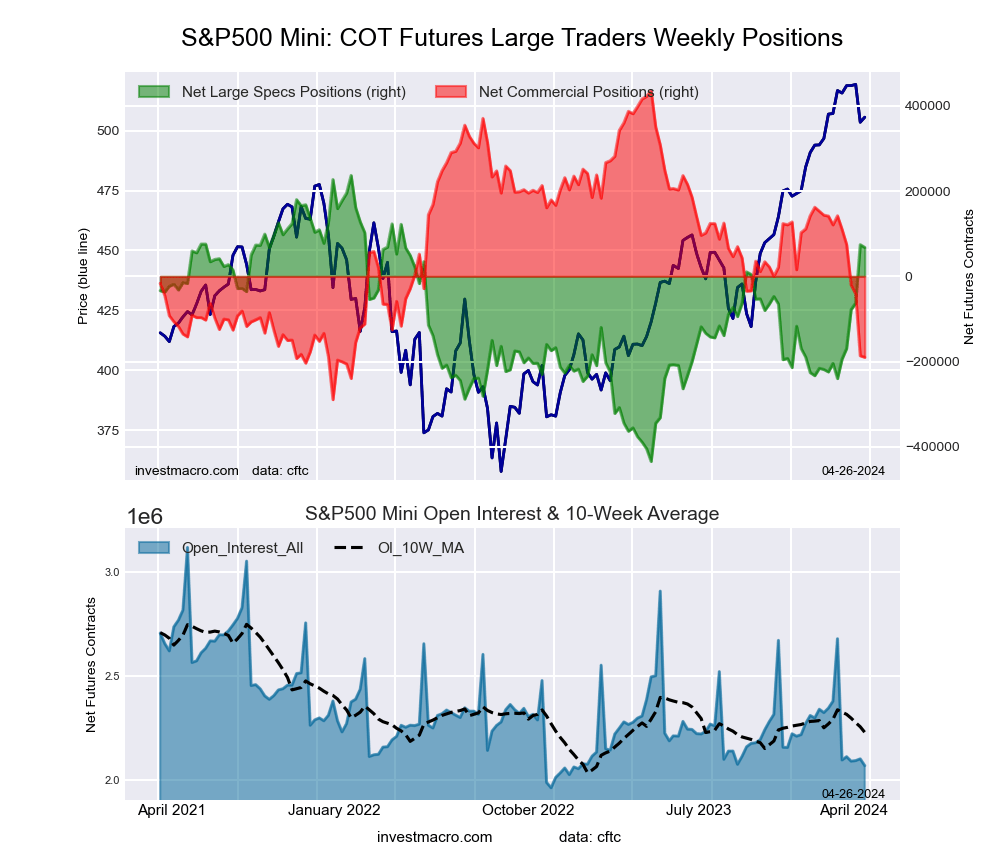
S&P500 Mini Futures:
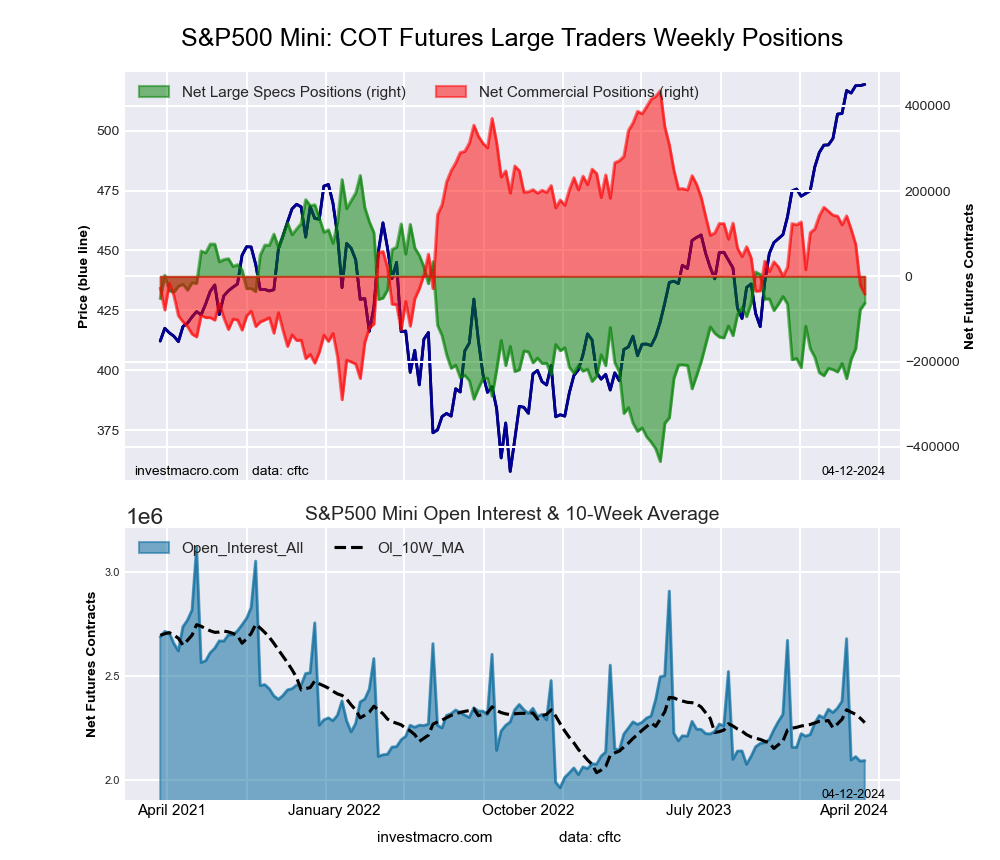
 The S&P500 Mini large speculator standing this week came in at a net position of 74,114 contracts in the data reported through Tuesday. This was a weekly lift of 137,028 contracts from the previous week which had a total of -62,914 net contracts.
This week’s current strength score (the trader positioning range over the past three years, measured from 0 to 100) shows the speculators are currently Bullish with a score of 75.8 percent. The commercials are Bearish-Extreme with a score of 14.2 percent and the small traders (not shown in chart) are Bullish-Extreme with a score of 81.7 percent.
Price Trend-Following Model: Uptrend
Our weekly trend-following model classifies the current market price position as: Uptrend. The current action for the model is considered to be: Hold – Maintain Long Position.
| S&P500 Mini Futures Statistics | SPECULATORS | COMMERCIALS | SMALL TRADERS |
| – Percent of Open Interest Longs: | 16.6 | 67.0 | 13.6 |
| – Percent of Open Interest Shorts: | 13.1 | 75.8 | 8.3 |
| – Net Position: | 74,114 | -186,343 | 112,229 |
| – Gross Longs: | 348,567 | 1,406,577 | 286,323 |
| – Gross Shorts: | 274,453 | 1,592,920 | 174,094 |
| – Long to Short Ratio: | 1.3 to 1 | 0.9 to 1 | 1.6 to 1 |
| NET POSITION TREND: | | | |
| – Strength Index Score (3 Year Range Pct): | 75.8 | 14.2 | 81.7 |
| – Strength Index Reading (3 Year Range): | Bullish | Bearish-Extreme | Bullish-Extreme |
| NET POSITION MOVEMENT INDEX: | | | |
| – 6-Week Change in Strength Index: | 41.5 | -42.4 | 11.3 |
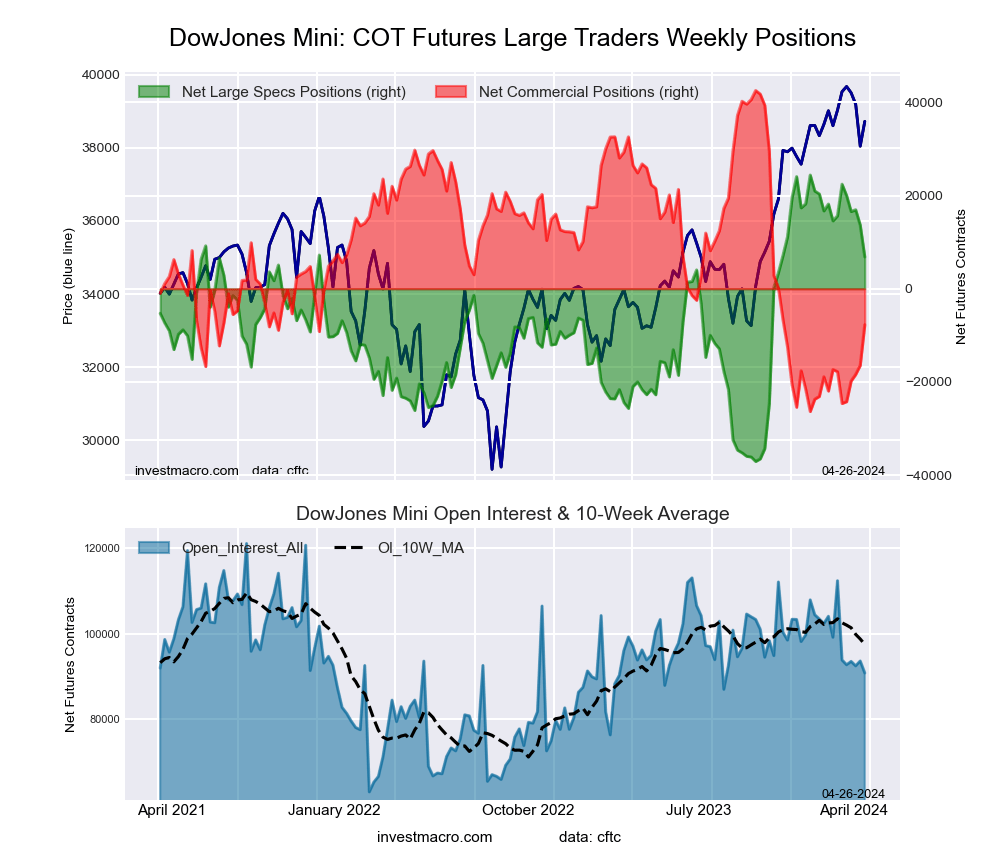
Dow Jones Mini Futures:
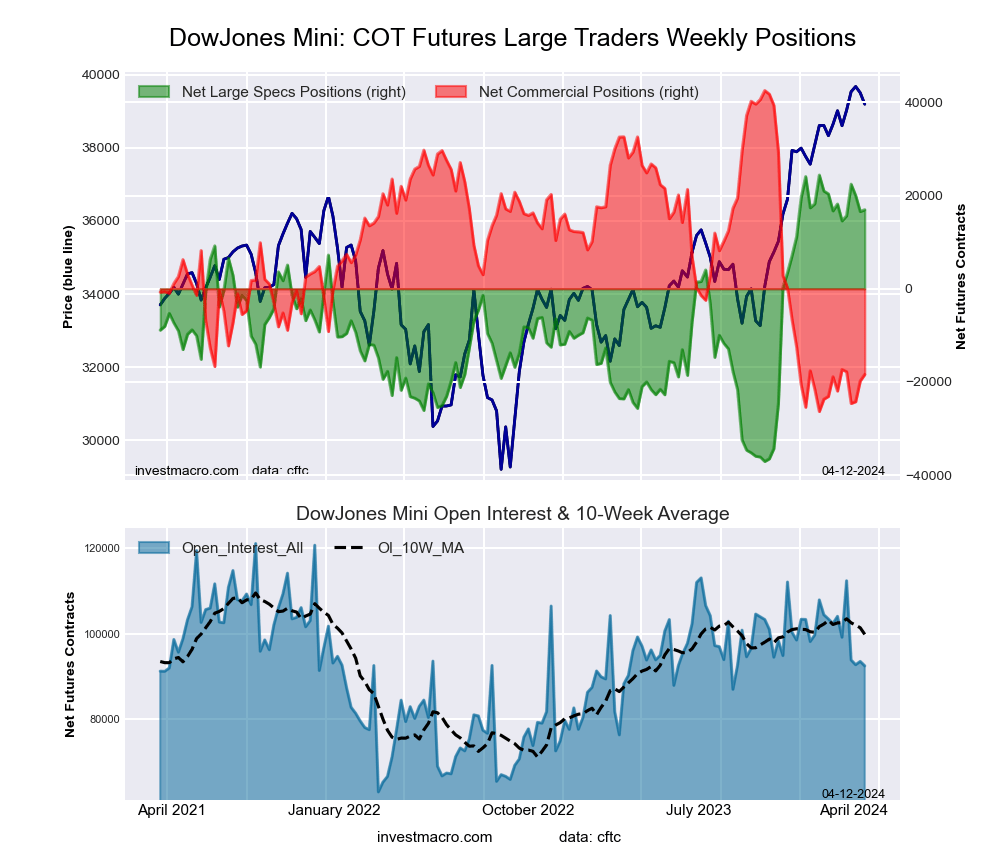
 The Dow Jones Mini large speculator standing this week came in at a net position of 13,679 contracts in the data reported through Tuesday. This was a weekly lowering of -3,282 contracts from the previous week which had a total of 16,961 net contracts.
This week’s current strength score (the trader positioning range over the past three years, measured from 0 to 100) shows the speculators are currently Bullish-Extreme with a score of 82.5 percent. The commercials are Bearish-Extreme with a score of 14.4 percent and the small traders (not shown in chart) are Bullish with a score of 57.4 percent.
Price Trend-Following Model: Weak Uptrend
Our weekly trend-following model classifies the current market price position as: Weak Uptrend. The current action for the model is considered to be: Hold – Maintain Long Position.
| Dow Jones Mini Futures Statistics | SPECULATORS | COMMERCIALS | SMALL TRADERS |
| – Percent of Open Interest Longs: | 25.3 | 56.3 | 15.4 |
| – Percent of Open Interest Shorts: | 10.7 | 73.9 | 12.4 |
| – Net Position: | 13,679 | -16,459 | 2,780 |
| – Gross Longs: | 23,705 | 52,698 | 14,410 |
| – Gross Shorts: | 10,026 | 69,157 | 11,630 |
| – Long to Short Ratio: | 2.4 to 1 | 0.8 to 1 | 1.2 to 1 |
| NET POSITION TREND: | | | |
| – Strength Index Score (3 Year Range Pct): | 82.5 | 14.4 | 57.4 |
| – Strength Index Reading (3 Year Range): | Bullish-Extreme | Bearish-Extreme | Bullish |
| NET POSITION MOVEMENT INDEX: | | | |
| – 6-Week Change in Strength Index: | -1.5 | 1.3 | 0.2 |
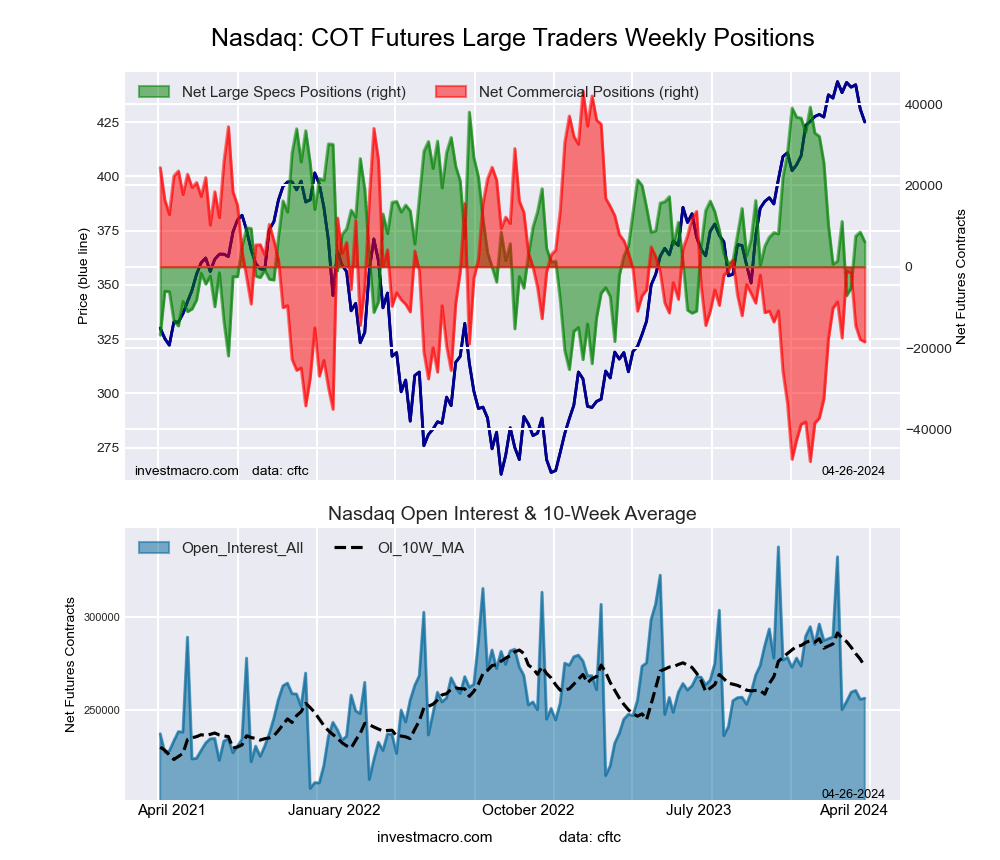
Nasdaq Mini Futures:
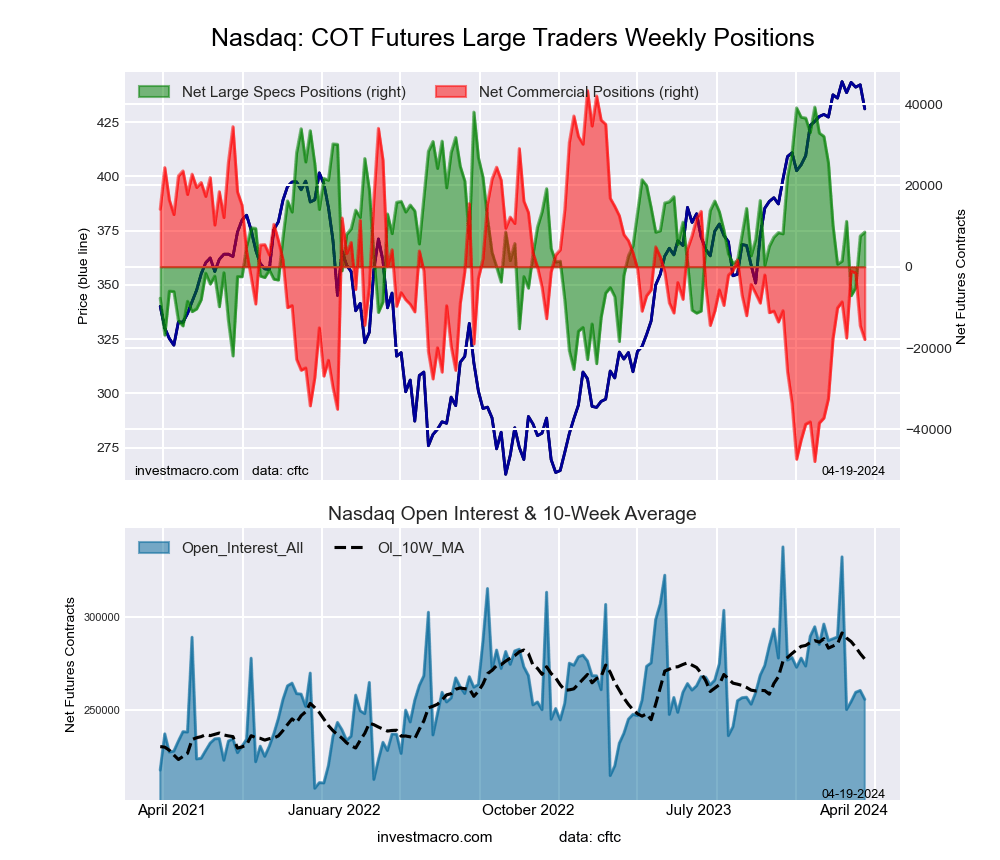 The Nasdaq Mini large speculator standing this week came in at a net position of 8,529 contracts in the data reported through Tuesday. This was a weekly gain of 986 contracts from the previous week which had a total of 7,543 net contracts.
This week’s current strength score (the trader positioning range over the past three years, measured from 0 to 100) shows the speculators are currently Bullish with a score of 52.4 percent. The commercials are Bearish with a score of 32.9 percent and the small traders (not shown in chart) are Bullish-Extreme with a score of 99.6 percent.
Price Trend-Following Model: Weak Uptrend
Our weekly trend-following model classifies the current market price position as: Weak Uptrend. The current action for the model is considered to be: Hold – Maintain Long Position.
| Nasdaq Mini Futures Statistics | SPECULATORS | COMMERCIALS | SMALL TRADERS |
| – Percent of Open Interest Longs: | 25.9 | 55.2 | 16.8 |
| – Percent of Open Interest Shorts: | 22.5 | 62.2 | 13.1 |
| – Net Position: | 8,529 | -17,894 | 9,365 |
| – Gross Longs: | 66,139 | 141,080 | 42,958 |
| – Gross Shorts: | 57,610 | 158,974 | 33,593 |
| – Long to Short Ratio: | 1.1 to 1 | 0.9 to 1 | 1.3 to 1 |
| NET POSITION TREND: | | | |
| – Strength Index Score (3 Year Range Pct): | 52.4 | 32.9 | 99.6 |
| – Strength Index Reading (3 Year Range): | Bullish | Bearish | Bullish-Extreme |
| NET POSITION MOVEMENT INDEX: | | | |
| – 6-Week Change in Strength Index: | 12.2 | -8.5 | -0.4 |
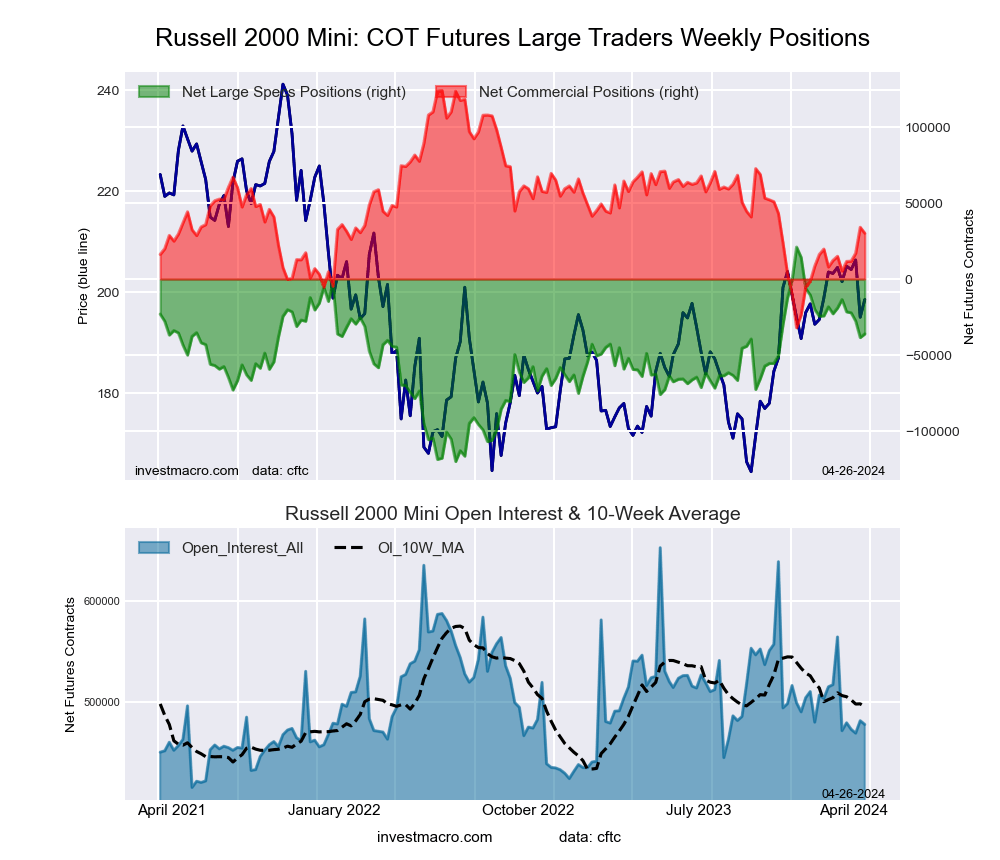
Russell 2000 Mini Futures:
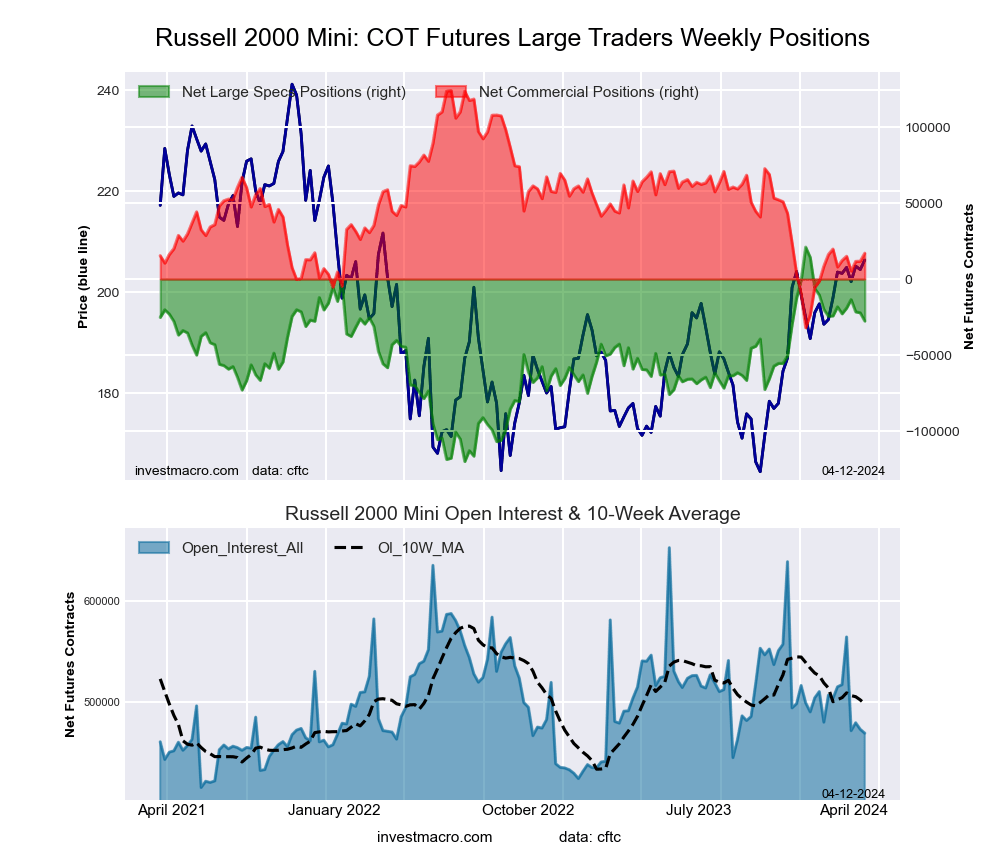
 The Russell 2000 Mini large speculator standing this week came in at a net position of -38,450 contracts in the data reported through Tuesday. This was a weekly decline of -10,835 contracts from the previous week which had a total of -27,615 net contracts.
This week’s current strength score (the trader positioning range over the past three years, measured from 0 to 100) shows the speculators are currently Bullish with a score of 57.8 percent. The commercials are Bearish with a score of 42.3 percent and the small traders (not shown in chart) are Bearish with a score of 43.7 percent.
Price Trend-Following Model: Weak Uptrend
Our weekly trend-following model classifies the current market price position as: Weak Uptrend. The current action for the model is considered to be: Hold – Maintain Long Position.
| Russell 2000 Mini Futures Statistics | SPECULATORS | COMMERCIALS | SMALL TRADERS |
| – Percent of Open Interest Longs: | 15.0 | 77.9 | 5.7 |
| – Percent of Open Interest Shorts: | 23.0 | 70.8 | 4.8 |
| – Net Position: | -38,450 | 34,078 | 4,372 |
| – Gross Longs: | 72,012 | 374,758 | 27,578 |
| – Gross Shorts: | 110,462 | 340,680 | 23,206 |
| – Long to Short Ratio: | 0.7 to 1 | 1.1 to 1 | 1.2 to 1 |
| NET POSITION TREND: | | | |
| – Strength Index Score (3 Year Range Pct): | 57.8 | 42.3 | 43.7 |
| – Strength Index Reading (3 Year Range): | Bullish | Bearish | Bearish |
| NET POSITION MOVEMENT INDEX: | | | |
| – 6-Week Change in Strength Index: | -11.1 | 14.0 | -20.9 |
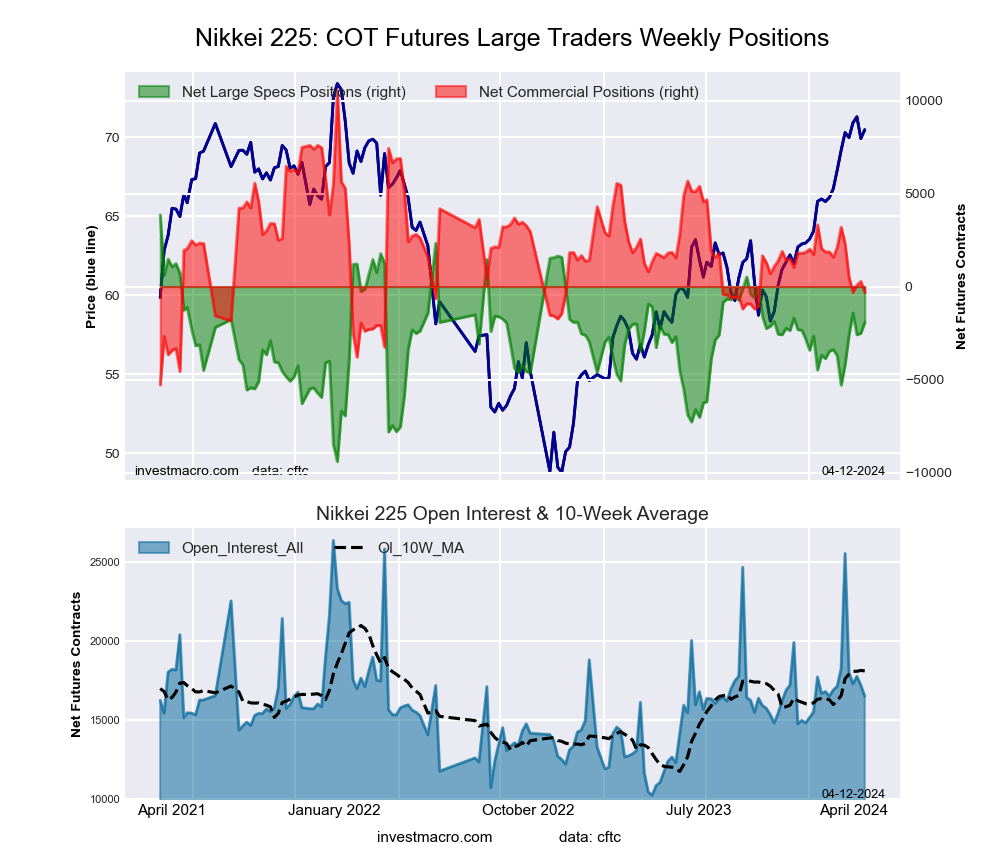
Nikkei Stock Average (USD) Futures:
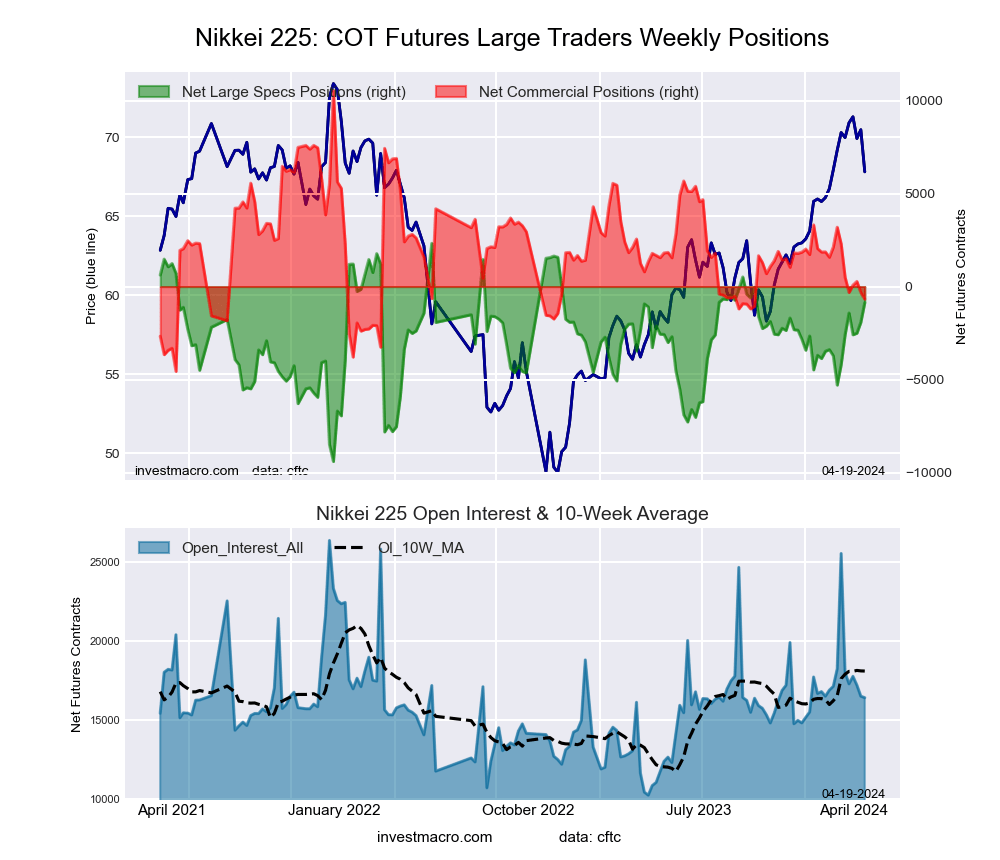 The Nikkei Stock Average (USD) large speculator standing this week came in at a net position of -856 contracts in the data reported through Tuesday. This was a weekly boost of 1,062 contracts from the previous week which had a total of -1,918 net contracts.
This week’s current strength score (the trader positioning range over the past three years, measured from 0 to 100) shows the speculators are currently Bullish with a score of 72.9 percent. The commercials are Bearish with a score of 25.7 percent and the small traders (not shown in chart) are Bullish with a score of 62.0 percent.
Price Trend-Following Model: Weak Uptrend
Our weekly trend-following model classifies the current market price position as: Weak Uptrend. The current action for the model is considered to be: Hold – Maintain Long Position.
| Nikkei Stock Average Futures Statistics | SPECULATORS | COMMERCIALS | SMALL TRADERS |
| – Percent of Open Interest Longs: | 7.7 | 67.5 | 24.8 |
| – Percent of Open Interest Shorts: | 12.9 | 71.6 | 15.5 |
| – Net Position: | -856 | -678 | 1,534 |
| – Gross Longs: | 1,261 | 11,077 | 4,076 |
| – Gross Shorts: | 2,117 | 11,755 | 2,542 |
| – Long to Short Ratio: | 0.6 to 1 | 0.9 to 1 | 1.6 to 1 |
| NET POSITION TREND: | | | |
| – Strength Index Score (3 Year Range Pct): | 72.9 | 25.7 | 62.0 |
| – Strength Index Reading (3 Year Range): | Bullish | Bearish | Bullish |
| NET POSITION MOVEMENT INDEX: | | | |
| – 6-Week Change in Strength Index: | 28.5 | -19.7 | -6.0 |
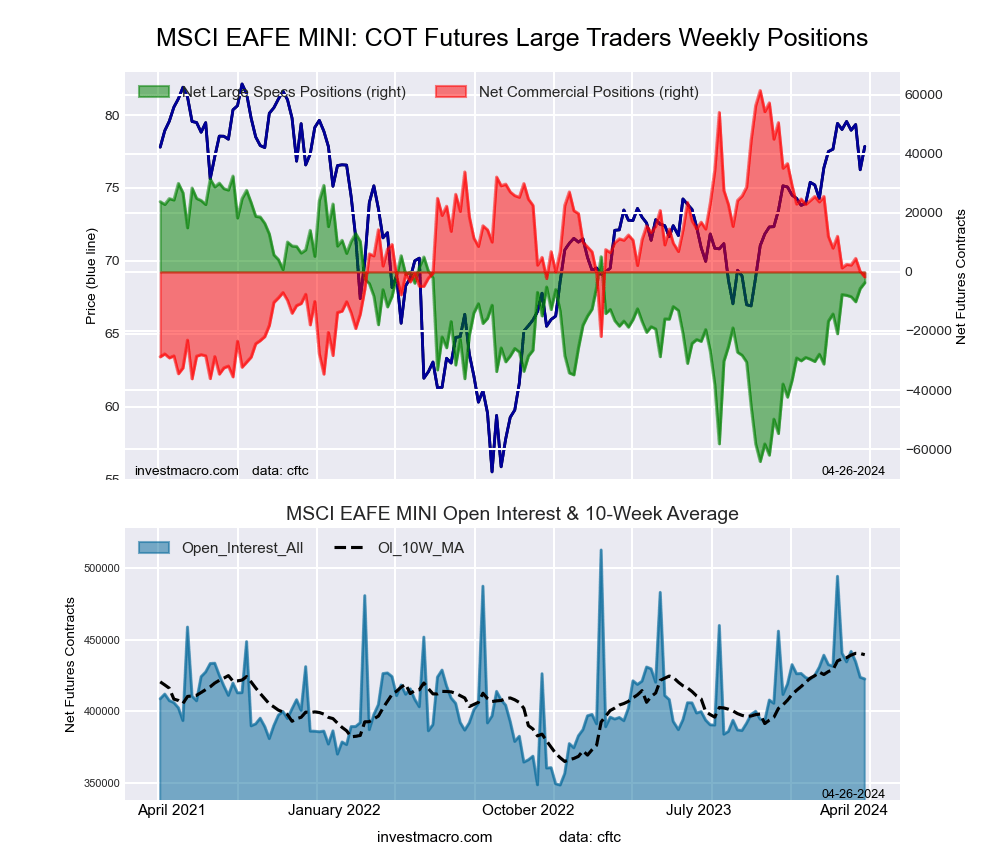
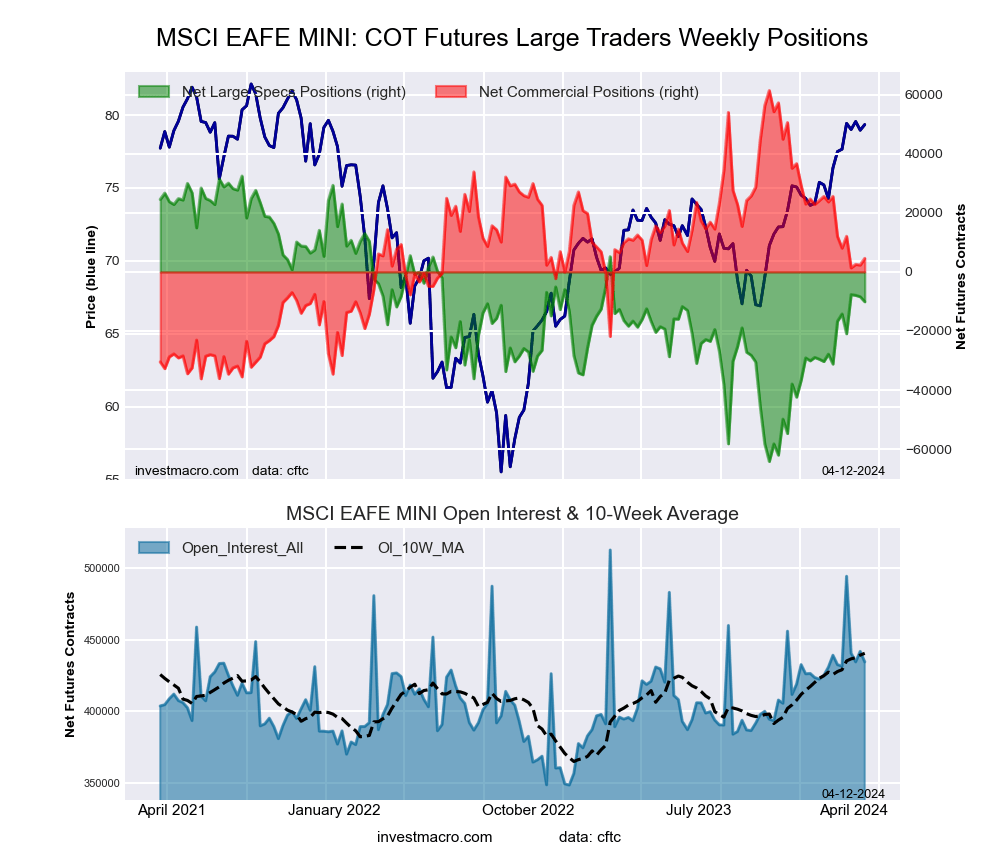
MSCI EAFE Mini Futures:
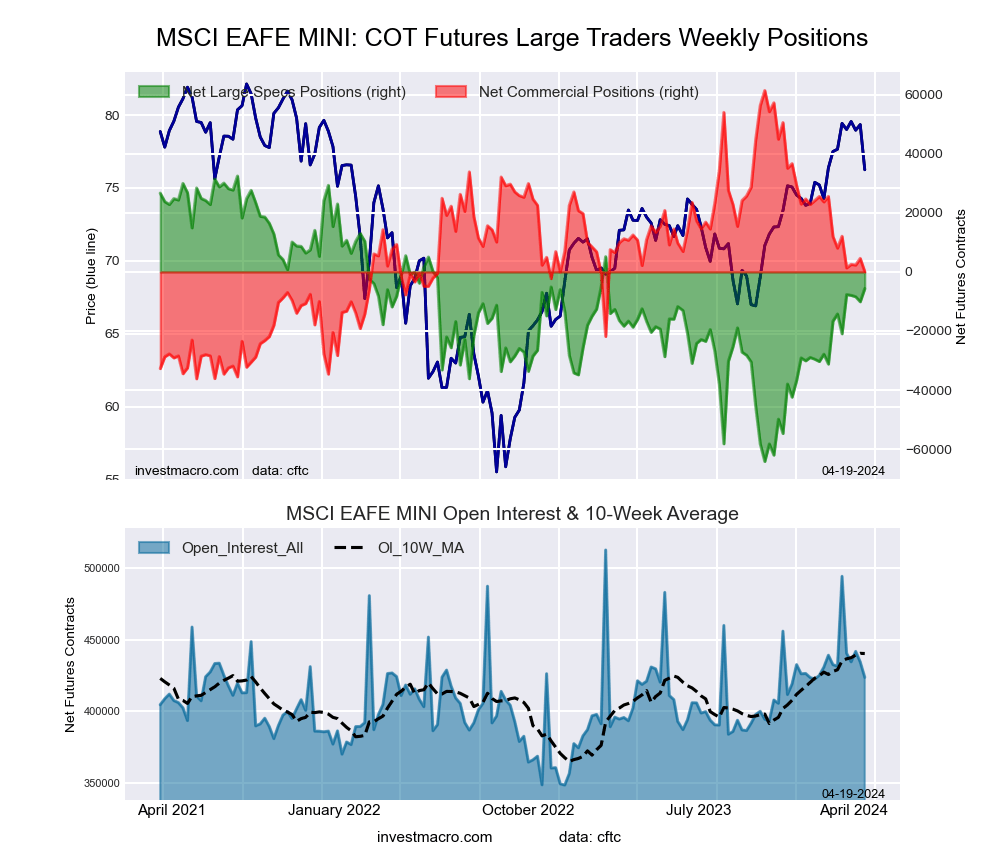 The MSCI EAFE Mini large speculator standing this week came in at a net position of -5,632 contracts in the data reported through Tuesday. This was a weekly rise of 4,472 contracts from the previous week which had a total of -10,104 net contracts.
This week’s current strength score (the trader positioning range over the past three years, measured from 0 to 100) shows the speculators are currently Bullish with a score of 60.6 percent. The commercials are Bearish with a score of 37.2 percent and the small traders (not shown in chart) are Bearish with a score of 44.6 percent.
Price Trend-Following Model: Weak Uptrend
Our weekly trend-following model classifies the current market price position as: Weak Uptrend. The current action for the model is considered to be: Hold – Maintain Long Position.
| MSCI EAFE Mini Futures Statistics | SPECULATORS | COMMERCIALS | SMALL TRADERS |
| – Percent of Open Interest Longs: | 7.3 | 89.6 | 2.6 |
| – Percent of Open Interest Shorts: | 8.6 | 89.6 | 1.3 |
| – Net Position: | -5,632 | 107 | 5,525 |
| – Gross Longs: | 30,948 | 379,673 | 11,200 |
| – Gross Shorts: | 36,580 | 379,566 | 5,675 |
| – Long to Short Ratio: | 0.8 to 1 | 1.0 to 1 | 2.0 to 1 |
| NET POSITION TREND: | | | |
| – Strength Index Score (3 Year Range Pct): | 60.6 | 37.2 | 44.6 |
| – Strength Index Reading (3 Year Range): | Bullish | Bearish | Bearish |
| NET POSITION MOVEMENT INDEX: | | | |
| – 6-Week Change in Strength Index: | 8.9 | -8.1 | -3.3 |
Article By InvestMacro – Receive our weekly COT Newsletter
*COT Report: The COT data, released weekly to the public each Friday, is updated through the most recent Tuesday (data is 3 days old) and shows a quick view of how large speculators or non-commercials (for-profit traders) were positioned in the futures markets.
The CFTC categorizes trader positions according to commercial hedgers (traders who use futures contracts for hedging as part of the business), non-commercials (large traders who speculate to realize trading profits) and nonreportable traders (usually small traders/speculators) as well as their open interest (contracts open in the market at time of reporting). See CFTC criteria here.