
By InvestMacro

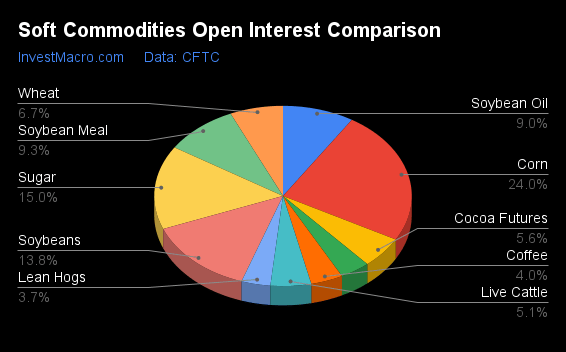
Here are the latest charts and statistics for the Commitment of Traders (COT) reports data published by the Commodities Futures Trading Commission (CFTC).
The latest COT data is updated through Tuesday February 13th and shows a quick view of how large traders (for-profit speculators and commercial entities) were positioned in the futures markets.
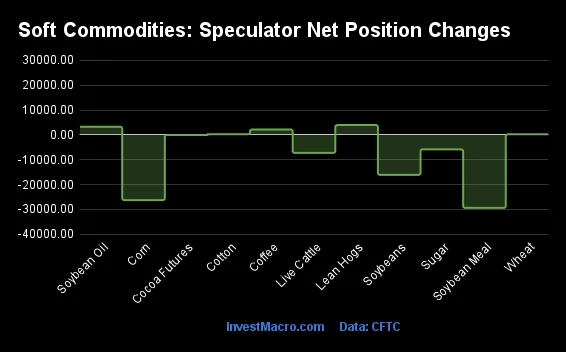
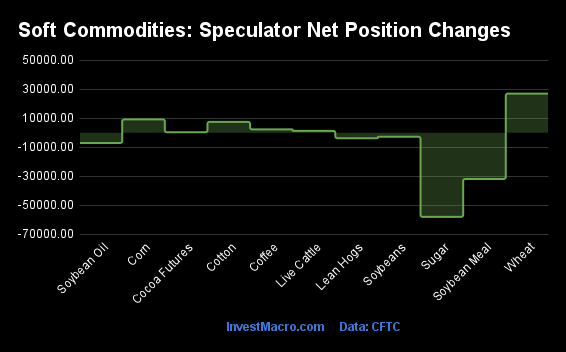
Weekly Speculator Changes led by Cotton & Sugar
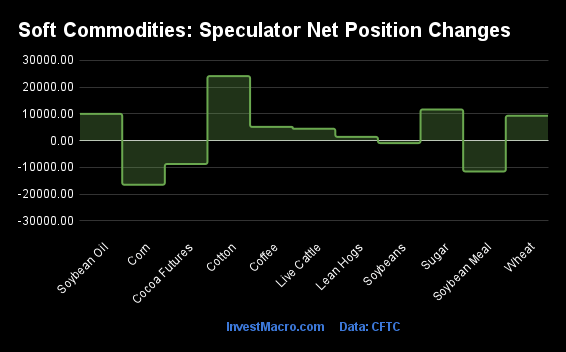
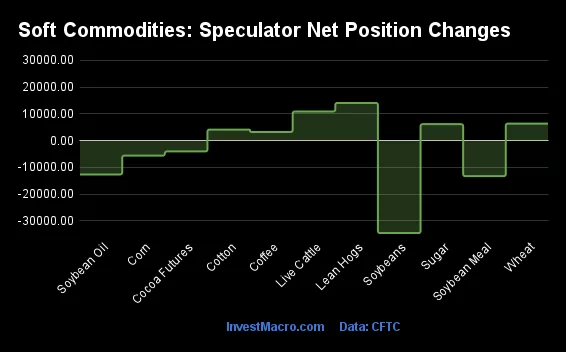
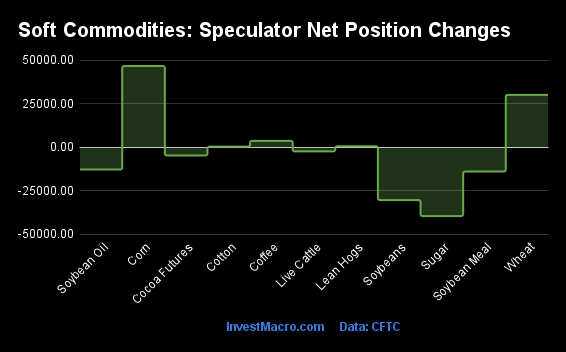
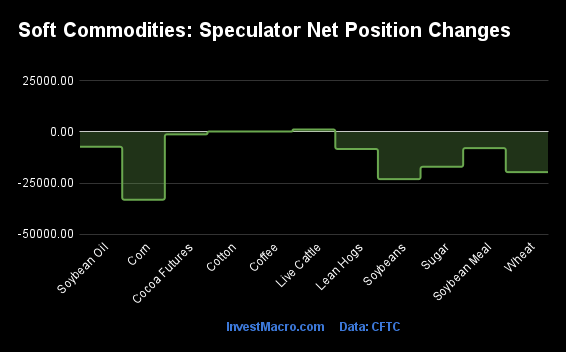
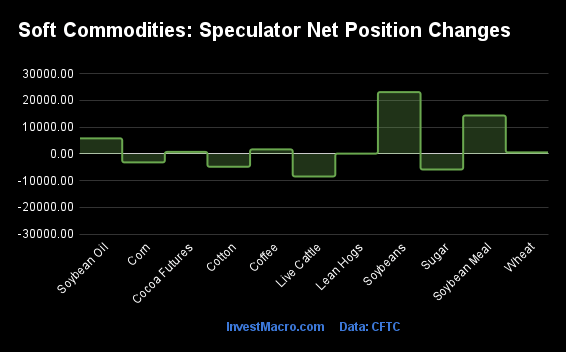
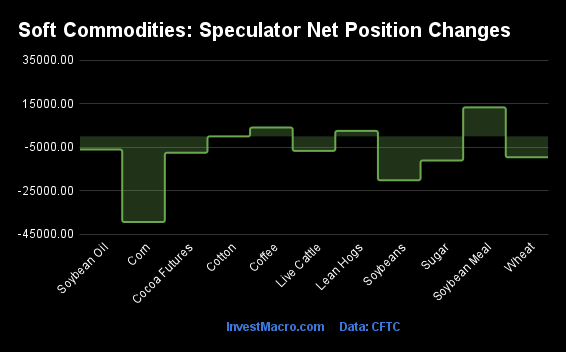
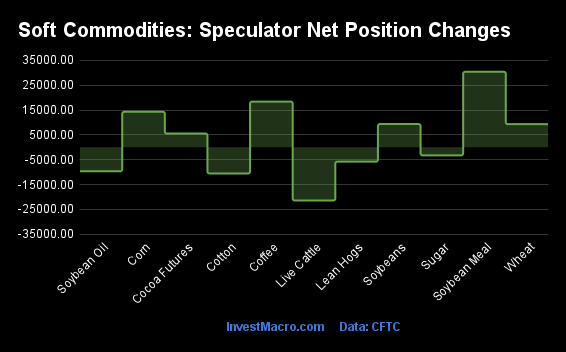
The COT soft commodities markets speculator bets were higher this week as seven out of the eleven softs markets we cover had higher positioning while the other four markets had lower speculator contracts.
Leading the gains for the softs markets was Cotton (24,092 contracts) with Sugar (11,631 contracts), Soybean Oil (9,985 contracts), Wheat (9,277 contracts), Coffee (5,101 contracts), Live Cattle (4,440 contracts) and Lean Hogs (1,384 contracts) also showing positive weeks.
The markets with the declines in speculator bets this week were Corn (-16,517 contracts), Soybean Meal (-11,545 contracts), Cocoa (-8,763 contracts) and Soybeans (-934 contracts) also registering lower bets on the week.
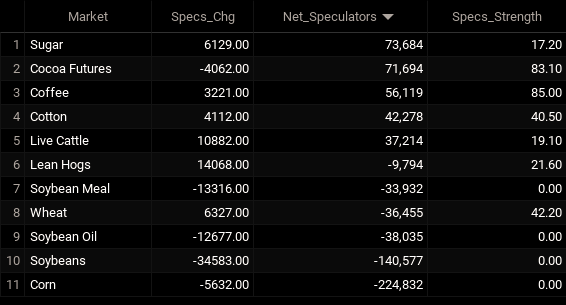
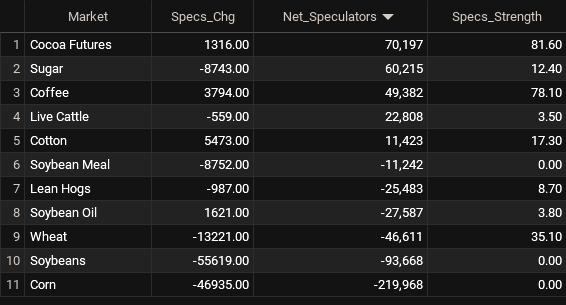
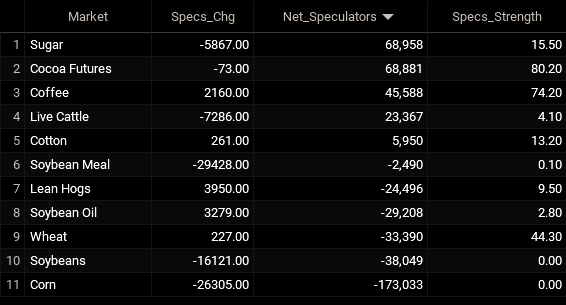
Speculators Leaderboard
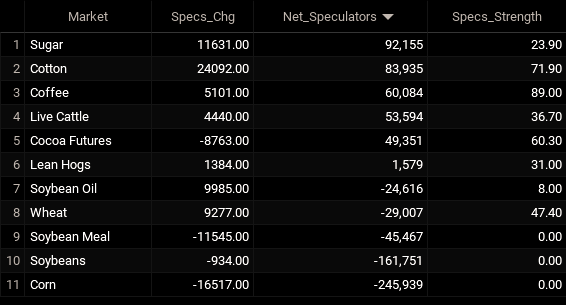
Legend: Weekly Speculators Change | Speculators Current Net Position | Speculators Strength Score compared to last 3-Years (0-100 range)
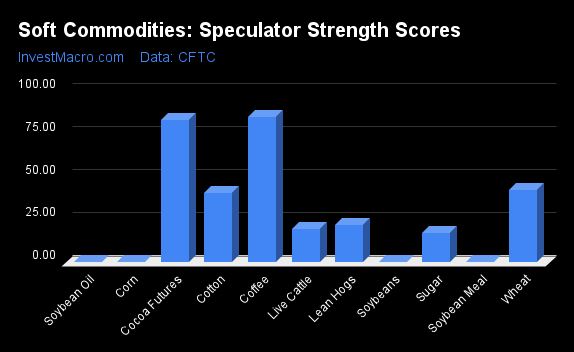
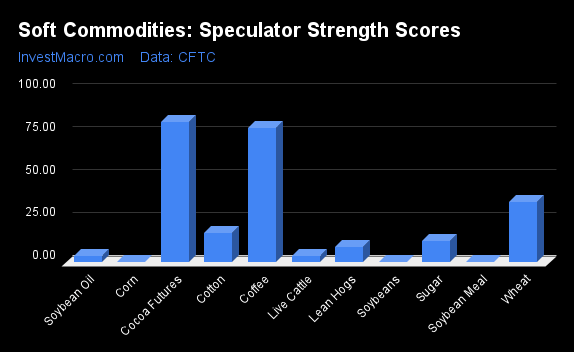
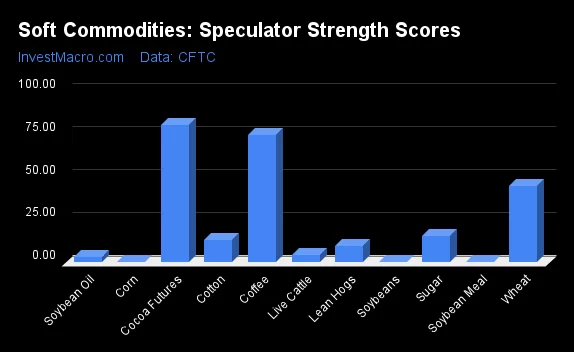
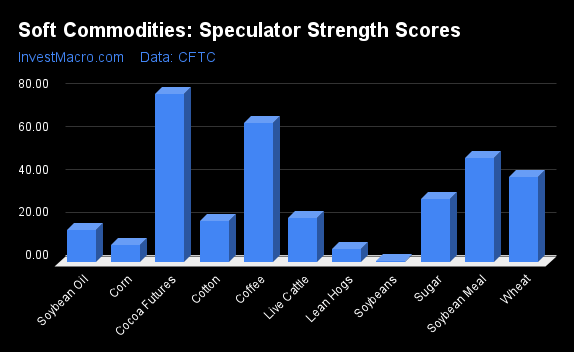
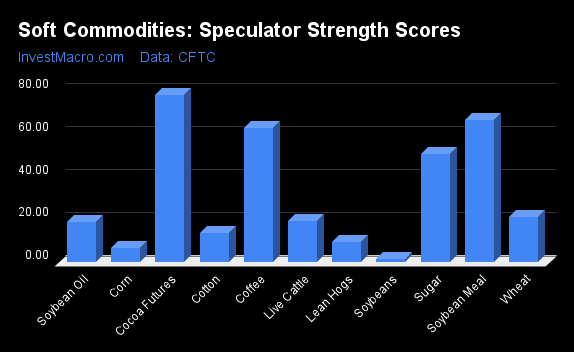
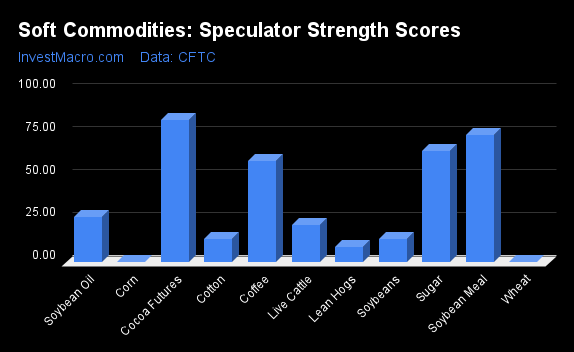
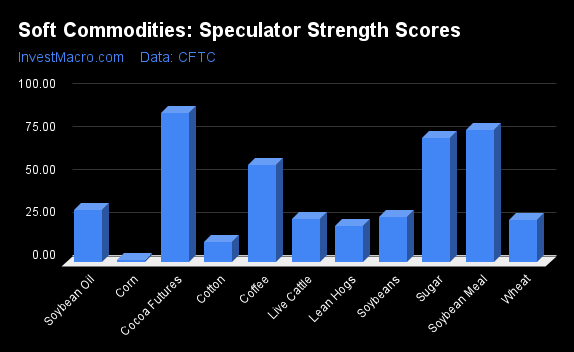
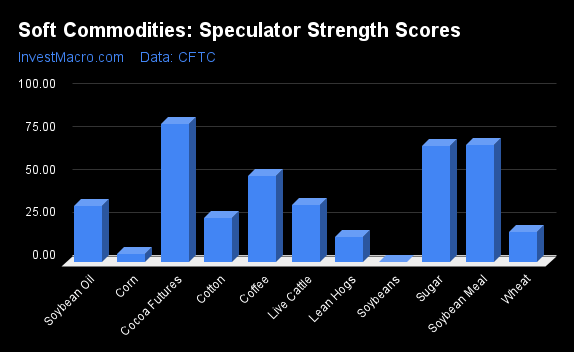
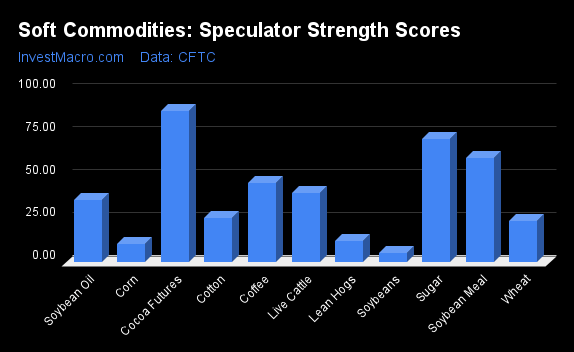
Strength Scores led by Coffee & Cotton
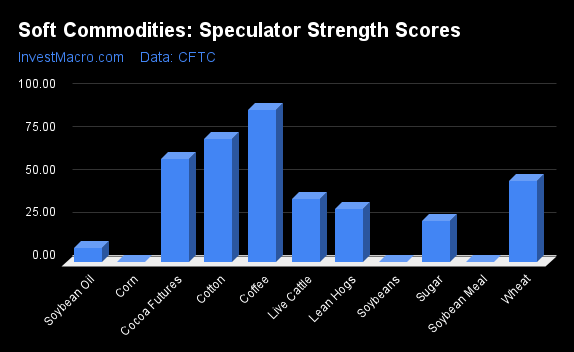
COT Strength Scores (a normalized measure of Speculator positions over a 3-Year range, from 0 to 100 where above 80 is Extreme-Bullish and below 20 is Extreme-Bearish) showed that Coffee (89 percent) and Cotton (72 percent) lead the softs markets this week. Cocoa (60 percent), Wheat (47 percent) comes in as the next highest in the weekly strength scores.
On the downside, Soybean Meal (0 percent), Corn (0 percent), Soybeans (0 percent) and the Soybean Oil (8 percent) come in at the lowest strength levels currently and are in Extreme-Bearish territory (below 20 percent).
Strength Statistics:
Corn (0.0 percent) vs Corn previous week (2.1 percent)
Sugar (23.9 percent) vs Sugar previous week (19.7 percent)
Coffee (89.0 percent) vs Coffee previous week (83.8 percent)
Soybeans (0.0 percent) vs Soybeans previous week (0.2 percent)
Soybean Oil (8.0 percent) vs Soybean Oil previous week (2.1 percent)
Soybean Meal (0.0 percent) vs Soybean Meal previous week (5.2 percent)
Live Cattle (36.7 percent) vs Live Cattle previous week (31.9 percent)
Lean Hogs (31.0 percent) vs Lean Hogs previous week (29.8 percent)
Cotton (71.9 percent) vs Cotton previous week (53.8 percent)
Cocoa (60.3 percent) vs Cocoa previous week (69.2 percent)
Wheat (47.4 percent) vs Wheat previous week (40.9 percent)
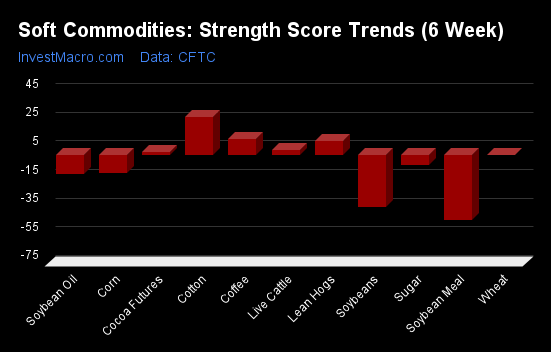
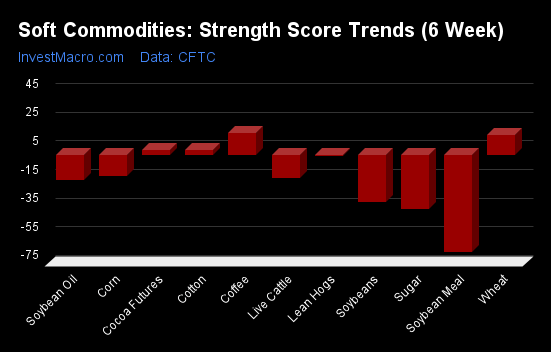
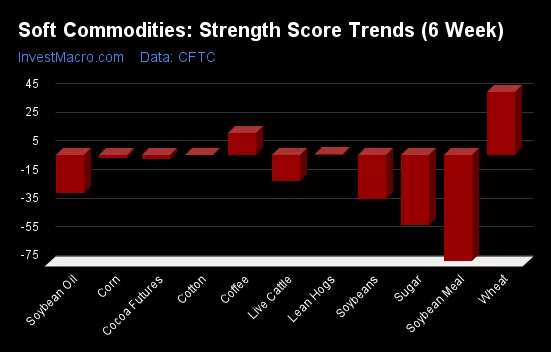
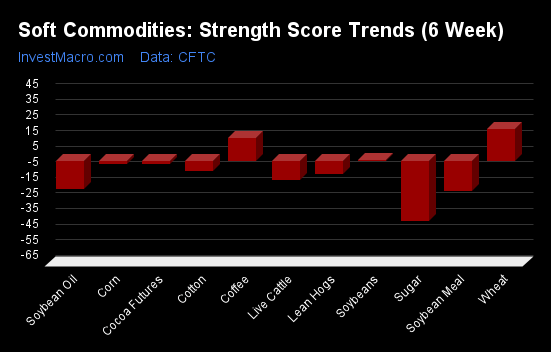
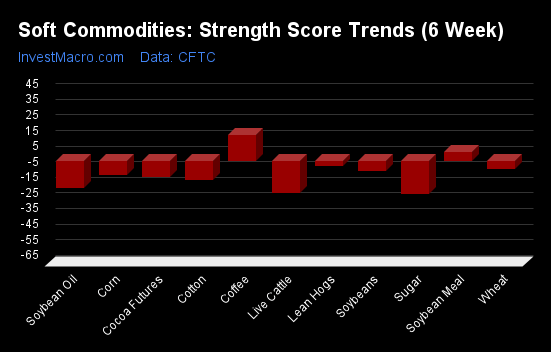
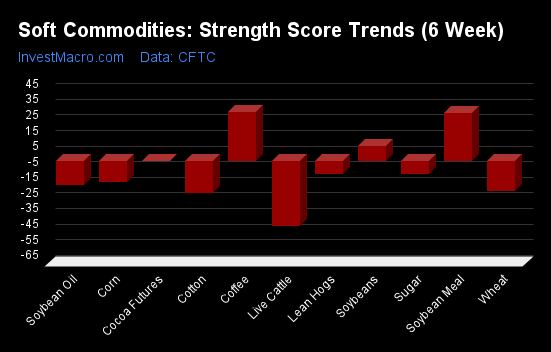
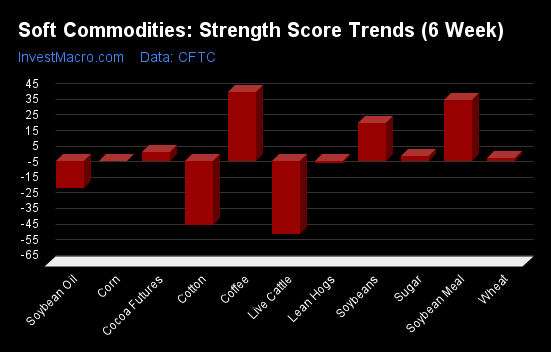
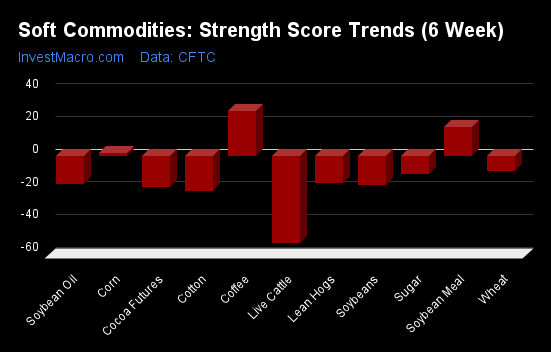
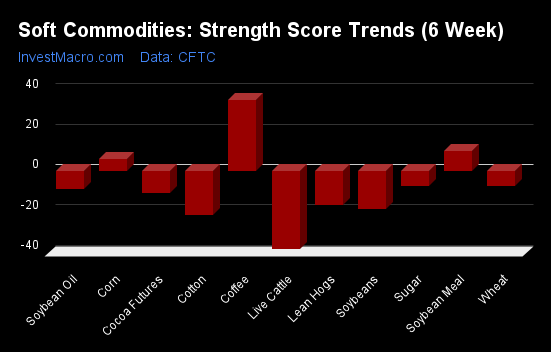
Cotton & Live Cattle top the 6-Week Strength Trends
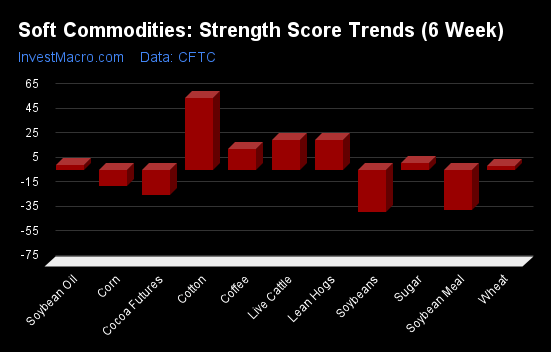
COT Strength Score Trends (or move index, calculates the 6-week changes in strength scores) showed that Cotton (59 percent) and Live Cattle (25 percent) lead the past six weeks trends for soft commodities. Lean Hogs (25 percent), Coffee (17 percent) and Sugar (6 percent) are the next highest positive movers in the latest trends data.
Soybeans (-34 percent) leads the downside trend scores currently with Soybean Meal (-33 percent), Cocoa (-20 percent) and Corn (-13 percent) following next with lower trend scores.
Strength Trend Statistics:
Corn (-12.6 percent) vs Corn previous week (-12.9 percent)
Sugar (6.3 percent) vs Sugar previous week (0.7 percent)
Coffee (17.1 percent) vs Coffee previous week (11.3 percent)
Soybeans (-33.9 percent) vs Soybeans previous week (-36.1 percent)
Soybean Oil (4.7 percent) vs Soybean Oil previous week (-0.5 percent)
Soybean Meal (-32.5 percent) vs Soybean Meal previous week (-33.7 percent)
Live Cattle (24.7 percent) vs Live Cattle previous week (17.6 percent)
Lean Hogs (24.7 percent) vs Lean Hogs previous week (17.6 percent)
Cotton (58.9 percent) vs Cotton previous week (42.3 percent)
Cocoa (-20.0 percent) vs Cocoa previous week (-9.6 percent)
Wheat (3.2 percent) vs Wheat previous week (-4.8 percent)
Individual Soft Commodities Markets:
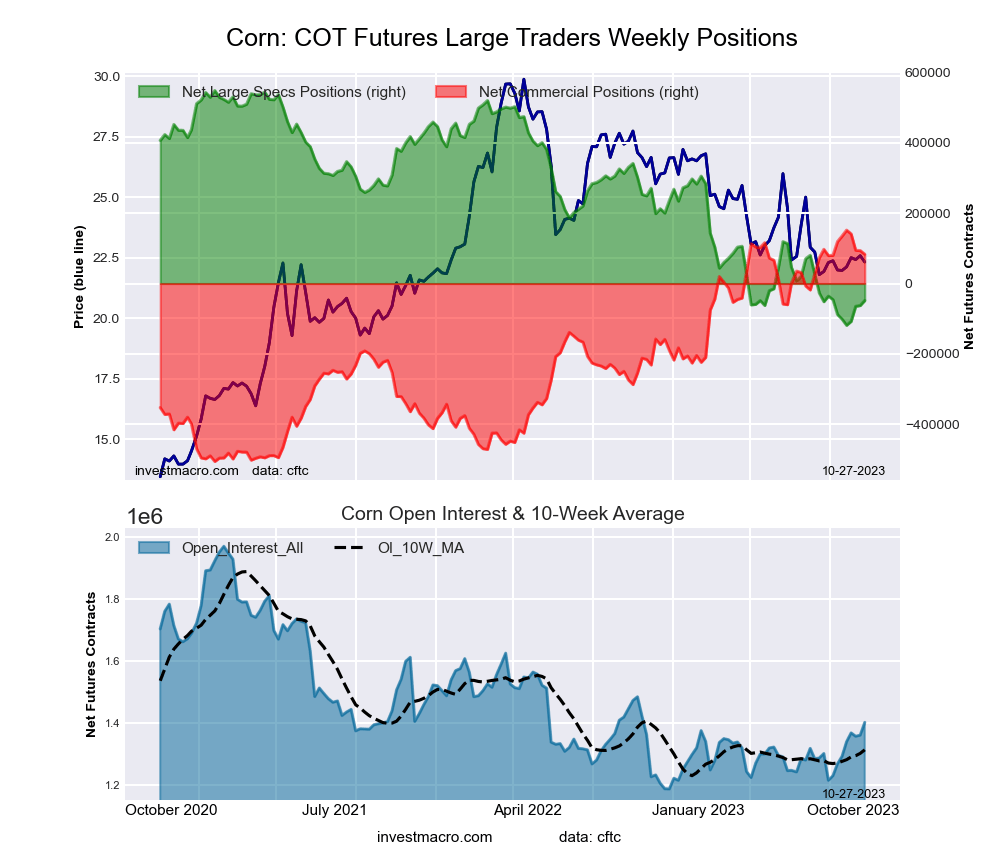
CORN Futures:
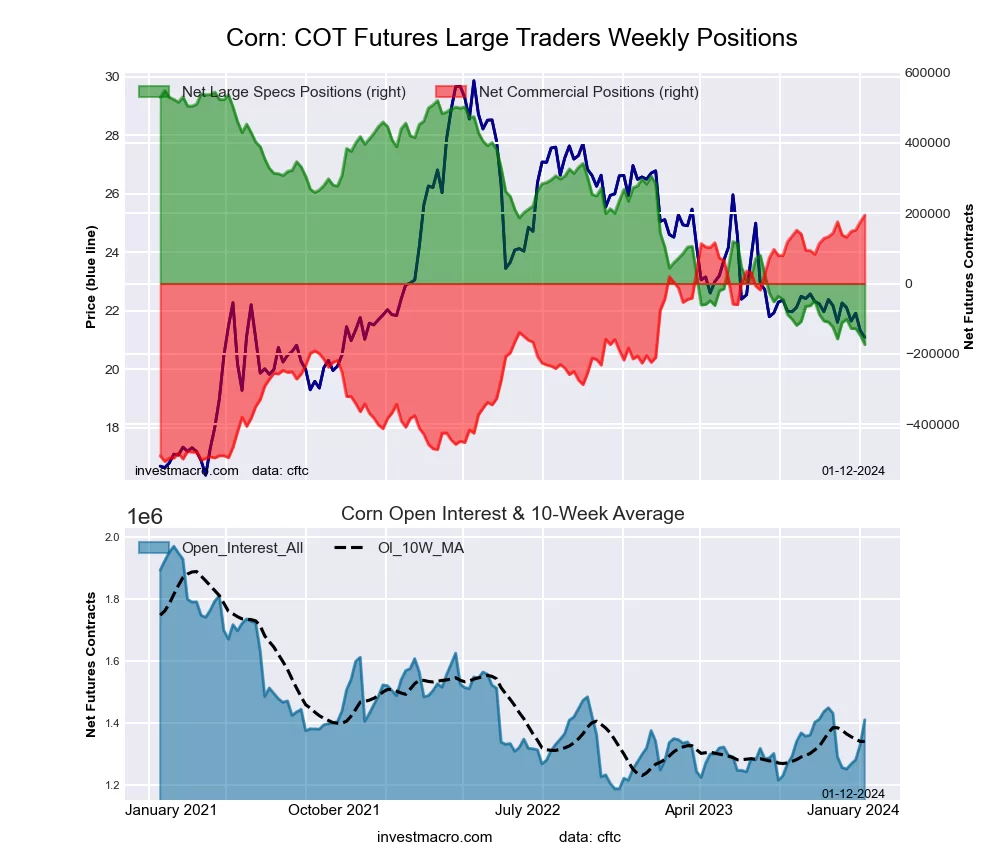
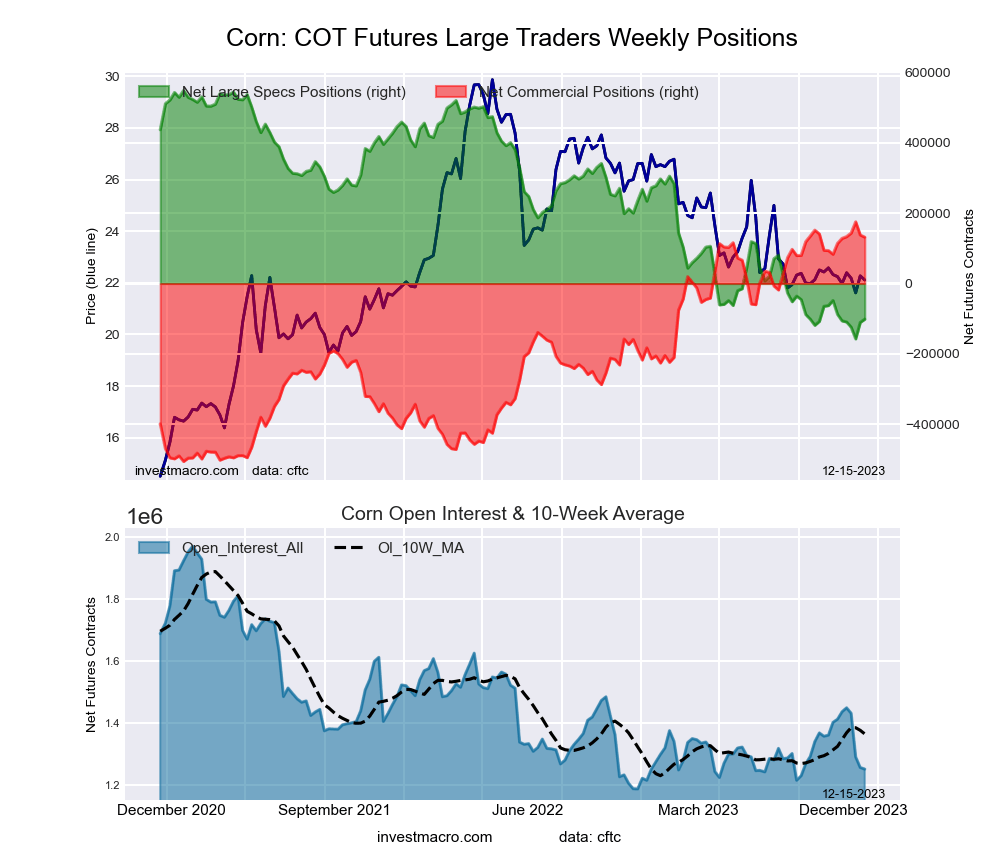
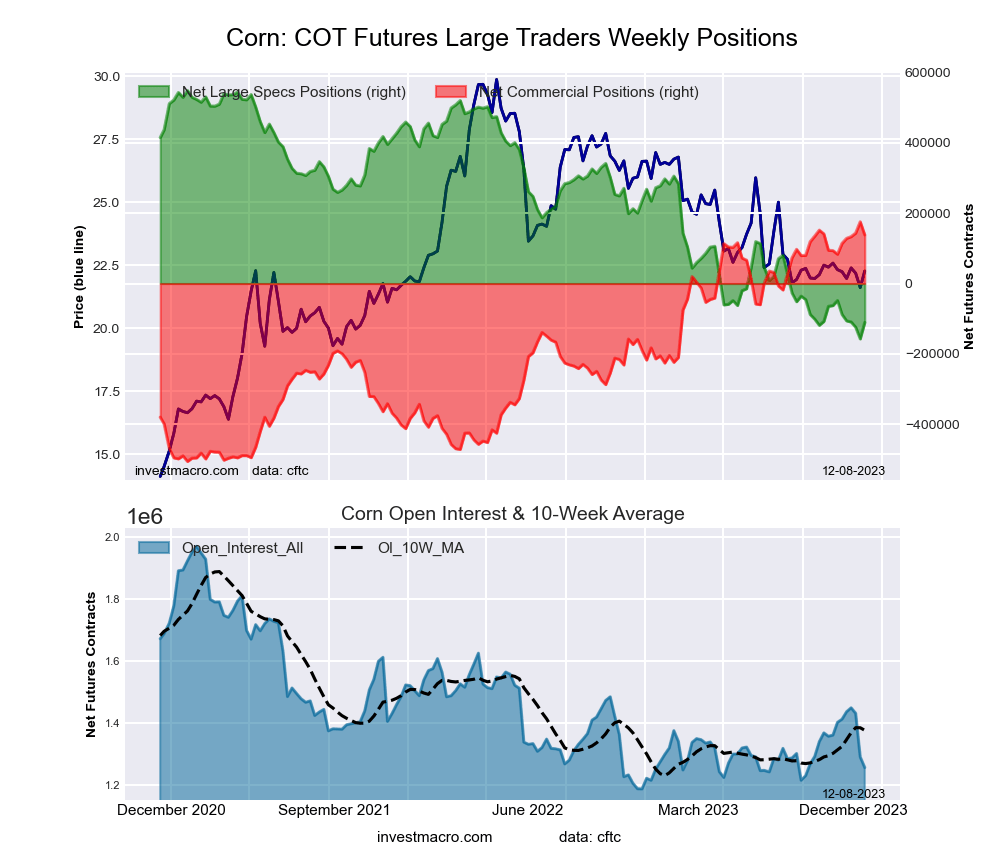
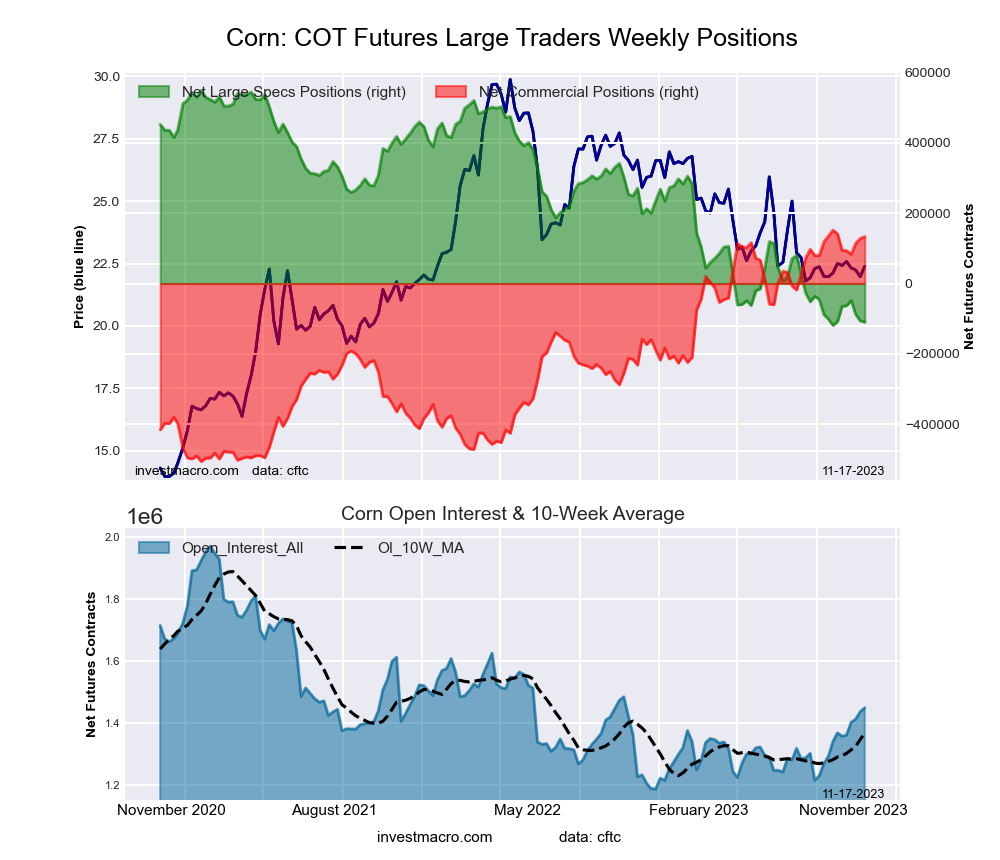
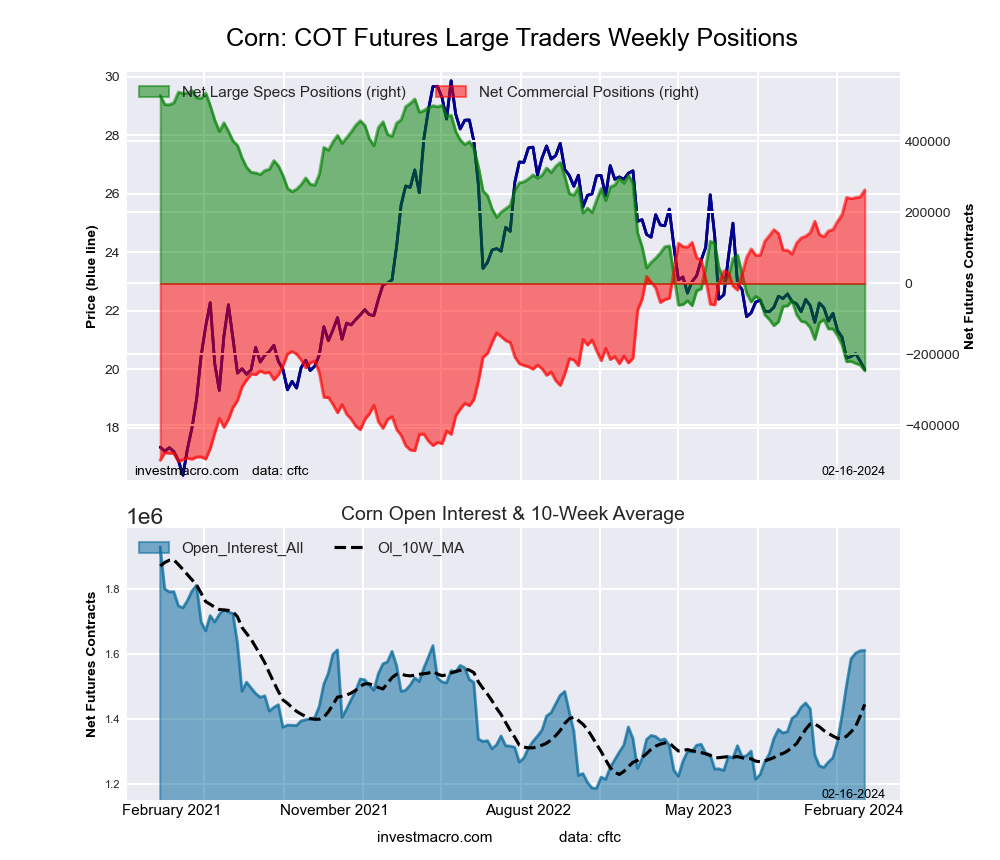 The CORN large speculator standing this week was a net position of -245,939 contracts in the data reported through Tuesday. This was a weekly lowering of -16,517 contracts from the previous week which had a total of -229,422 net contracts.
This week’s current strength score (the trader positioning range over the past three years, measured from 0 to 100) shows the speculators are currently Bearish-Extreme with a score of 0.0 percent. The commercials are Bullish-Extreme with a score of 100.0 percent and the small traders (not shown in chart) are Bullish-Extreme with a score of 95.5 percent.
Price Trend-Following Model: Strong Downtrend
Our weekly trend-following model classifies the current market price position as: Strong Downtrend. The current action for the model is considered to be: Hold – Maintain Short Position.
| CORN Futures Statistics | SPECULATORS | COMMERCIALS | SMALL TRADERS |
| – Percent of Open Interest Longs: | 17.5 | 45.4 | 9.8 |
| – Percent of Open Interest Shorts: | 32.7 | 29.0 | 10.9 |
| – Net Position: | -245,939 | 263,504 | -17,565 |
| – Gross Longs: | 281,214 | 730,978 | 157,423 |
| – Gross Shorts: | 527,153 | 467,474 | 174,988 |
| – Long to Short Ratio: | 0.5 to 1 | 1.6 to 1 | 0.9 to 1 |
| NET POSITION TREND: | |||
| – Strength Index Score (3 Year Range Pct): | 0.0 | 100.0 | 95.5 |
| – Strength Index Reading (3 Year Range): | Bearish-Extreme | Bullish-Extreme | Bullish-Extreme |
| NET POSITION MOVEMENT INDEX: | |||
| – 6-Week Change in Strength Index: | -12.6 | 11.6 | 16.2 |
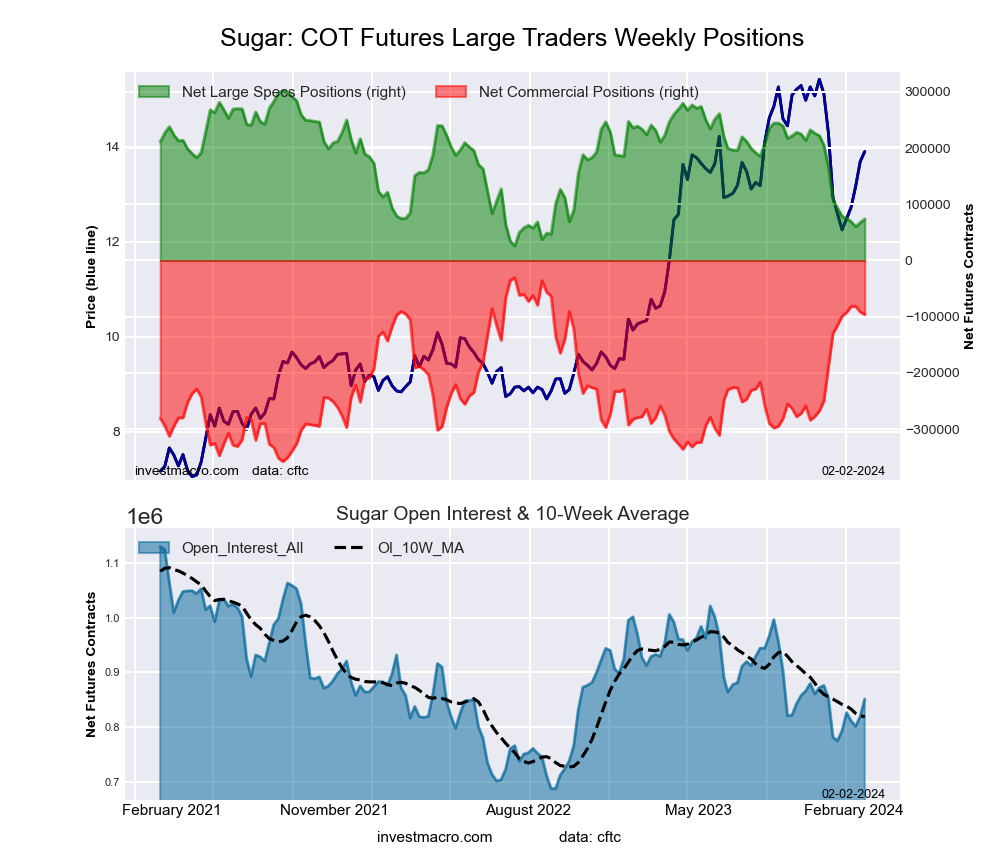
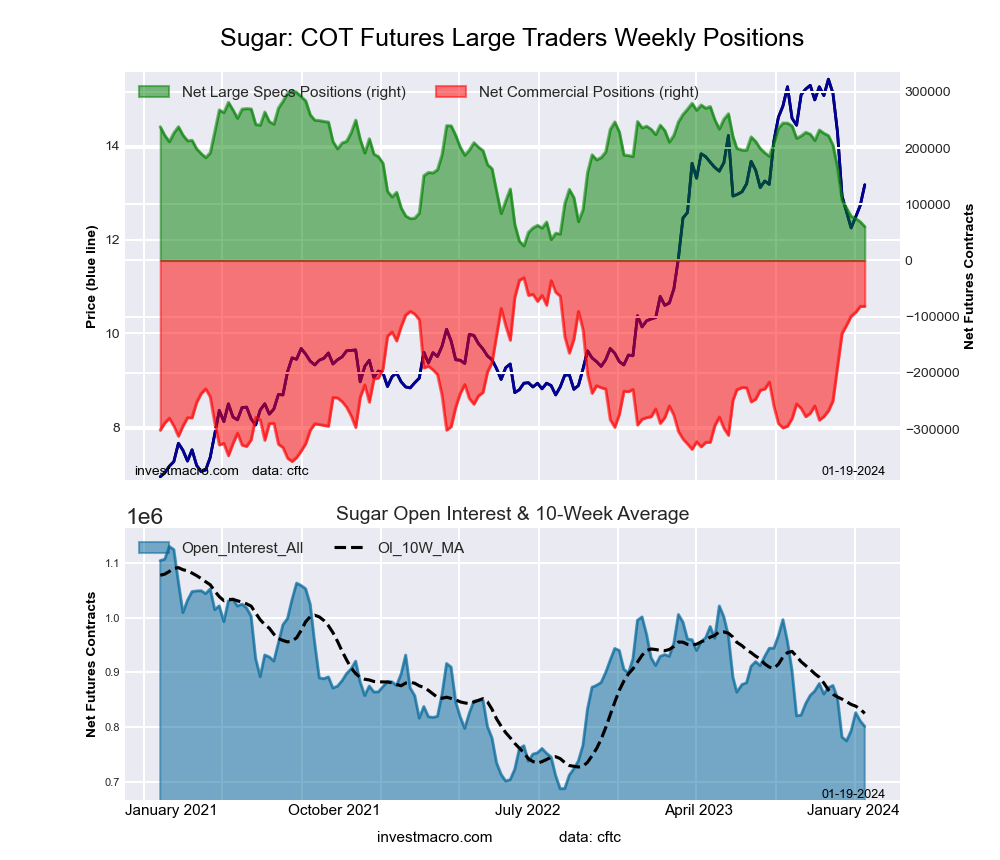
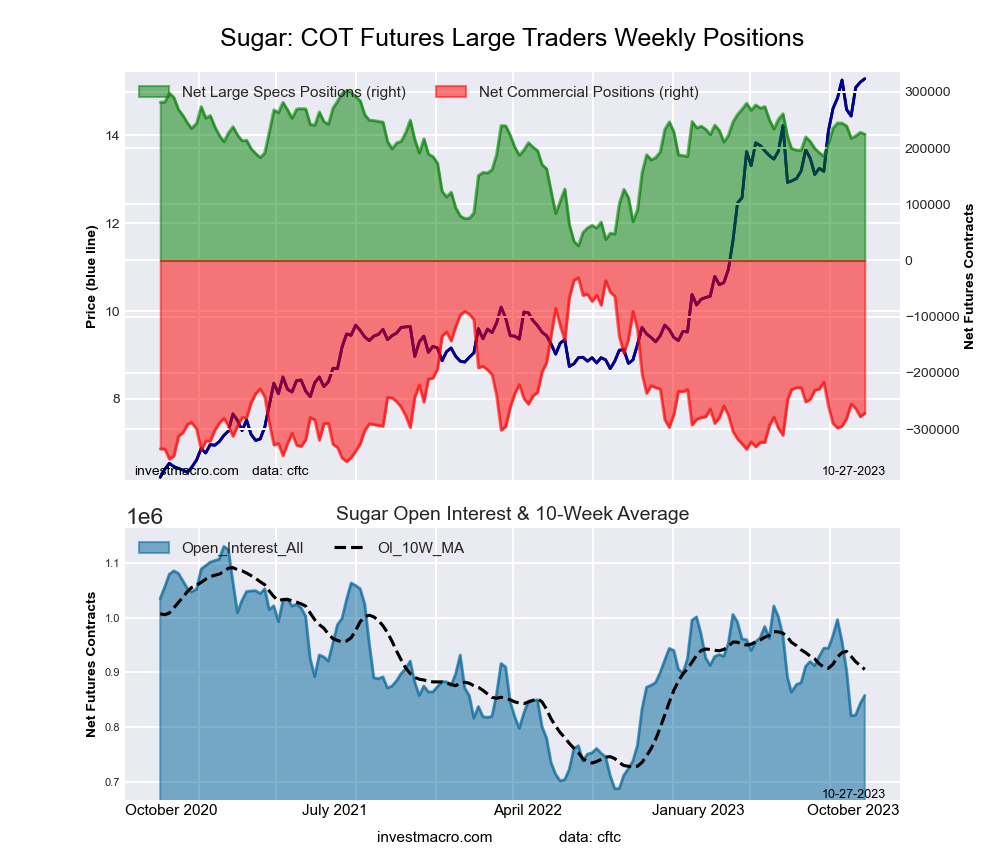
SUGAR Futures:
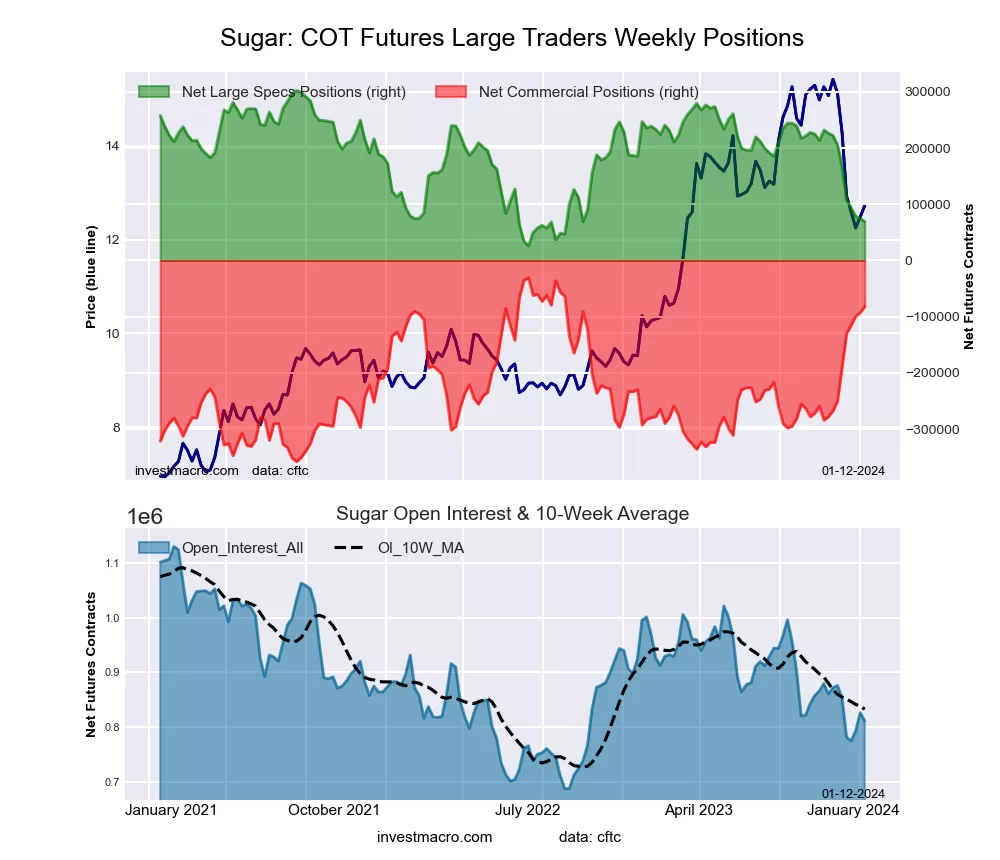
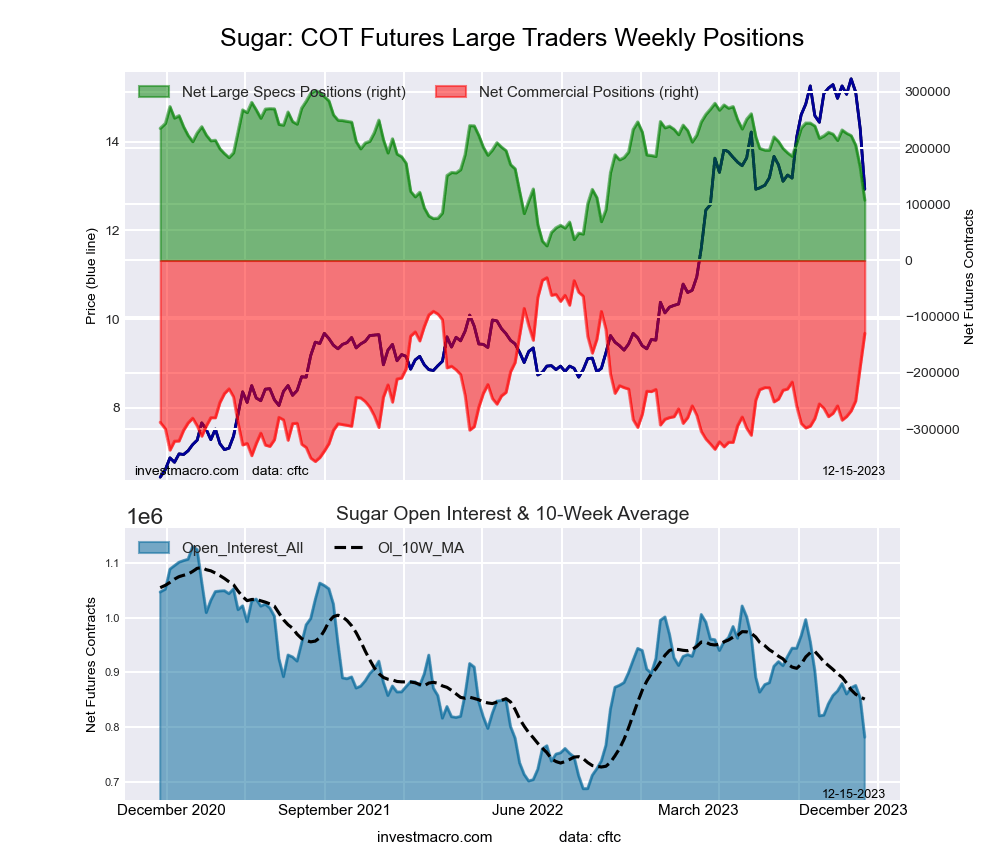
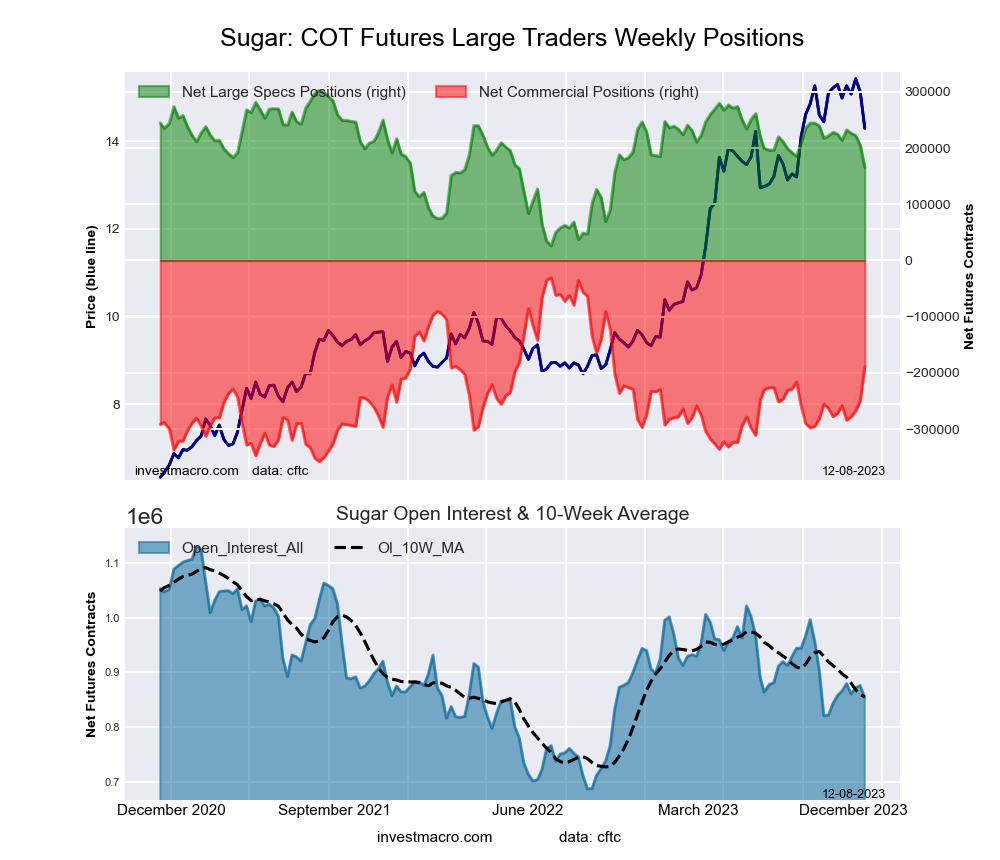
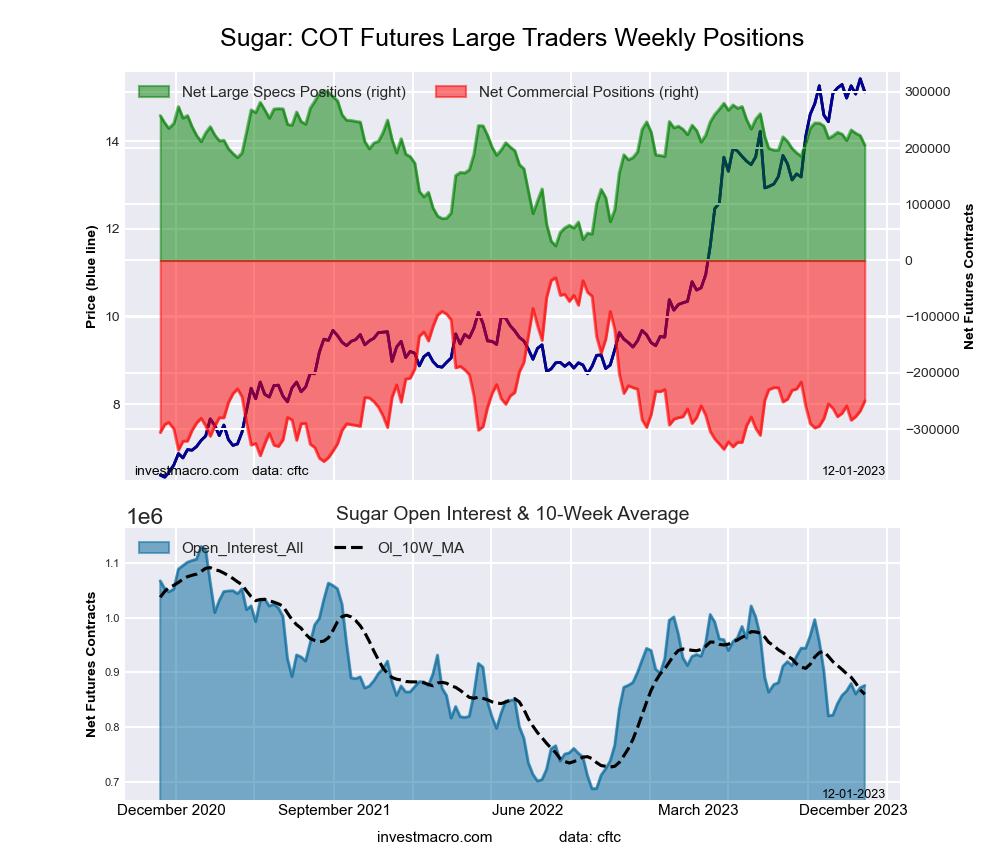
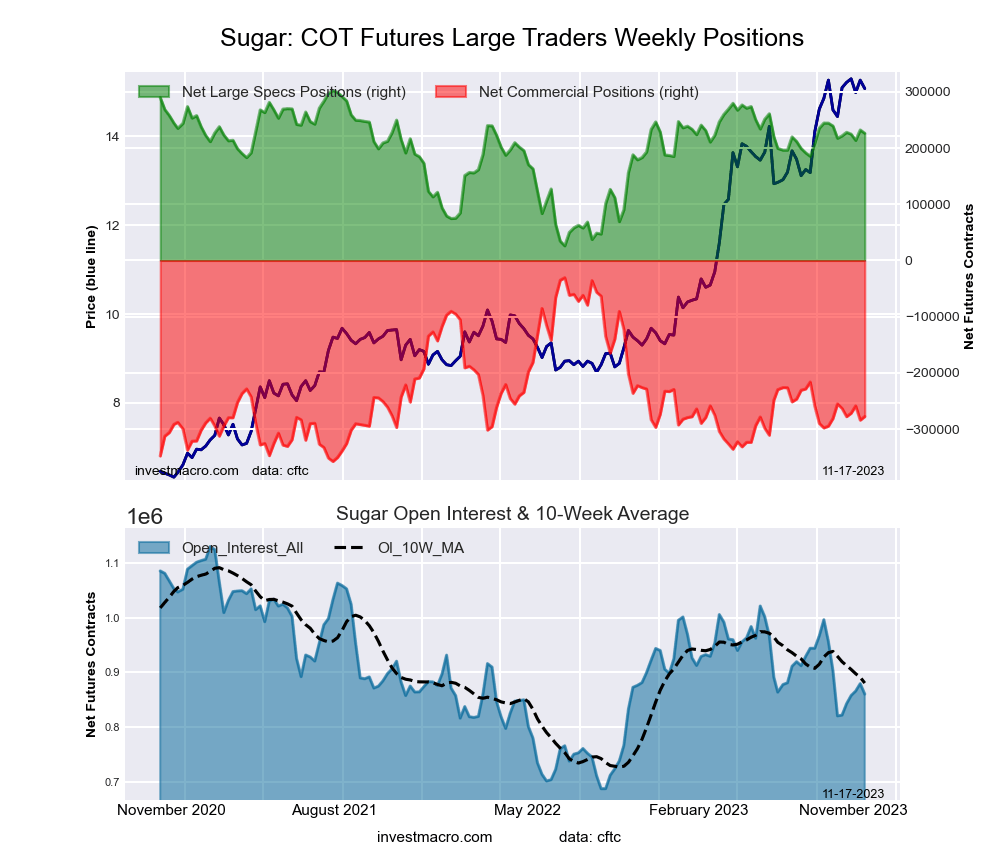
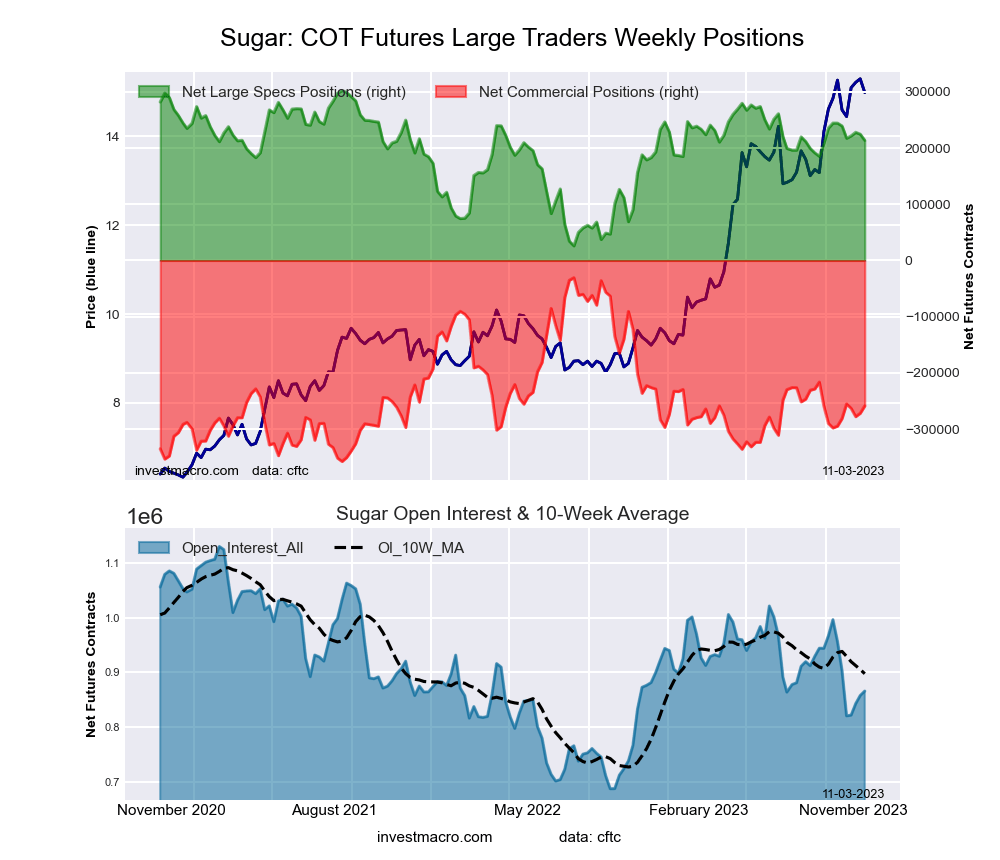
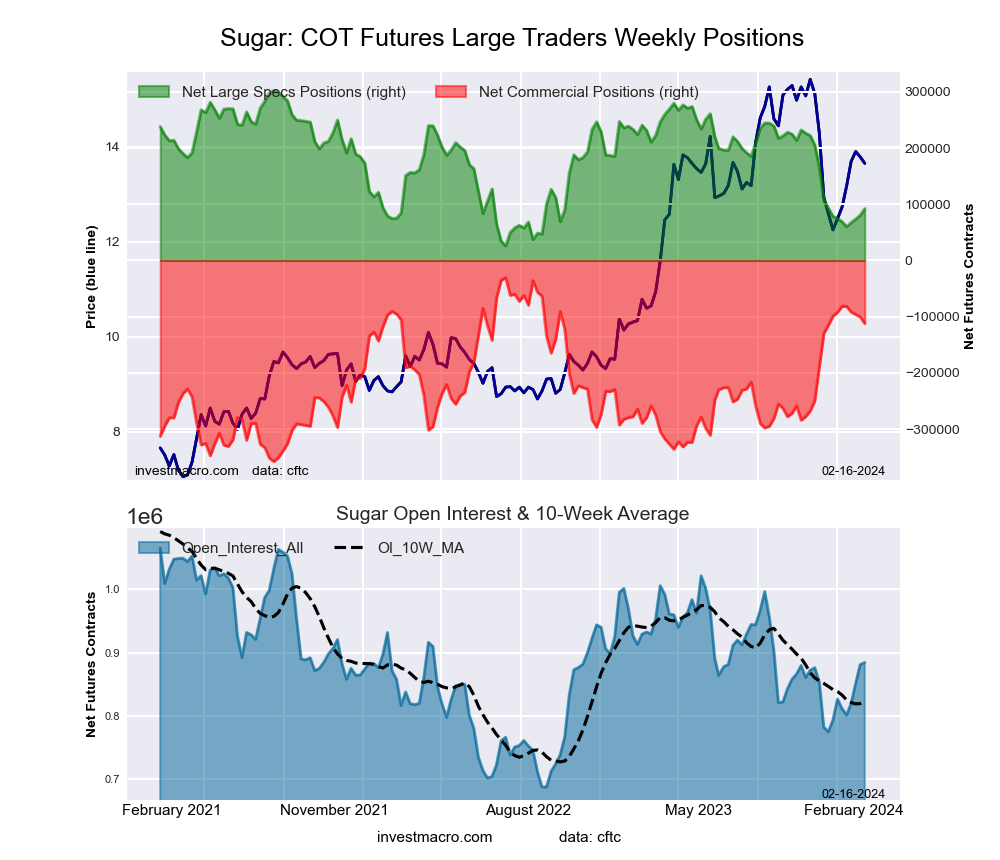 The SUGAR large speculator standing this week was a net position of 92,155 contracts in the data reported through Tuesday. This was a weekly lift of 11,631 contracts from the previous week which had a total of 80,524 net contracts.
This week’s current strength score (the trader positioning range over the past three years, measured from 0 to 100) shows the speculators are currently Bearish with a score of 23.9 percent. The commercials are Bullish with a score of 75.1 percent and the small traders (not shown in chart) are Bearish with a score of 28.2 percent.
Price Trend-Following Model: Downtrend
Our weekly trend-following model classifies the current market price position as: Downtrend. The current action for the model is considered to be: Hold – Maintain Short Position.
| SUGAR Futures Statistics | SPECULATORS | COMMERCIALS | SMALL TRADERS |
| – Percent of Open Interest Longs: | 20.8 | 55.8 | 8.5 |
| – Percent of Open Interest Shorts: | 10.4 | 68.5 | 6.2 |
| – Net Position: | 92,155 | -112,138 | 19,983 |
| – Gross Longs: | 184,125 | 493,076 | 75,081 |
| – Gross Shorts: | 91,970 | 605,214 | 55,098 |
| – Long to Short Ratio: | 2.0 to 1 | 0.8 to 1 | 1.4 to 1 |
| NET POSITION TREND: | |||
| – Strength Index Score (3 Year Range Pct): | 23.9 | 75.1 | 28.2 |
| – Strength Index Reading (3 Year Range): | Bearish | Bullish | Bearish |
| NET POSITION MOVEMENT INDEX: | |||
| – 6-Week Change in Strength Index: | 6.3 | -6.1 | 3.4 |
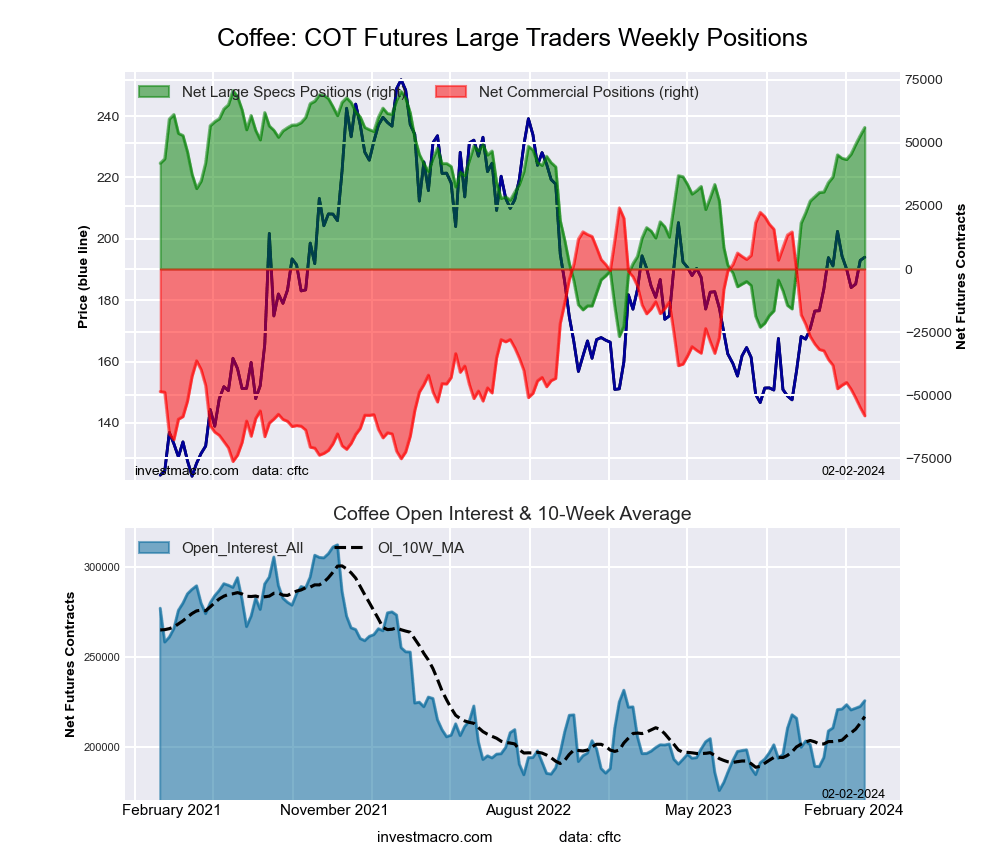
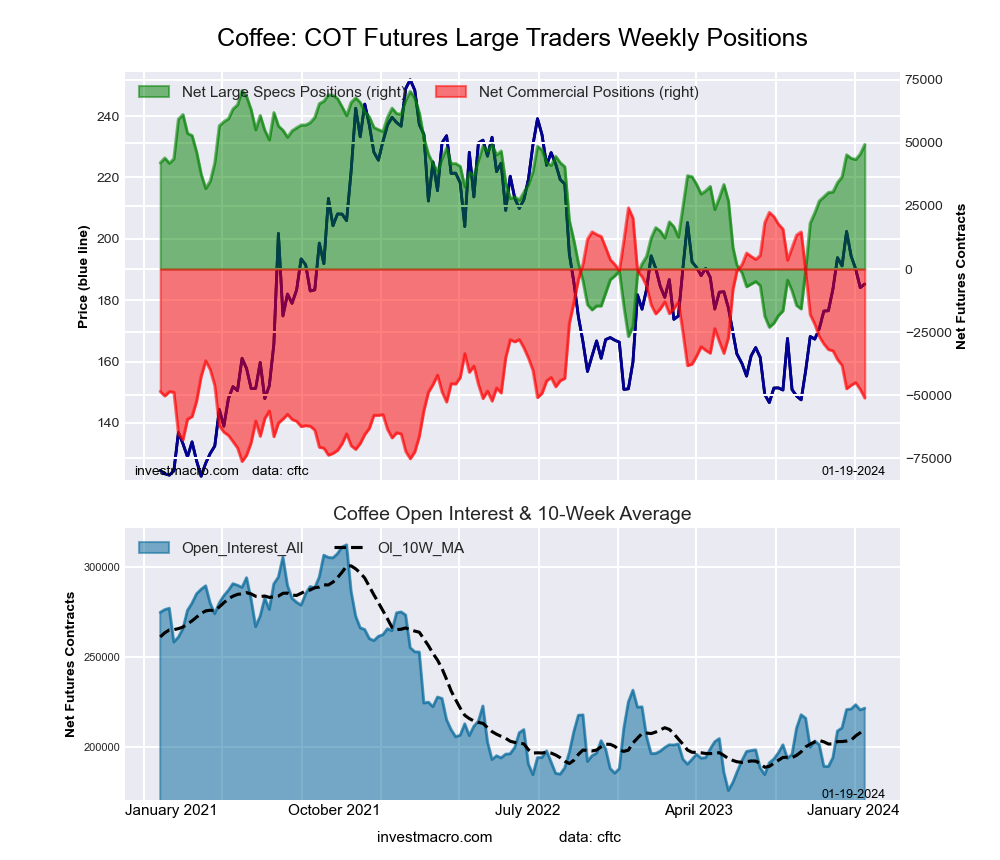
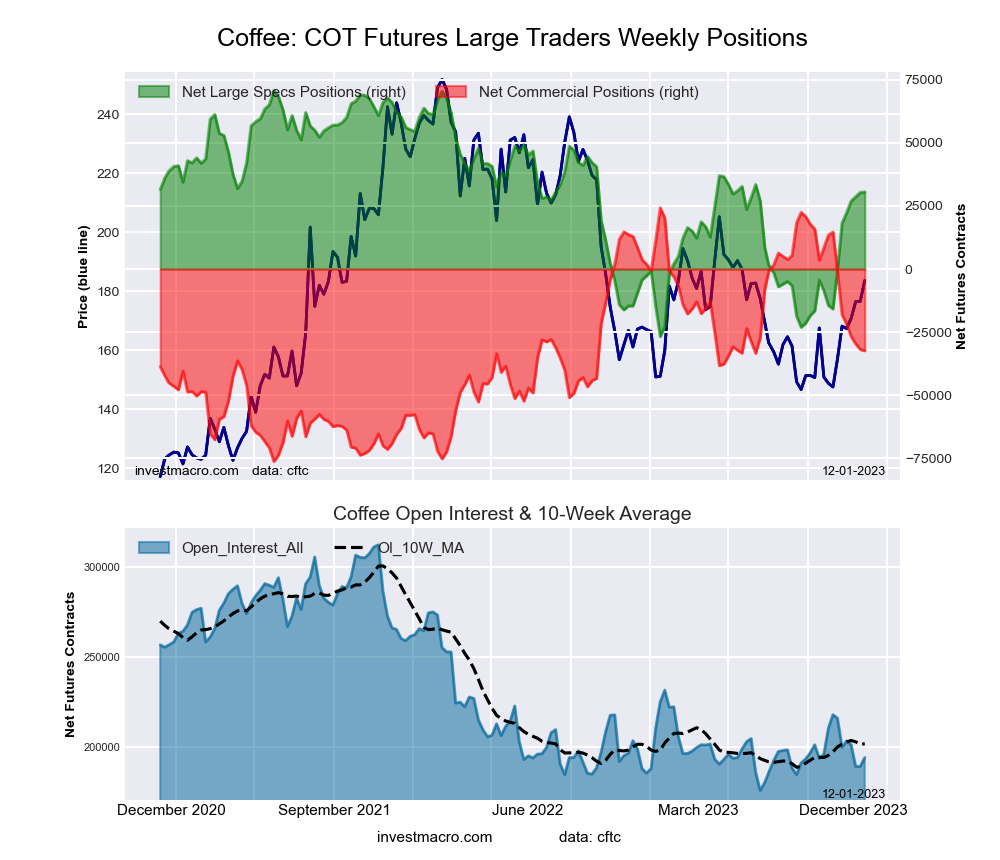
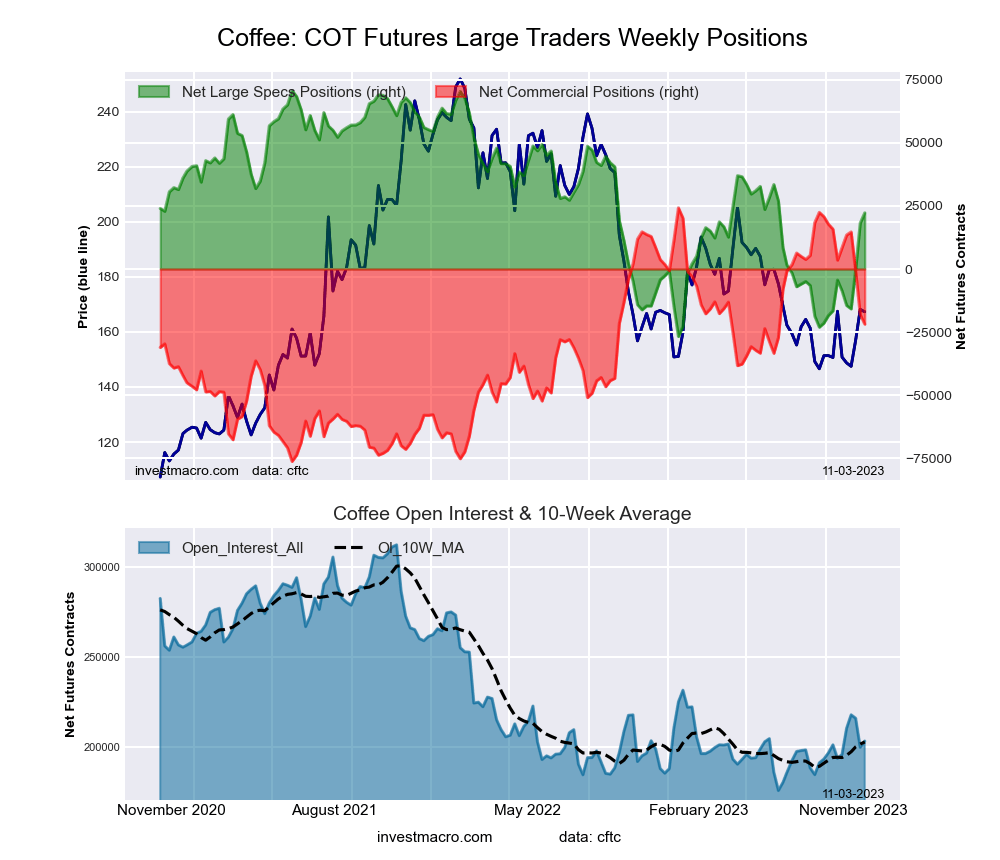
COFFEE Futures:
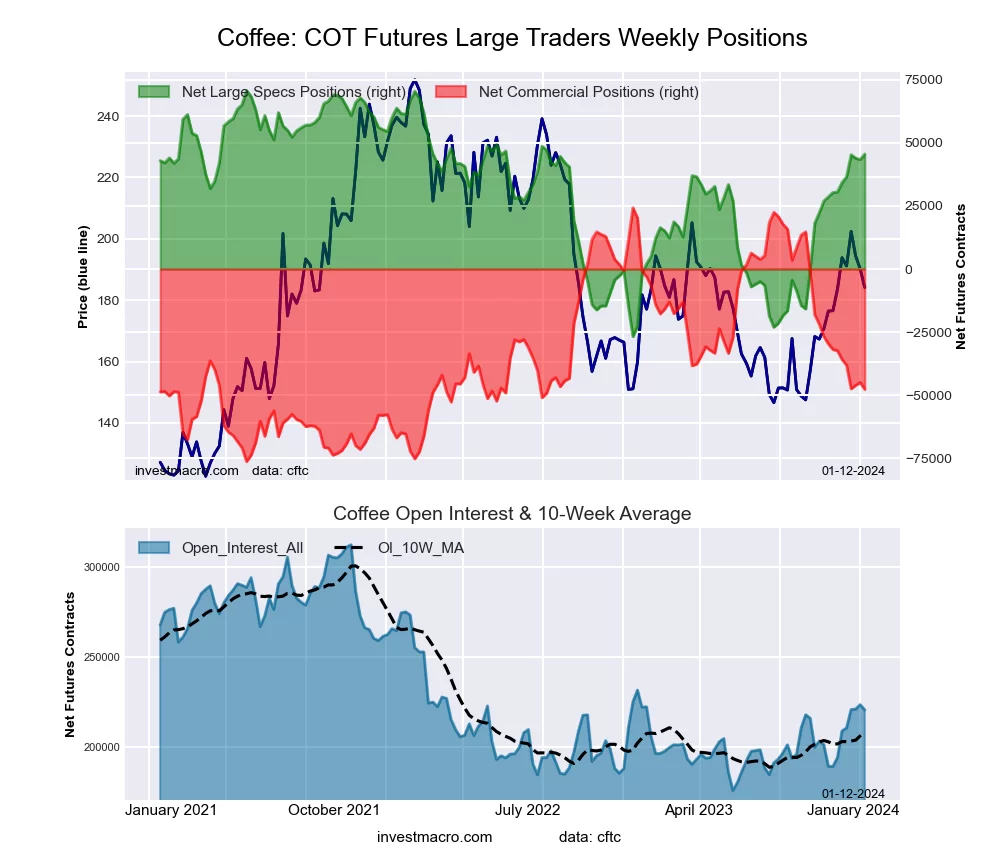
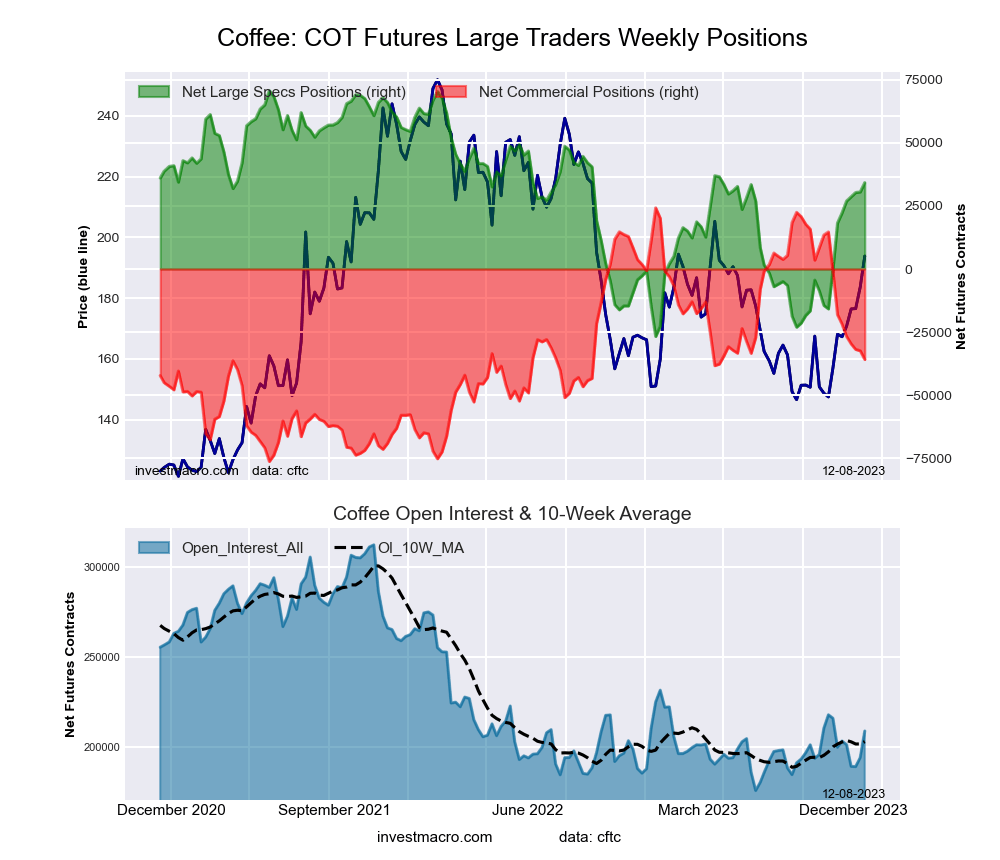
 The COFFEE large speculator standing this week was a net position of 60,084 contracts in the data reported through Tuesday. This was a weekly boost of 5,101 contracts from the previous week which had a total of 54,983 net contracts.
This week’s current strength score (the trader positioning range over the past three years, measured from 0 to 100) shows the speculators are currently Bullish-Extreme with a score of 89.0 percent. The commercials are Bearish-Extreme with a score of 14.8 percent and the small traders (not shown in chart) are Bearish with a score of 32.1 percent.
Price Trend-Following Model: Uptrend
Our weekly trend-following model classifies the current market price position as: Uptrend. The current action for the model is considered to be: Hold – Maintain Long Position.
| COFFEE Futures Statistics | SPECULATORS | COMMERCIALS | SMALL TRADERS |
| – Percent of Open Interest Longs: | 36.8 | 37.6 | 4.0 |
| – Percent of Open Interest Shorts: | 10.0 | 65.0 | 3.4 |
| – Net Position: | 60,084 | -61,442 | 1,358 |
| – Gross Longs: | 82,479 | 84,398 | 8,905 |
| – Gross Shorts: | 22,395 | 145,840 | 7,547 |
| – Long to Short Ratio: | 3.7 to 1 | 0.6 to 1 | 1.2 to 1 |
| NET POSITION TREND: | |||
| – Strength Index Score (3 Year Range Pct): | 89.0 | 14.8 | 32.1 |
| – Strength Index Reading (3 Year Range): | Bullish-Extreme | Bearish-Extreme | Bearish |
| NET POSITION MOVEMENT INDEX: | |||
| – 6-Week Change in Strength Index: | 17.1 | -16.4 | -2.7 |
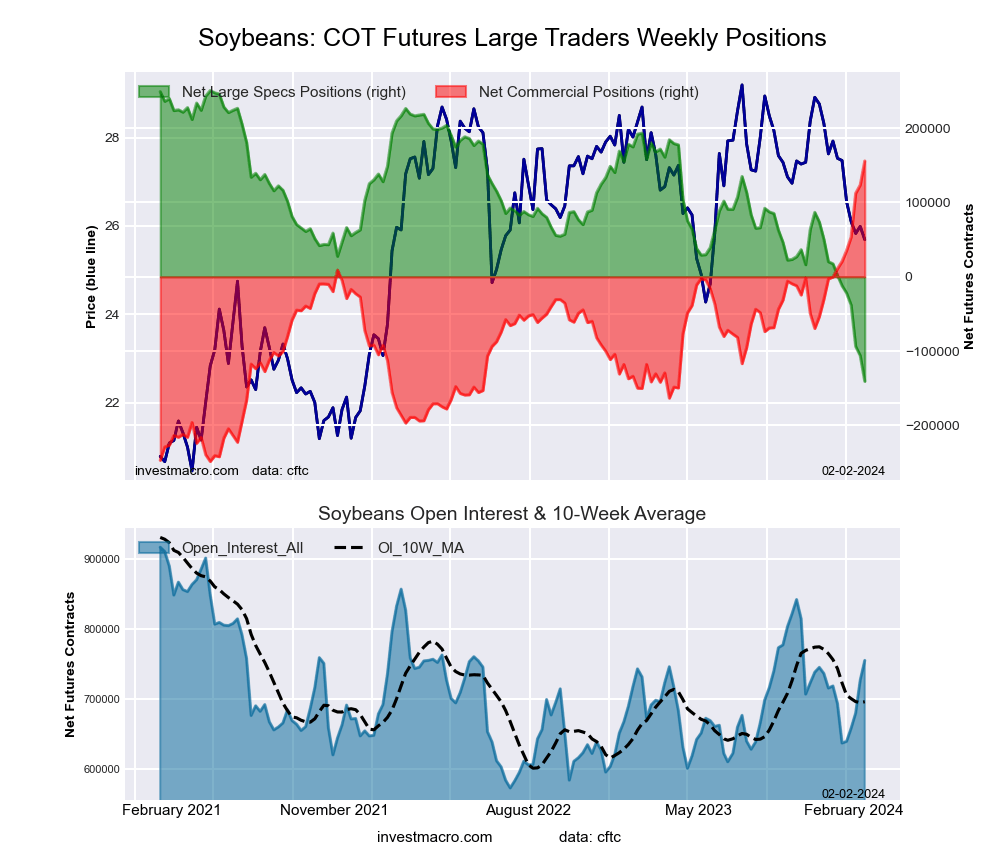
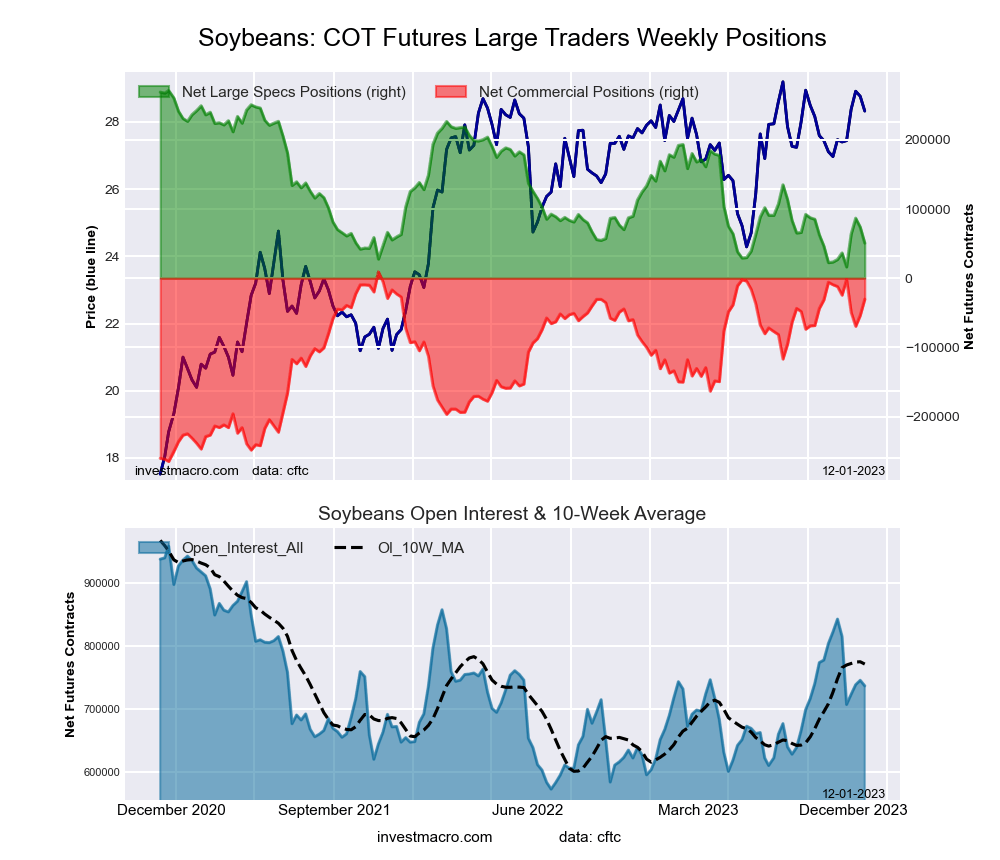
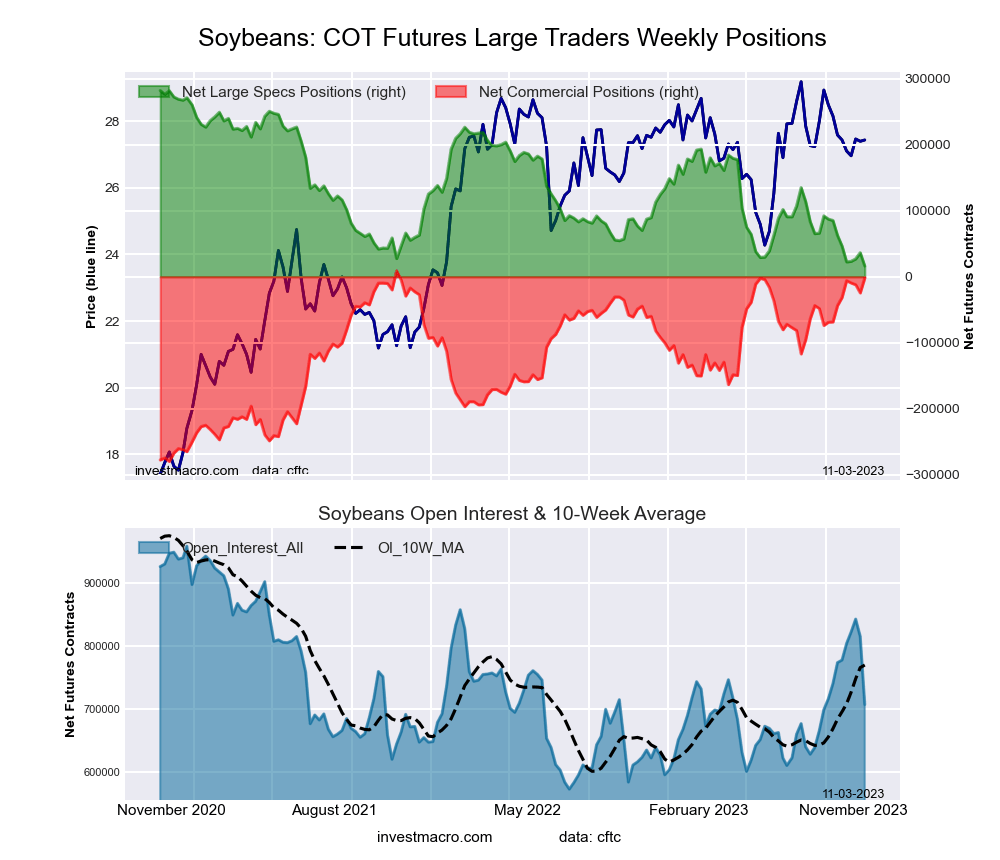
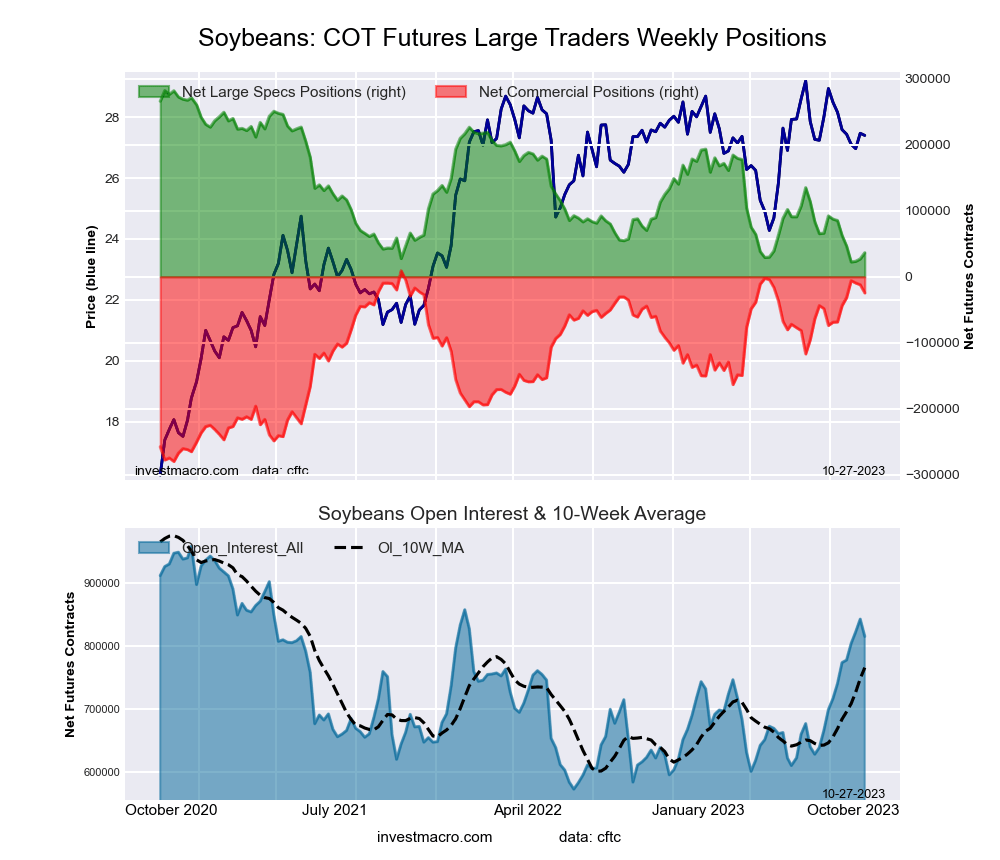
SOYBEANS Futures:
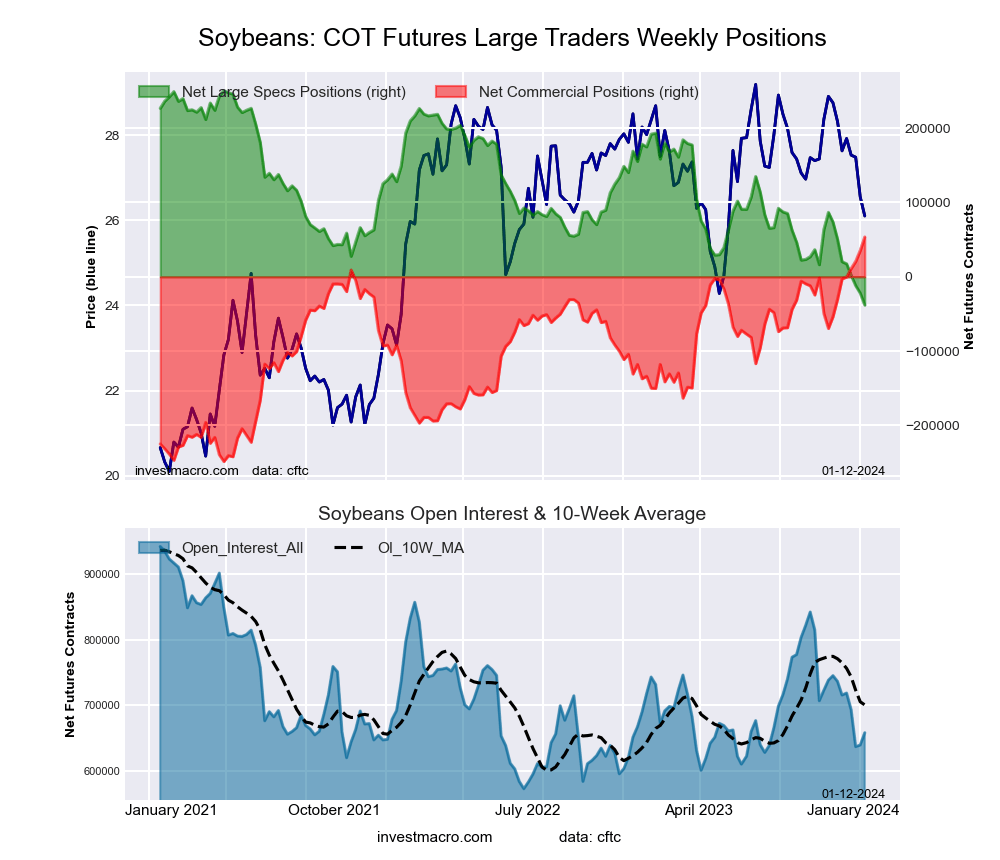
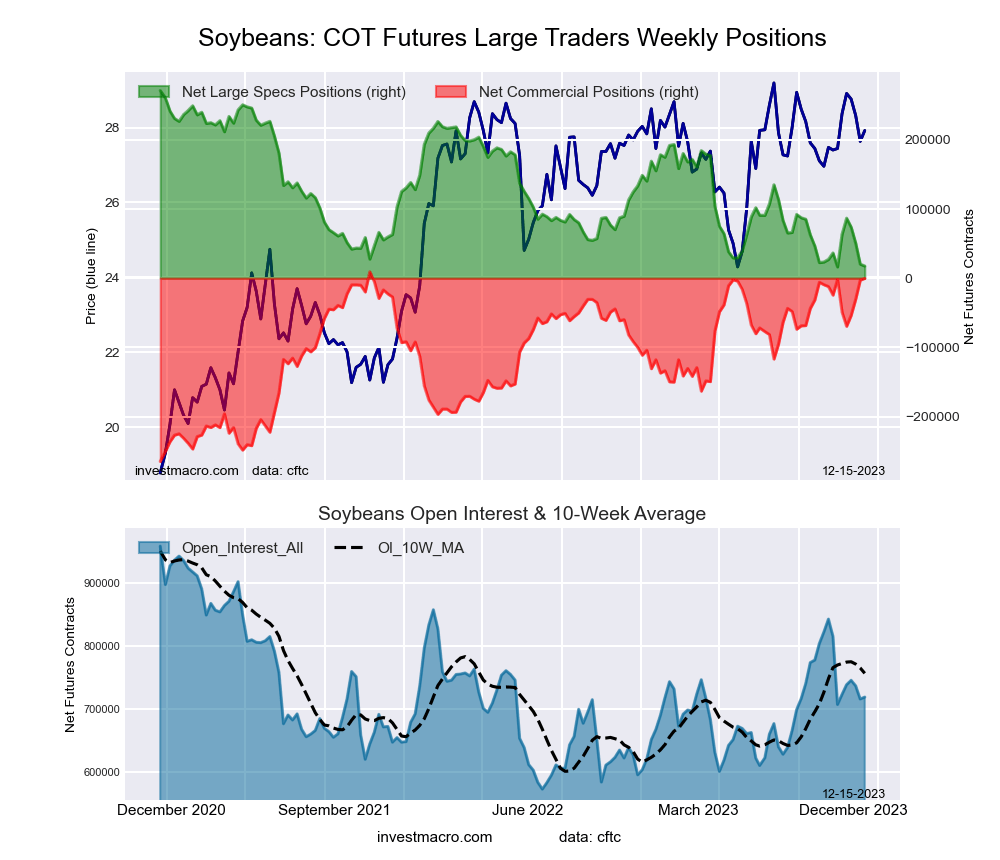
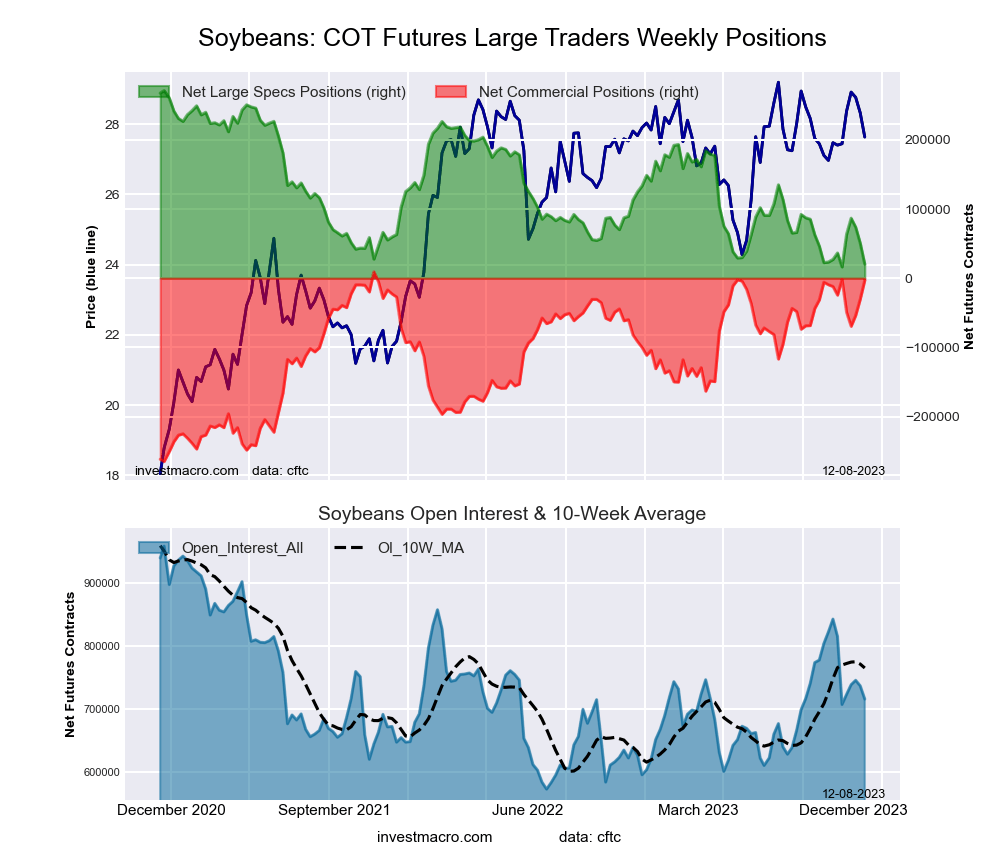
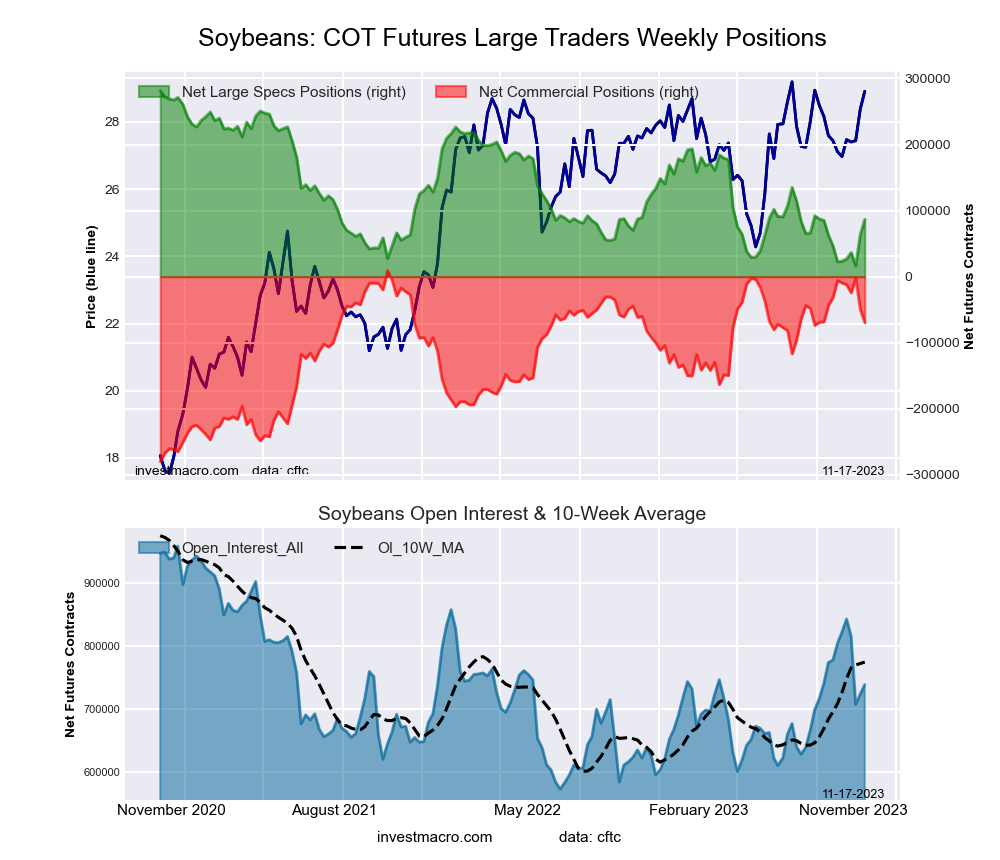
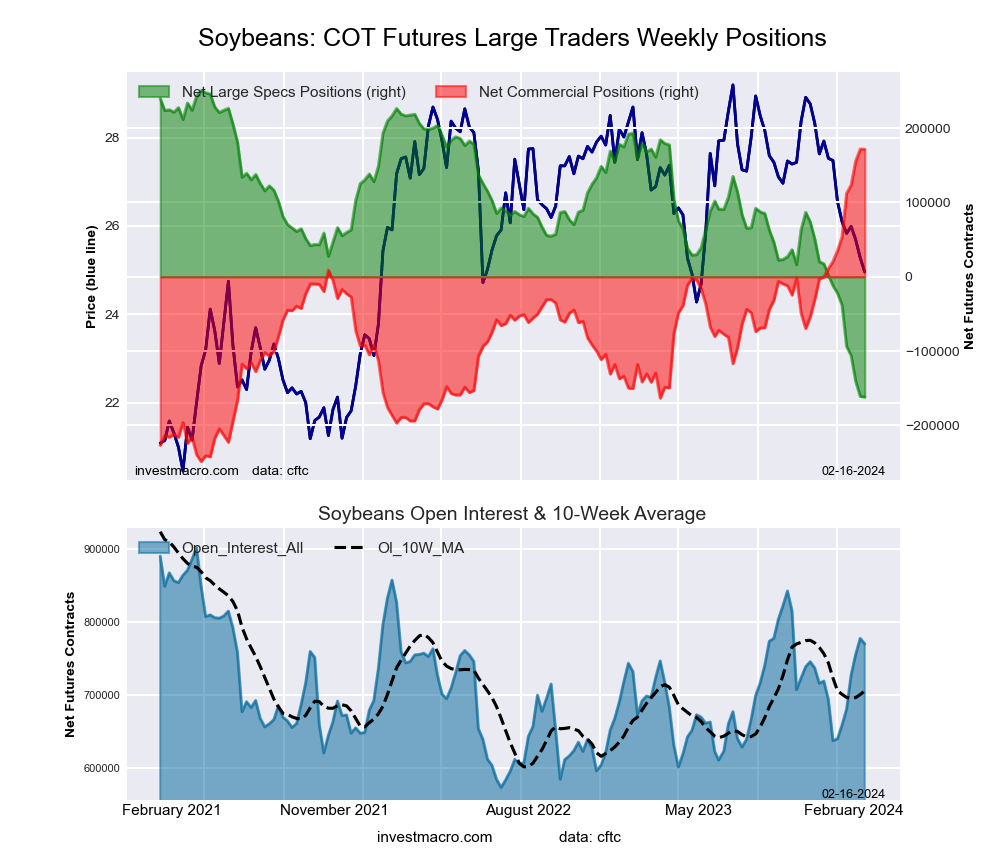 The SOYBEANS large speculator standing this week was a net position of -161,751 contracts in the data reported through Tuesday. This was a weekly lowering of -934 contracts from the previous week which had a total of -160,817 net contracts.
This week’s current strength score (the trader positioning range over the past three years, measured from 0 to 100) shows the speculators are currently Bearish-Extreme with a score of 0.0 percent. The commercials are Bullish-Extreme with a score of 99.9 percent and the small traders (not shown in chart) are Bullish-Extreme with a score of 81.2 percent.
Price Trend-Following Model: Strong Downtrend
Our weekly trend-following model classifies the current market price position as: Strong Downtrend. The current action for the model is considered to be: Hold – Maintain Short Position.
| SOYBEANS Futures Statistics | SPECULATORS | COMMERCIALS | SMALL TRADERS |
| – Percent of Open Interest Longs: | 11.3 | 59.3 | 6.9 |
| – Percent of Open Interest Shorts: | 32.3 | 37.0 | 8.2 |
| – Net Position: | -161,751 | 171,638 | -9,887 |
| – Gross Longs: | 86,975 | 456,229 | 52,898 |
| – Gross Shorts: | 248,726 | 284,591 | 62,785 |
| – Long to Short Ratio: | 0.3 to 1 | 1.6 to 1 | 0.8 to 1 |
| NET POSITION TREND: | |||
| – Strength Index Score (3 Year Range Pct): | 0.0 | 99.9 | 81.2 |
| – Strength Index Reading (3 Year Range): | Bearish-Extreme | Bullish-Extreme | Bullish-Extreme |
| NET POSITION MOVEMENT INDEX: | |||
| – 6-Week Change in Strength Index: | -33.9 | 32.4 | 8.6 |
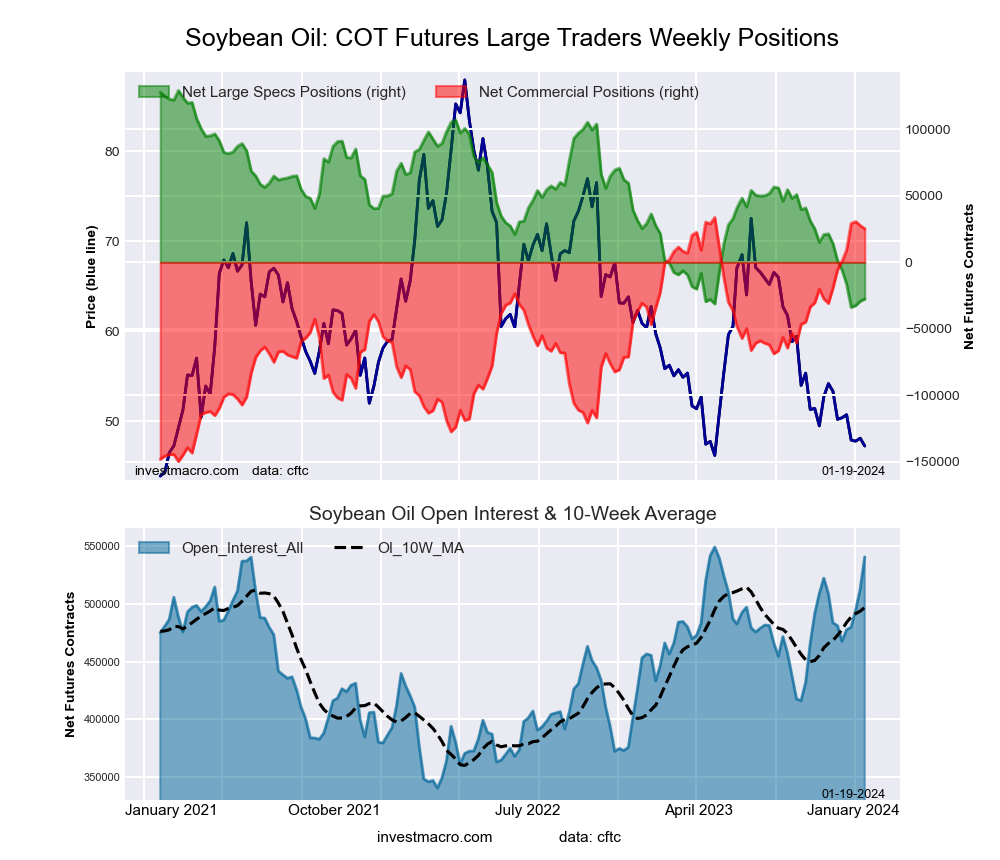
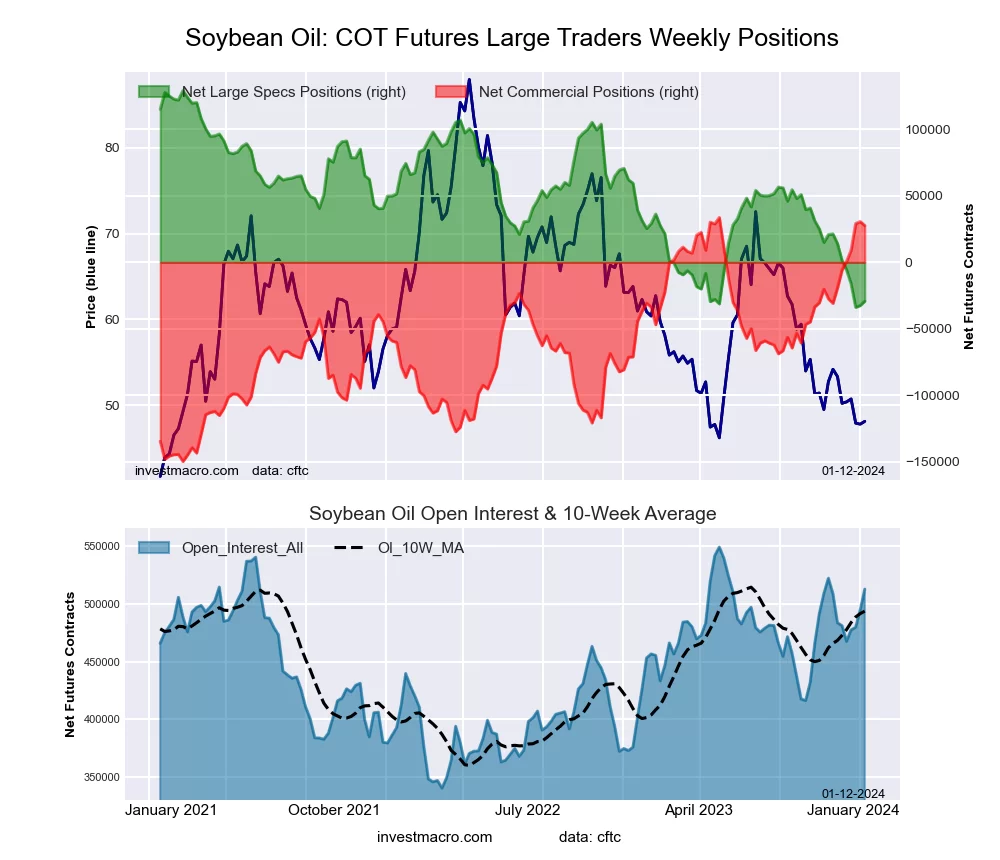
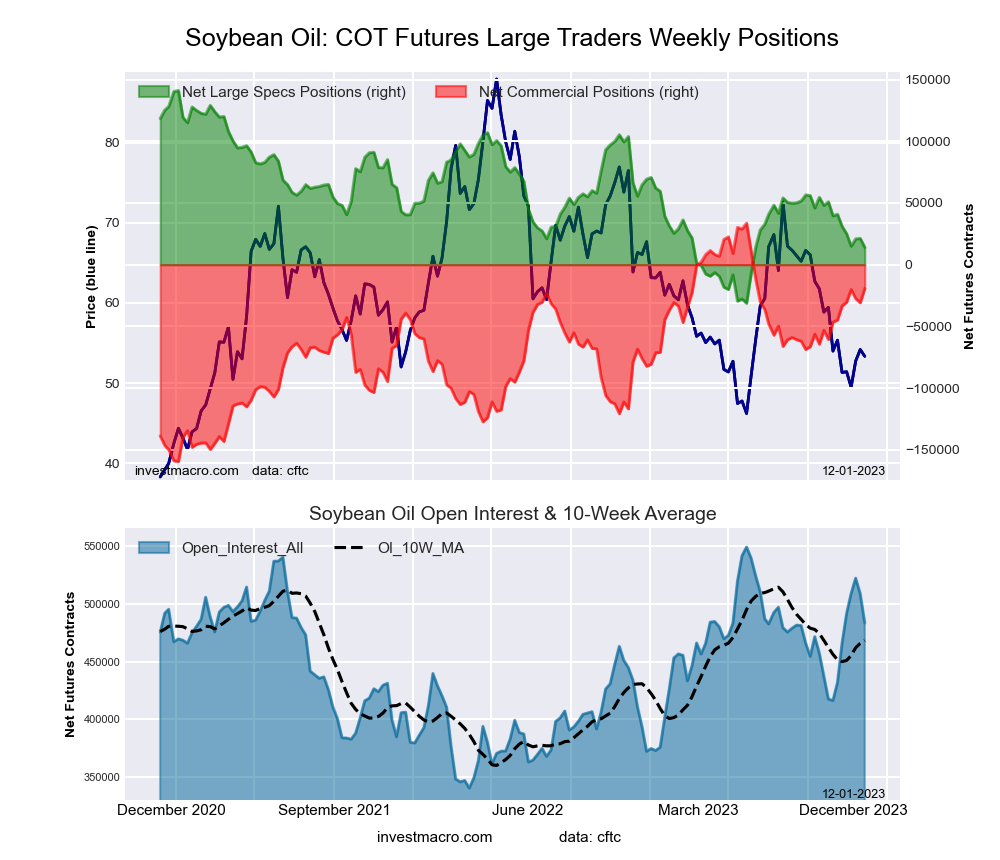
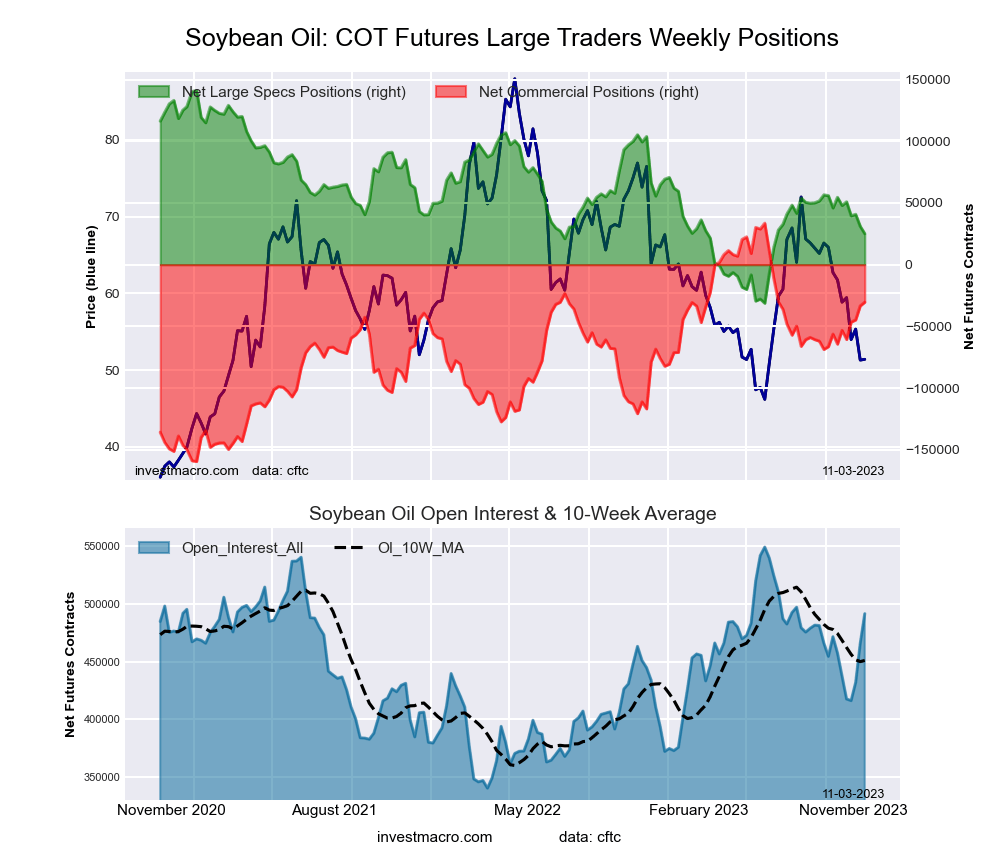
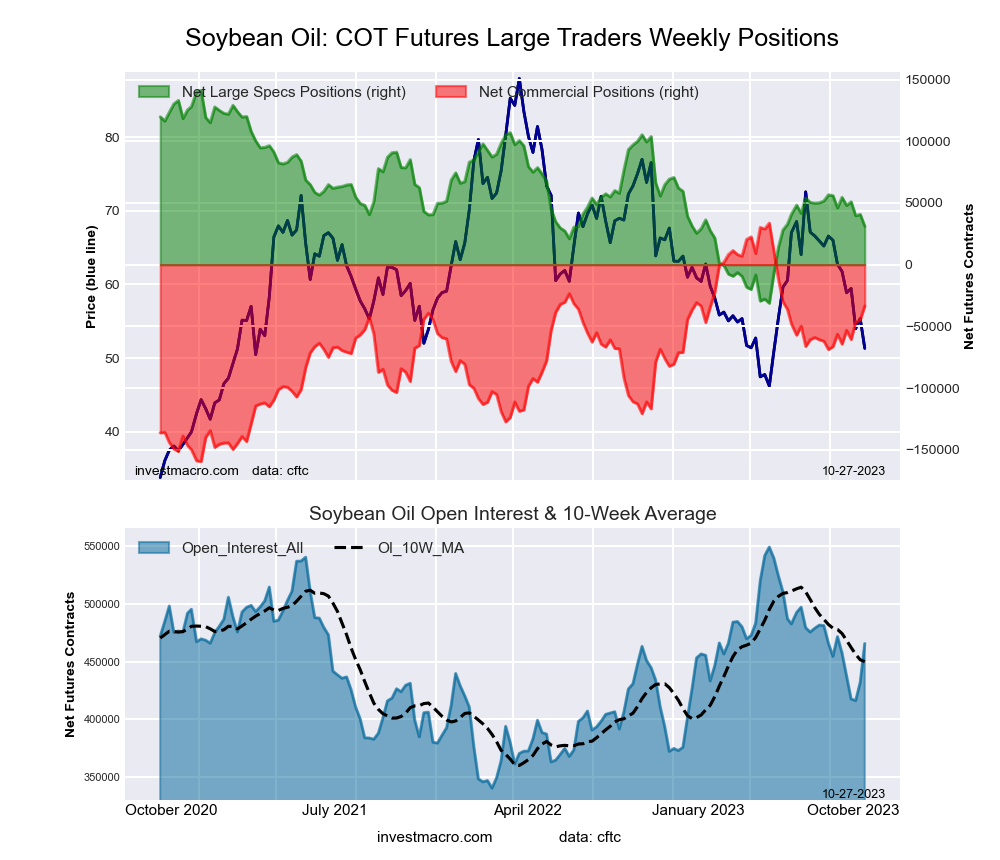
SOYBEAN OIL Futures:
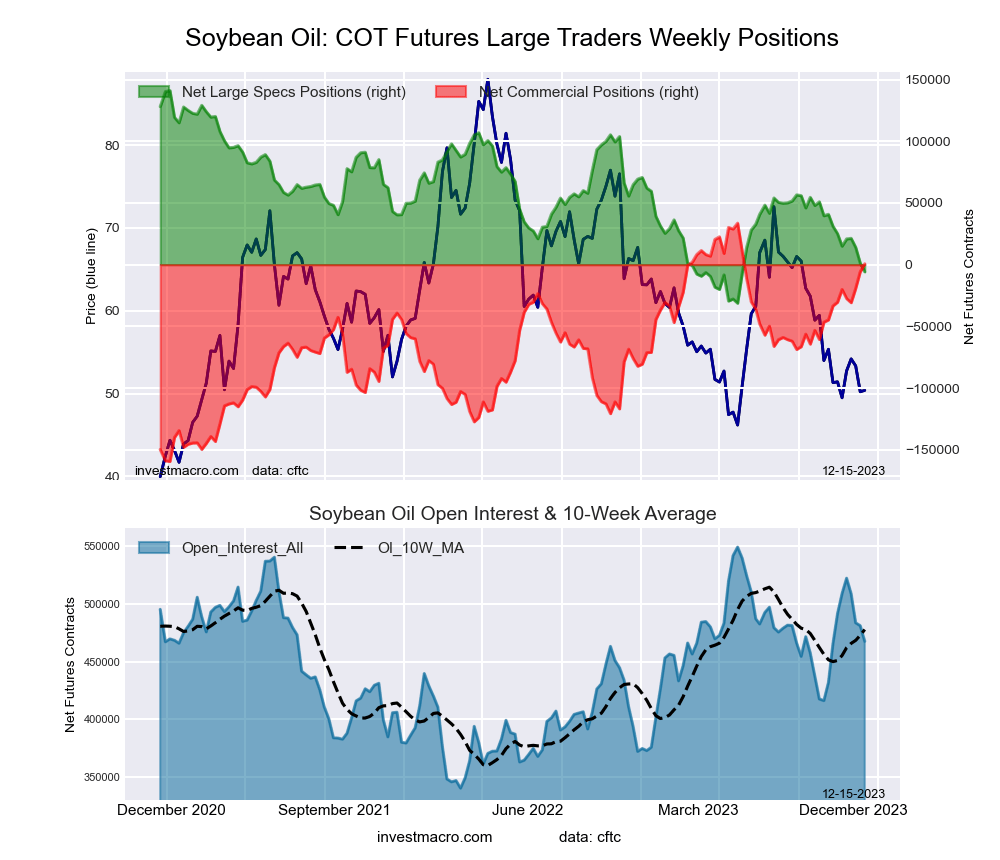
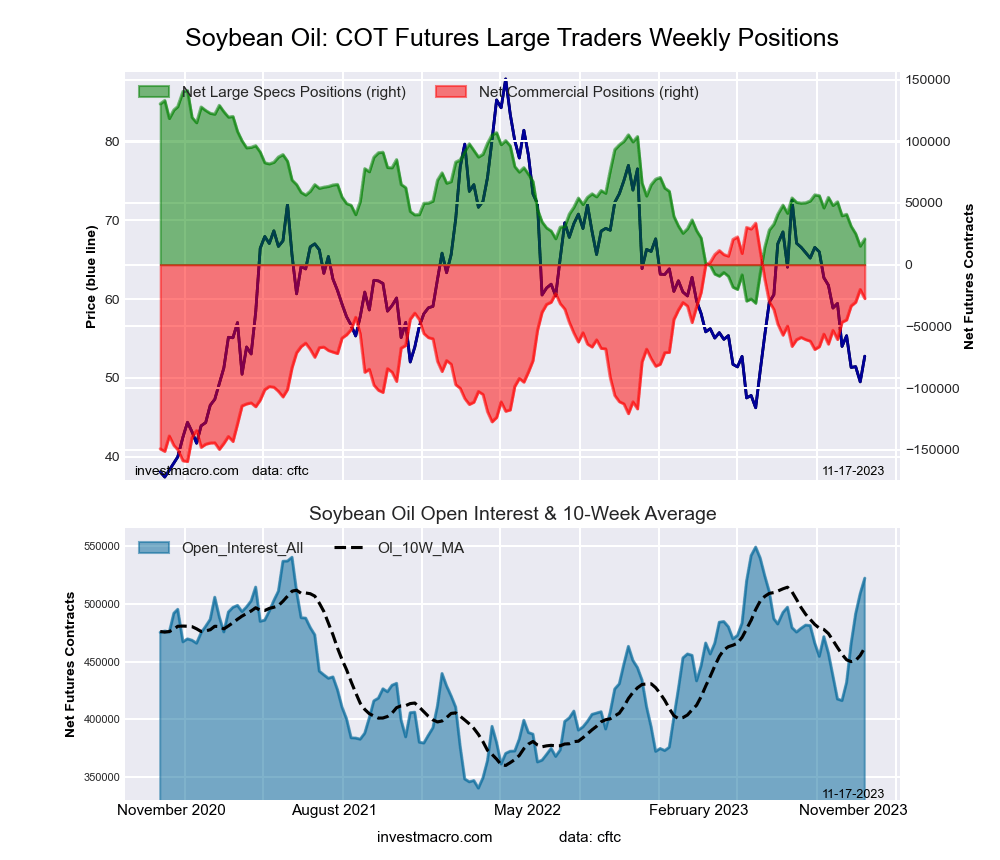
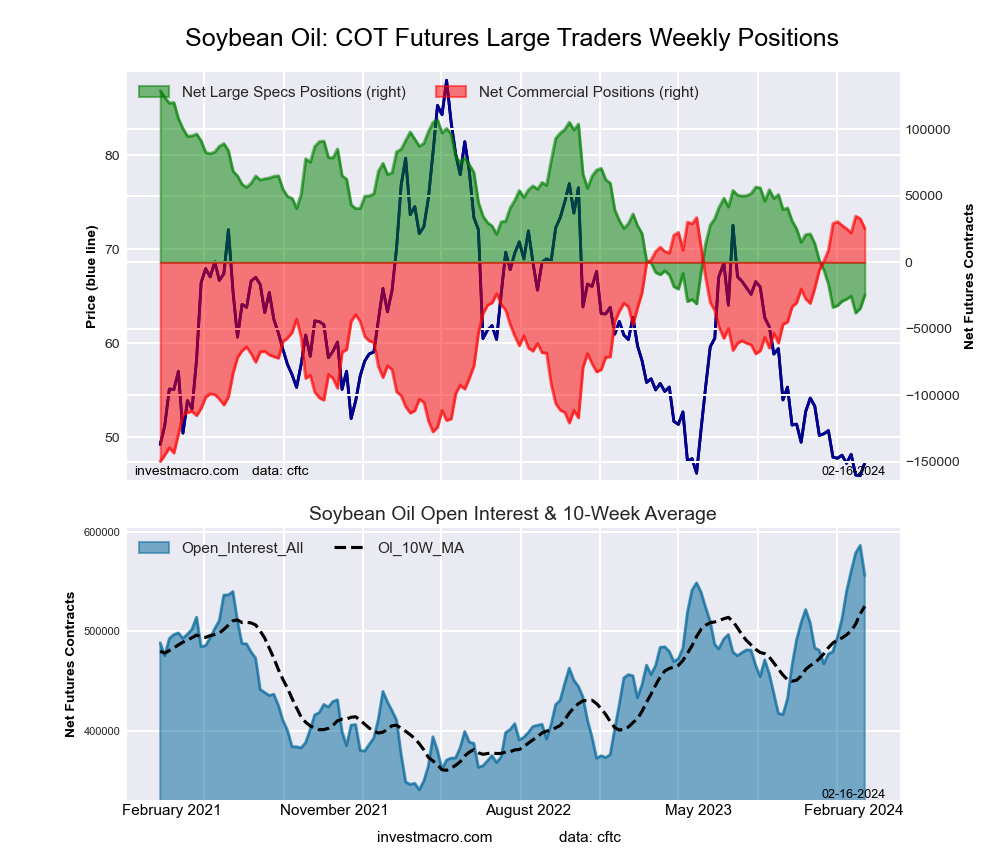 The SOYBEAN OIL large speculator standing this week was a net position of -24,616 contracts in the data reported through Tuesday. This was a weekly increase of 9,985 contracts from the previous week which had a total of -34,601 net contracts.
This week’s current strength score (the trader positioning range over the past three years, measured from 0 to 100) shows the speculators are currently Bearish-Extreme with a score of 8.0 percent. The commercials are Bullish-Extreme with a score of 95.0 percent and the small traders (not shown in chart) are Bearish-Extreme with a score of 10.4 percent.
Price Trend-Following Model: Downtrend
Our weekly trend-following model classifies the current market price position as: Downtrend. The current action for the model is considered to be: Hold – Maintain Short Position.
| SOYBEAN OIL Futures Statistics | SPECULATORS | COMMERCIALS | SMALL TRADERS |
| – Percent of Open Interest Longs: | 19.0 | 49.6 | 5.0 |
| – Percent of Open Interest Shorts: | 23.4 | 45.0 | 5.1 |
| – Net Position: | -24,616 | 25,463 | -847 |
| – Gross Longs: | 105,702 | 275,768 | 27,680 |
| – Gross Shorts: | 130,318 | 250,305 | 28,527 |
| – Long to Short Ratio: | 0.8 to 1 | 1.1 to 1 | 1.0 to 1 |
| NET POSITION TREND: | |||
| – Strength Index Score (3 Year Range Pct): | 8.0 | 95.0 | 10.4 |
| – Strength Index Reading (3 Year Range): | Bearish-Extreme | Bullish-Extreme | Bearish-Extreme |
| NET POSITION MOVEMENT INDEX: | |||
| – 6-Week Change in Strength Index: | 4.7 | -2.8 | -10.1 |
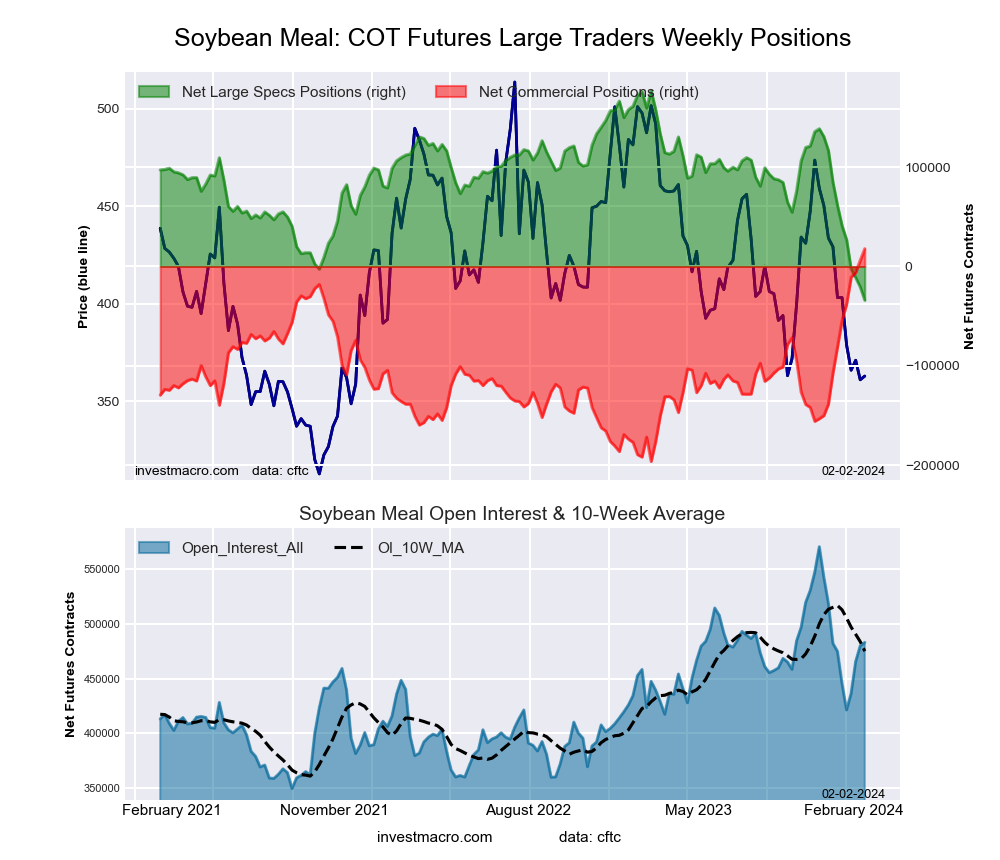
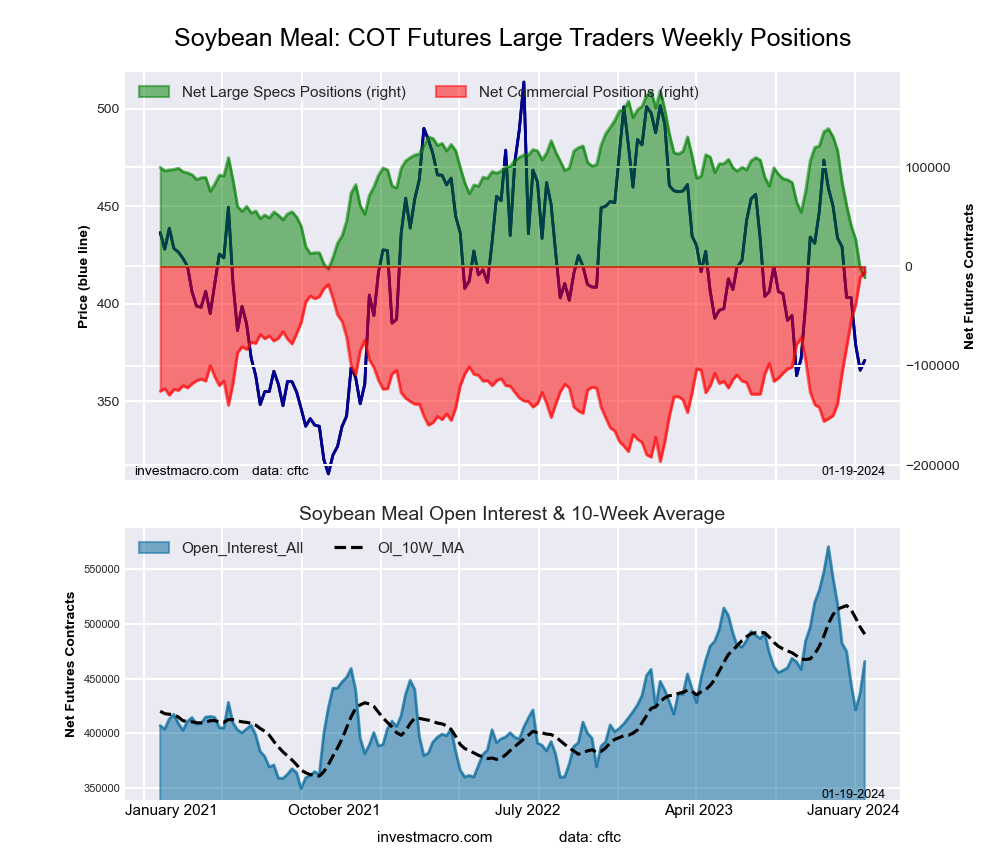
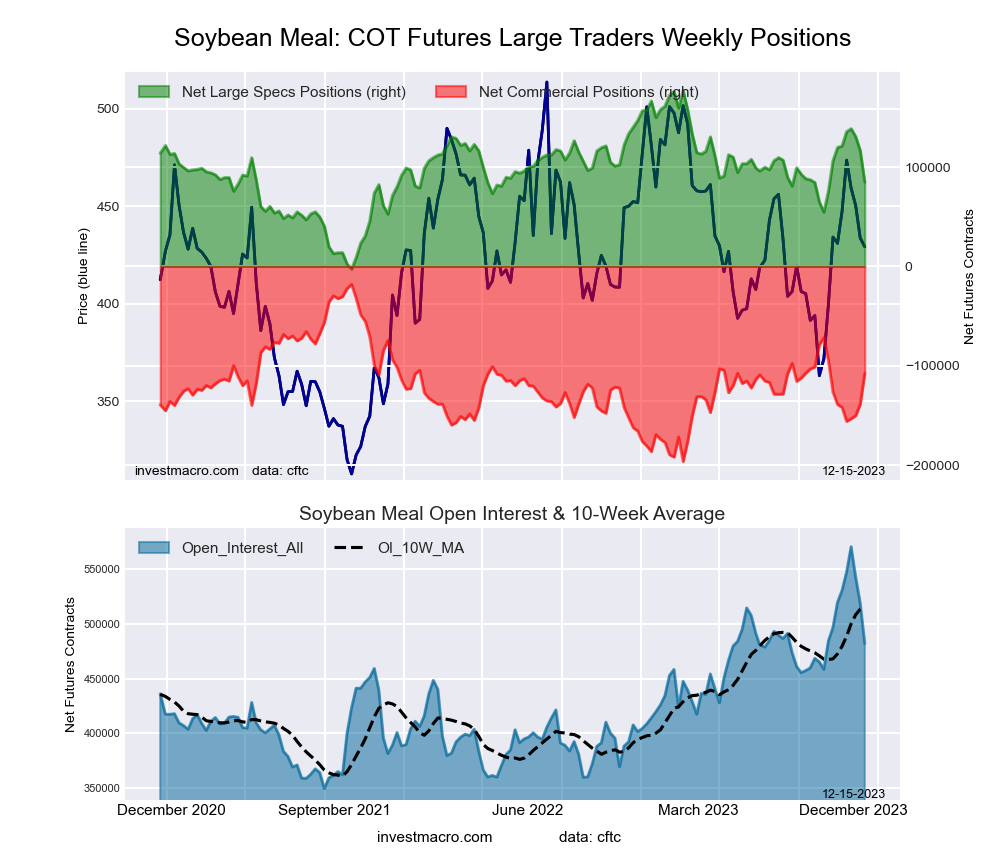
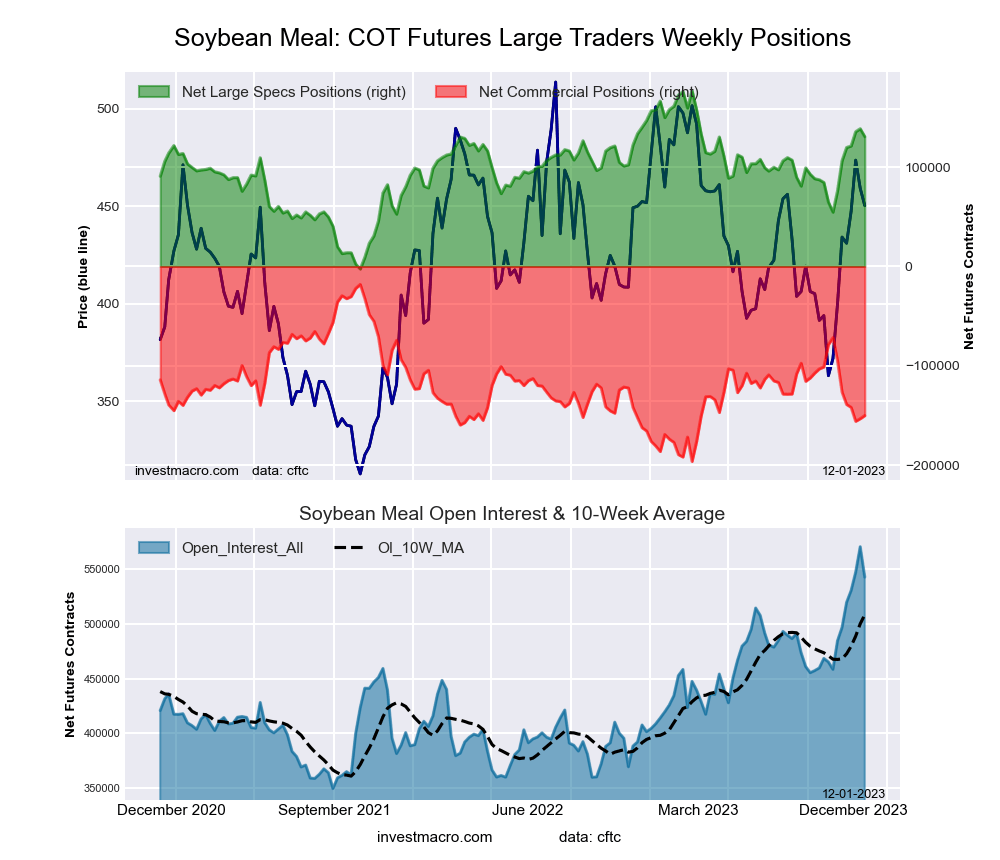
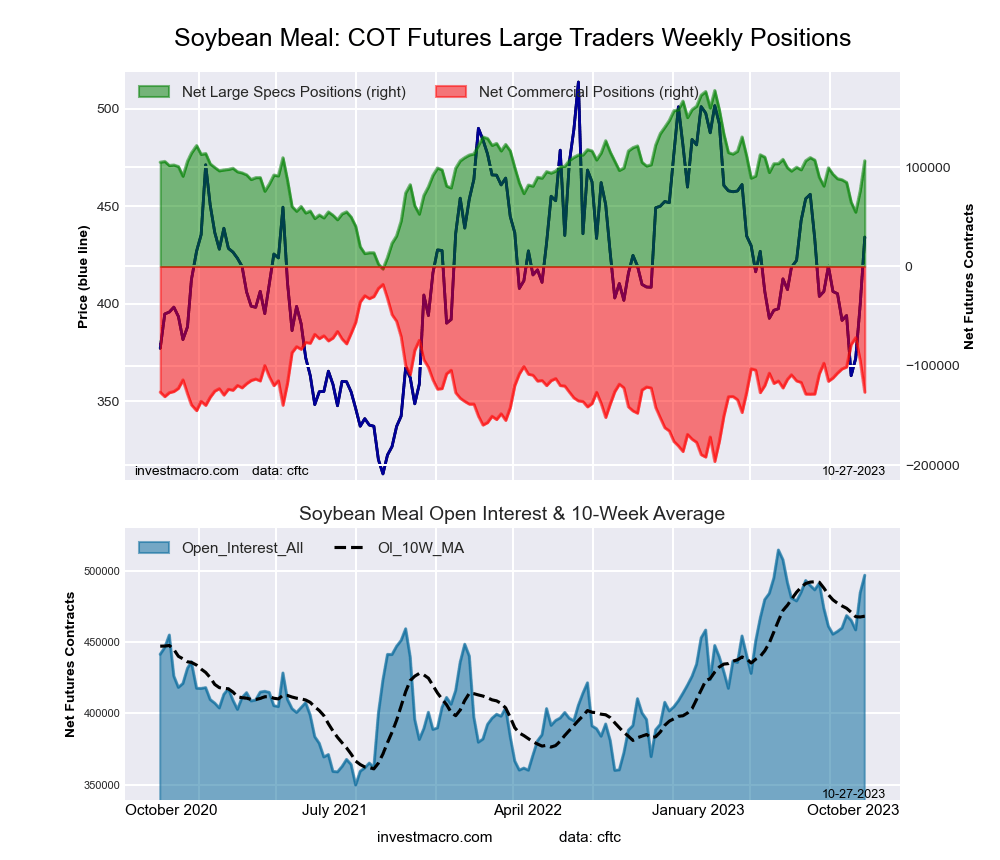
SOYBEAN MEAL Futures:
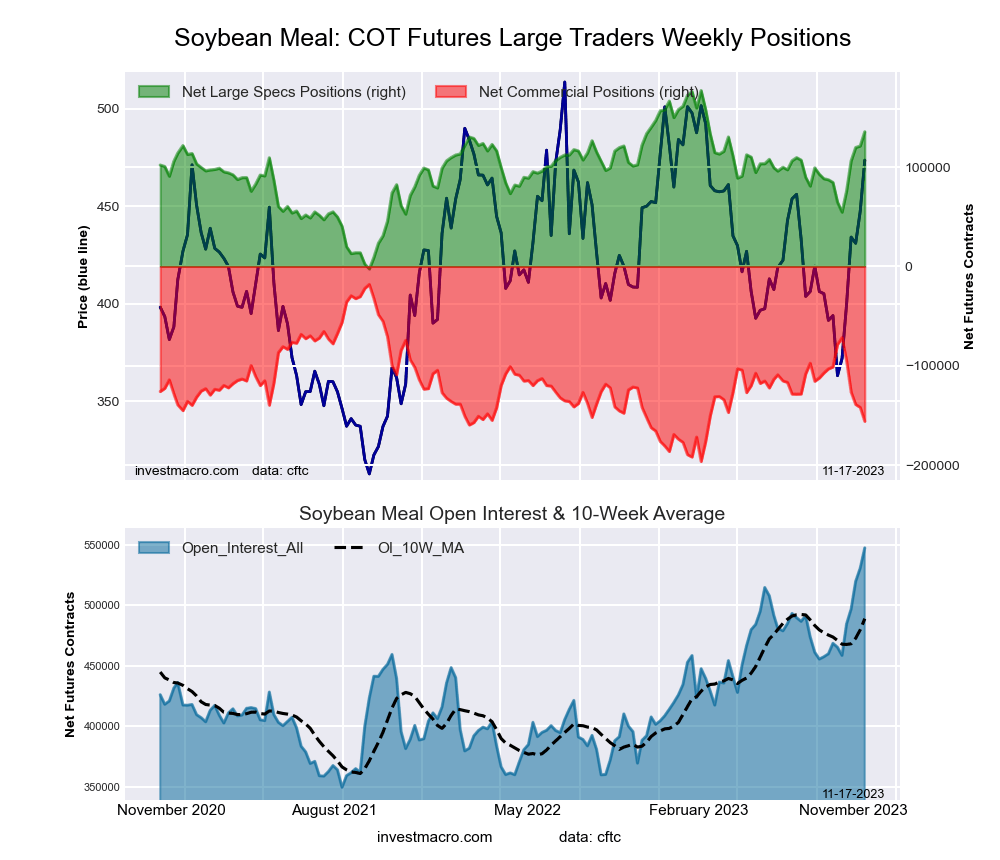
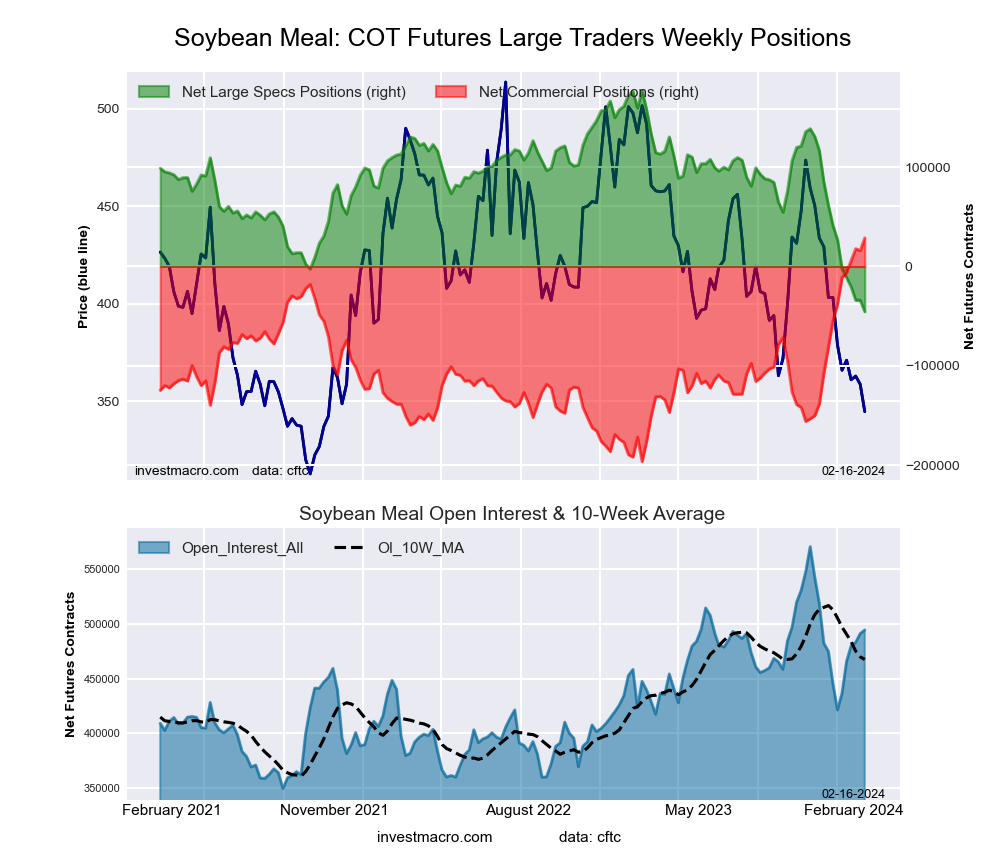 The SOYBEAN MEAL large speculator standing this week was a net position of -45,467 contracts in the data reported through Tuesday. This was a weekly reduction of -11,545 contracts from the previous week which had a total of -33,922 net contracts.
This week’s current strength score (the trader positioning range over the past three years, measured from 0 to 100) shows the speculators are currently Bearish-Extreme with a score of 0.0 percent. The commercials are Bullish-Extreme with a score of 100.0 percent and the small traders (not shown in chart) are Bearish with a score of 30.9 percent.
Price Trend-Following Model: Strong Downtrend
Our weekly trend-following model classifies the current market price position as: Strong Downtrend. The current action for the model is considered to be: Hold – Maintain Short Position.
| SOYBEAN MEAL Futures Statistics | SPECULATORS | COMMERCIALS | SMALL TRADERS |
| – Percent of Open Interest Longs: | 16.1 | 49.5 | 9.8 |
| – Percent of Open Interest Shorts: | 25.3 | 43.6 | 6.4 |
| – Net Position: | -45,467 | 28,730 | 16,737 |
| – Gross Longs: | 79,737 | 244,539 | 48,351 |
| – Gross Shorts: | 125,204 | 215,809 | 31,614 |
| – Long to Short Ratio: | 0.6 to 1 | 1.1 to 1 | 1.5 to 1 |
| NET POSITION TREND: | |||
| – Strength Index Score (3 Year Range Pct): | 0.0 | 100.0 | 30.9 |
| – Strength Index Reading (3 Year Range): | Bearish-Extreme | Bullish-Extreme | Bearish |
| NET POSITION MOVEMENT INDEX: | |||
| – 6-Week Change in Strength Index: | -32.5 | 29.7 | 24.9 |
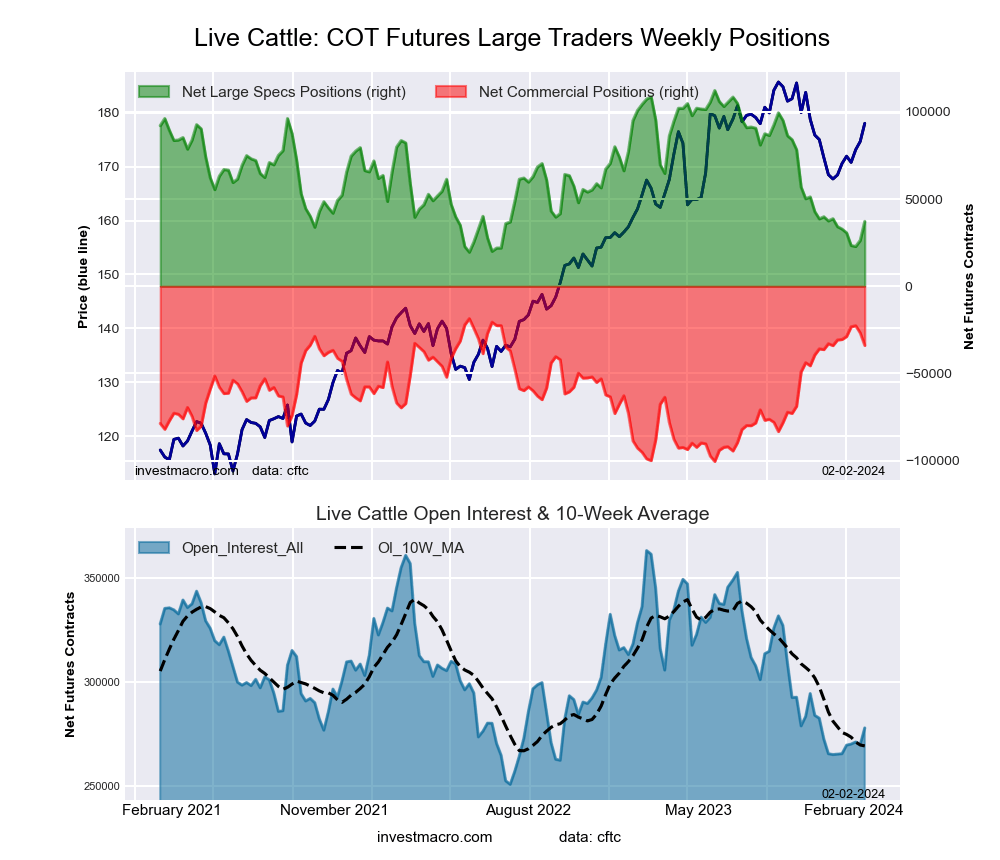
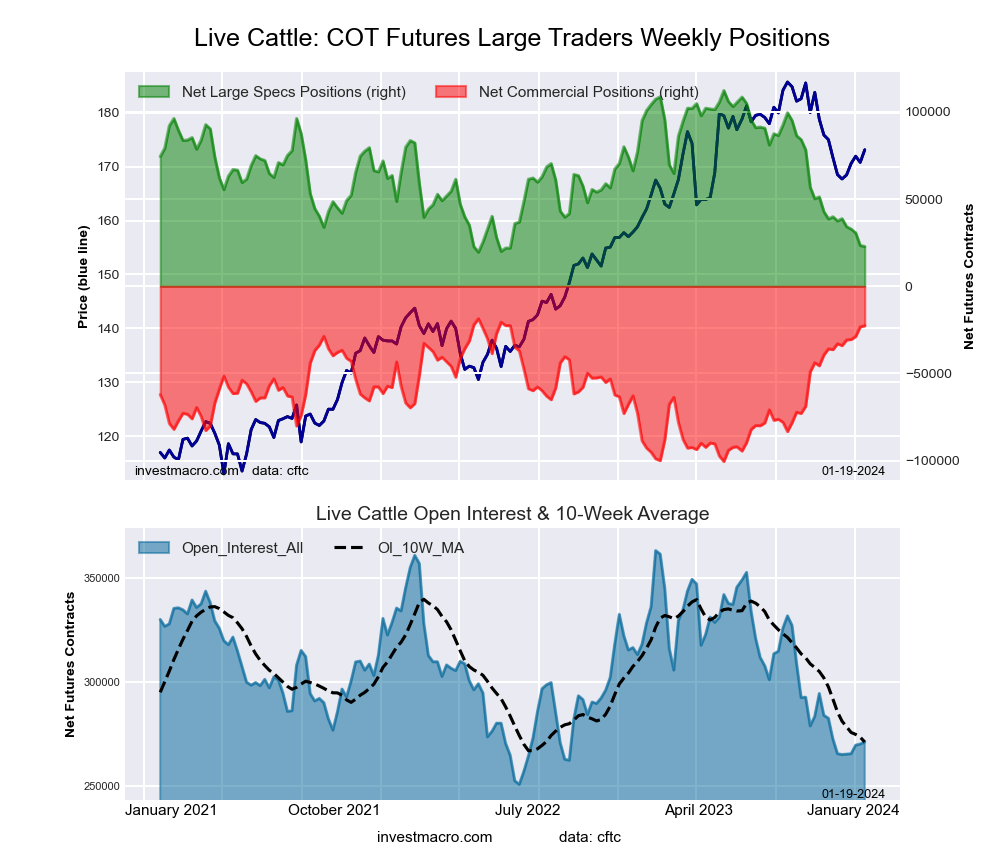
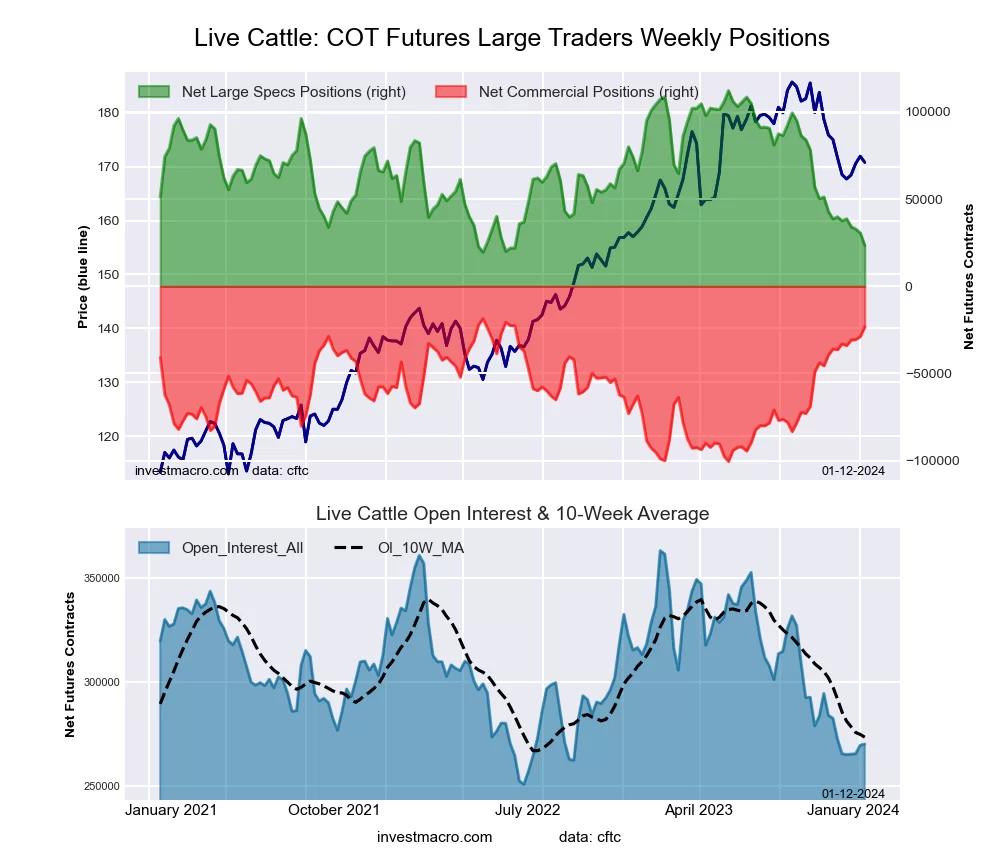
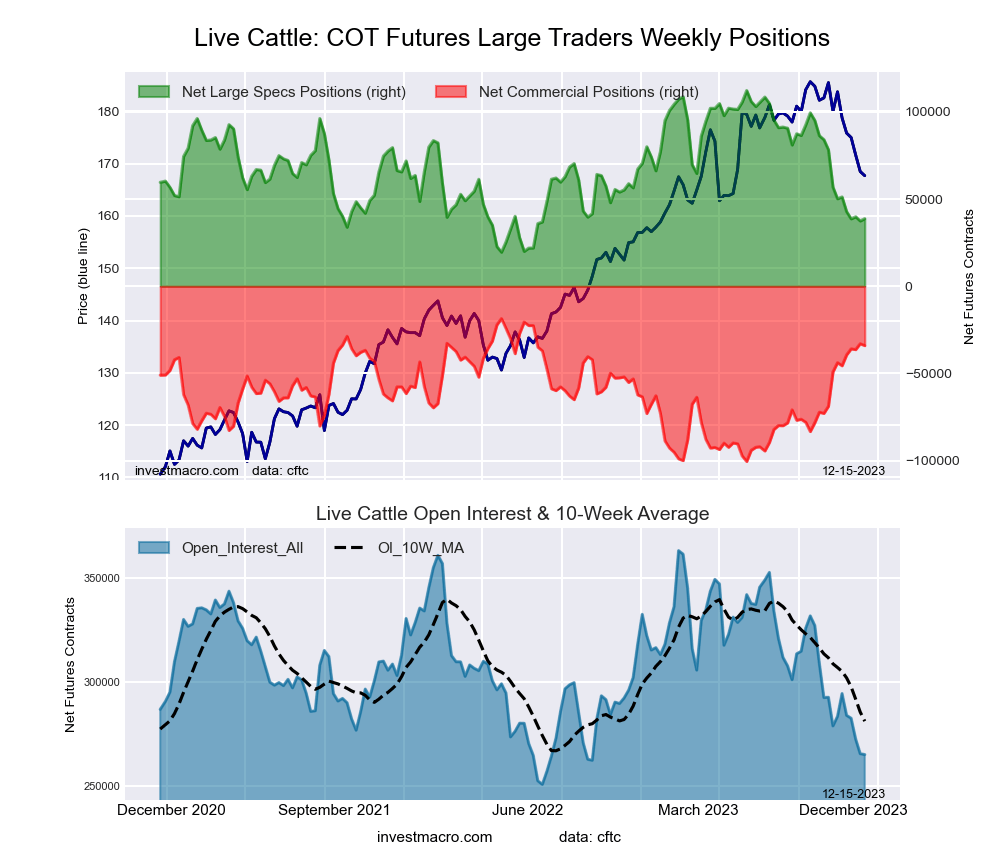
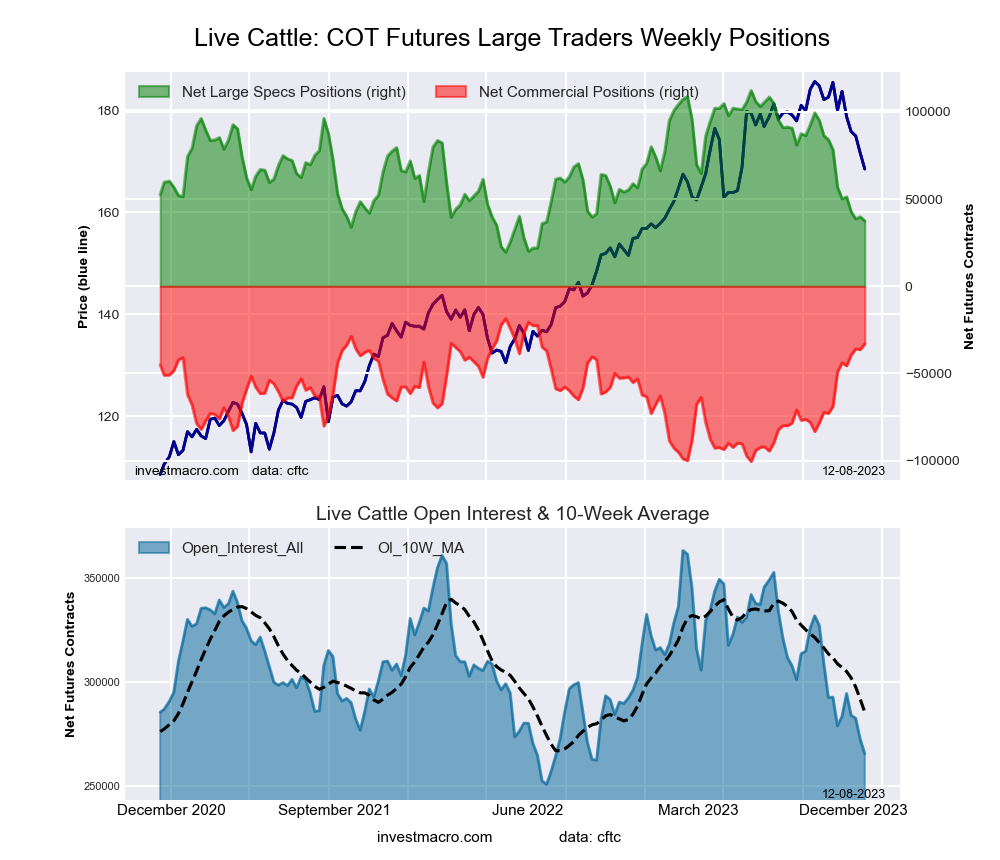
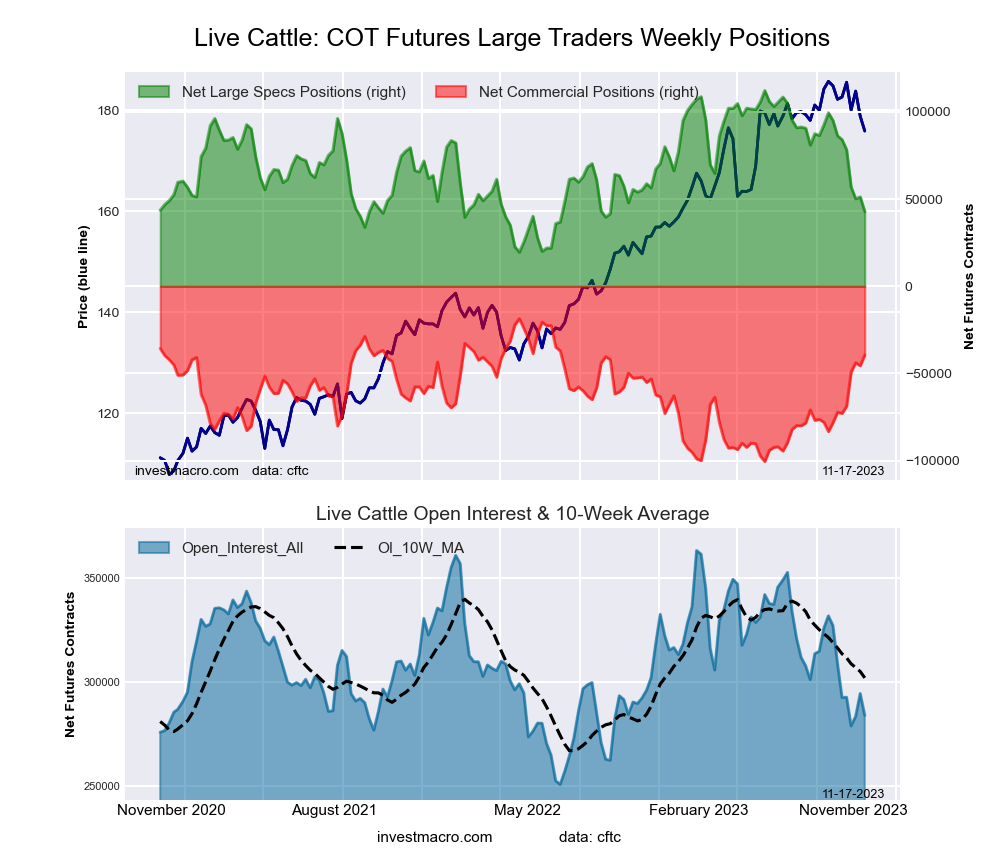
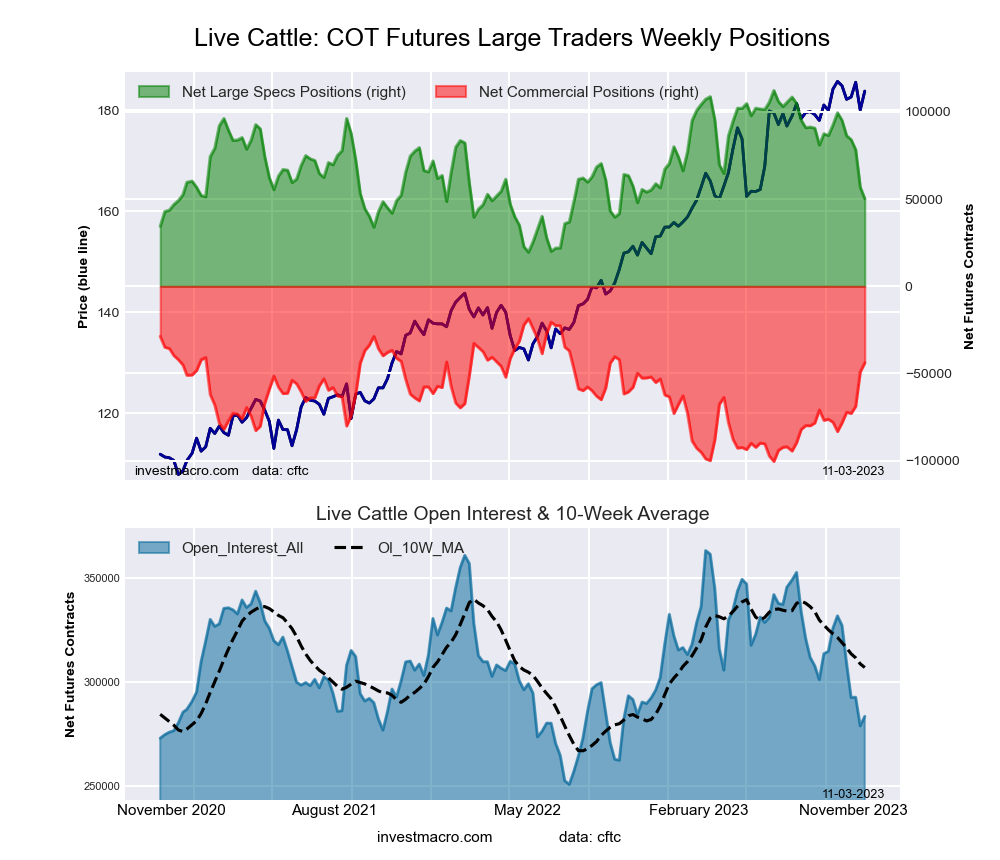
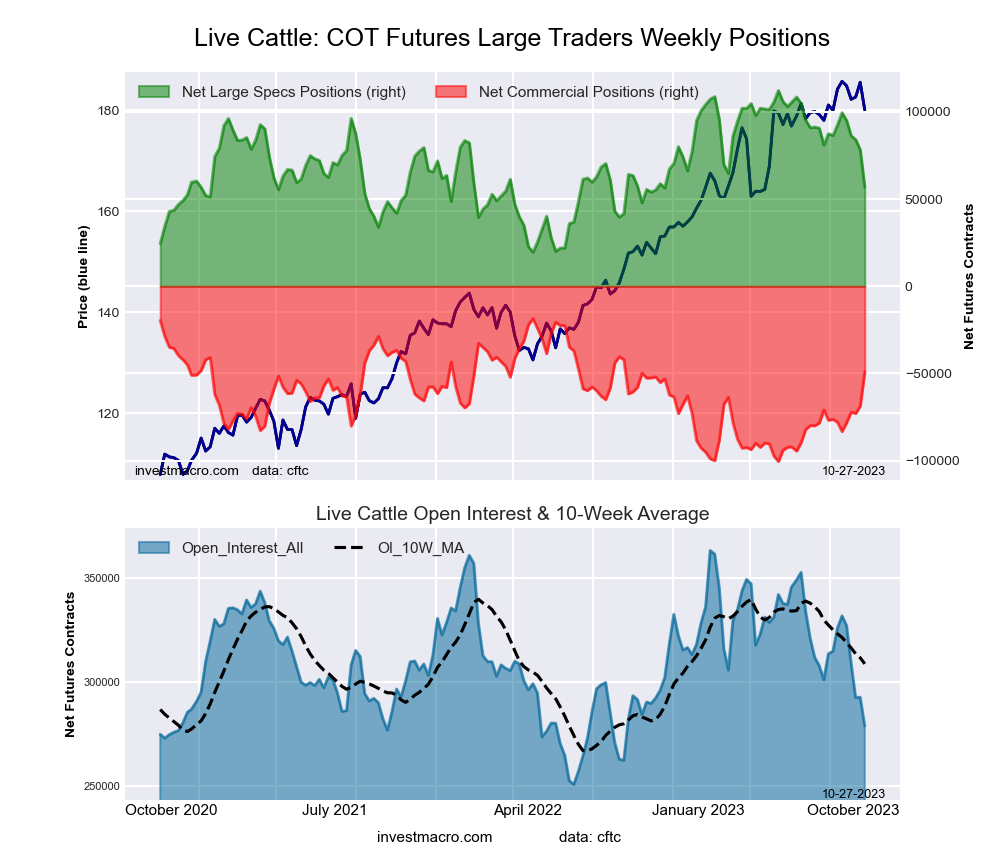
LIVE CATTLE Futures:
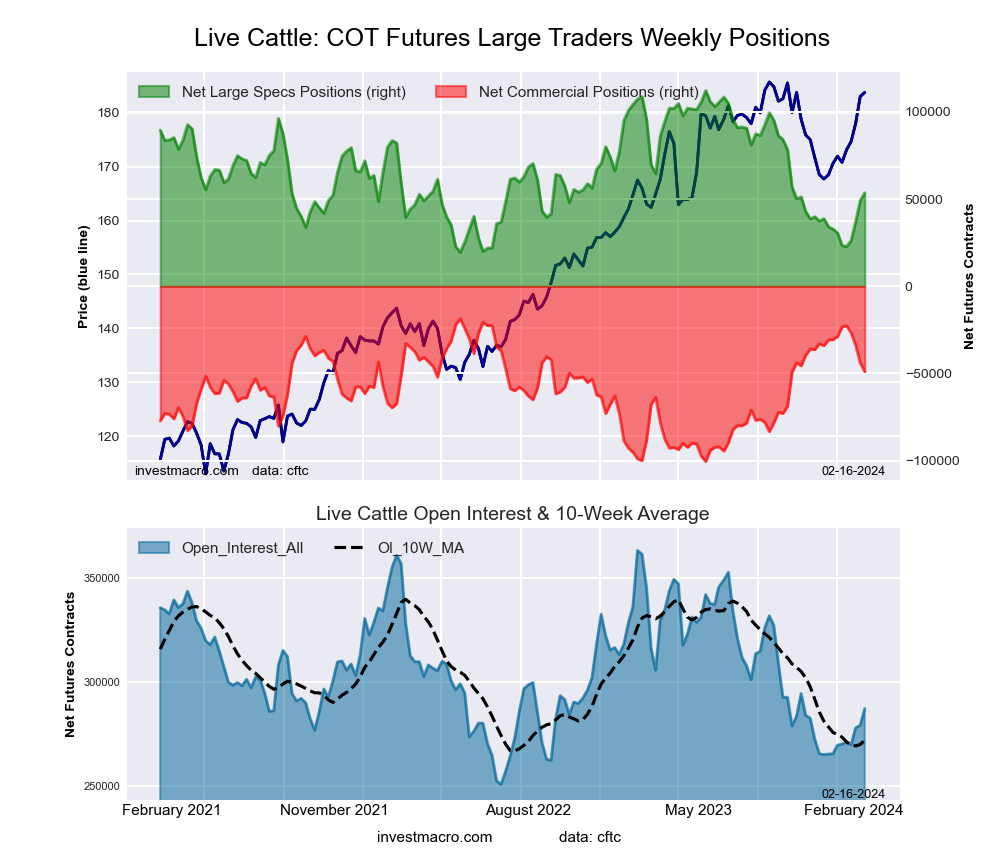 The LIVE CATTLE large speculator standing this week was a net position of 53,594 contracts in the data reported through Tuesday. This was a weekly lift of 4,440 contracts from the previous week which had a total of 49,154 net contracts.
This week’s current strength score (the trader positioning range over the past three years, measured from 0 to 100) shows the speculators are currently Bearish with a score of 36.7 percent. The commercials are Bullish with a score of 62.9 percent and the small traders (not shown in chart) are Bullish with a score of 65.2 percent.
Price Trend-Following Model: Weak Downtrend
Our weekly trend-following model classifies the current market price position as: Weak Downtrend. The current action for the model is considered to be: Hold – Maintain Short Position.
| LIVE CATTLE Futures Statistics | SPECULATORS | COMMERCIALS | SMALL TRADERS |
| – Percent of Open Interest Longs: | 34.0 | 37.6 | 11.1 |
| – Percent of Open Interest Shorts: | 15.3 | 54.7 | 12.7 |
| – Net Position: | 53,594 | -48,988 | -4,606 |
| – Gross Longs: | 97,639 | 108,023 | 31,859 |
| – Gross Shorts: | 44,045 | 157,011 | 36,465 |
| – Long to Short Ratio: | 2.2 to 1 | 0.7 to 1 | 0.9 to 1 |
| NET POSITION TREND: | |||
| – Strength Index Score (3 Year Range Pct): | 36.7 | 62.9 | 65.2 |
| – Strength Index Reading (3 Year Range): | Bearish | Bullish | Bullish |
| NET POSITION MOVEMENT INDEX: | |||
| – 6-Week Change in Strength Index: | 24.7 | -24.6 | -14.8 |
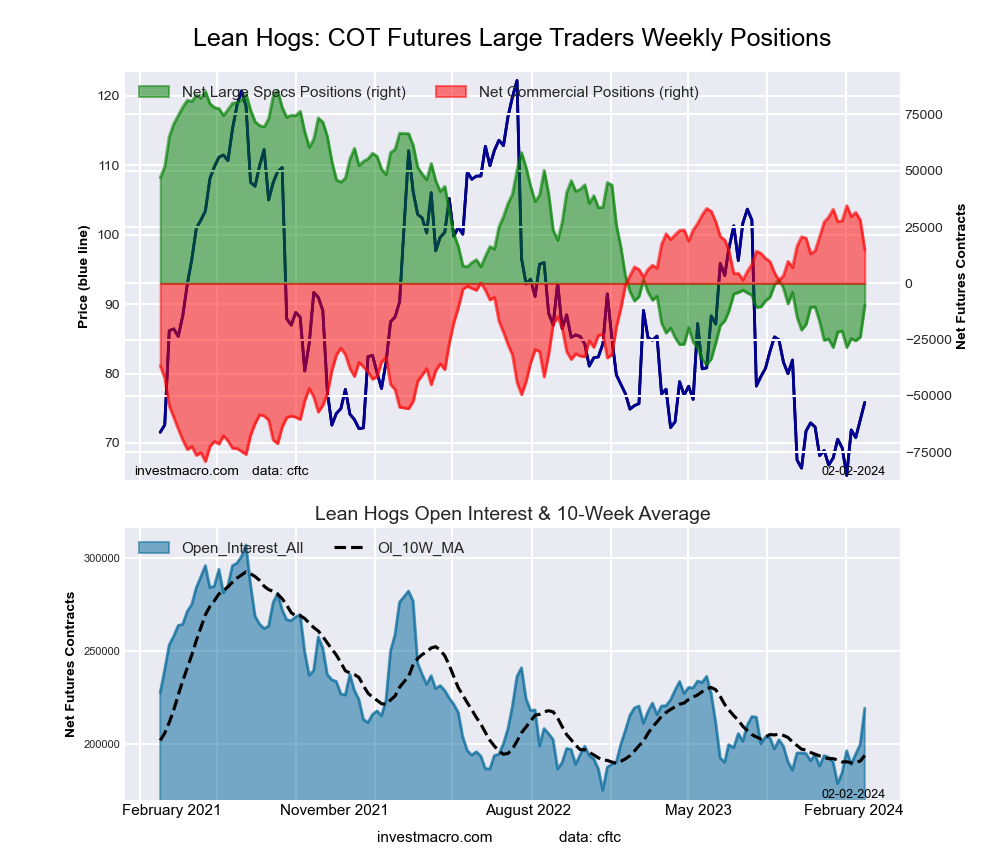
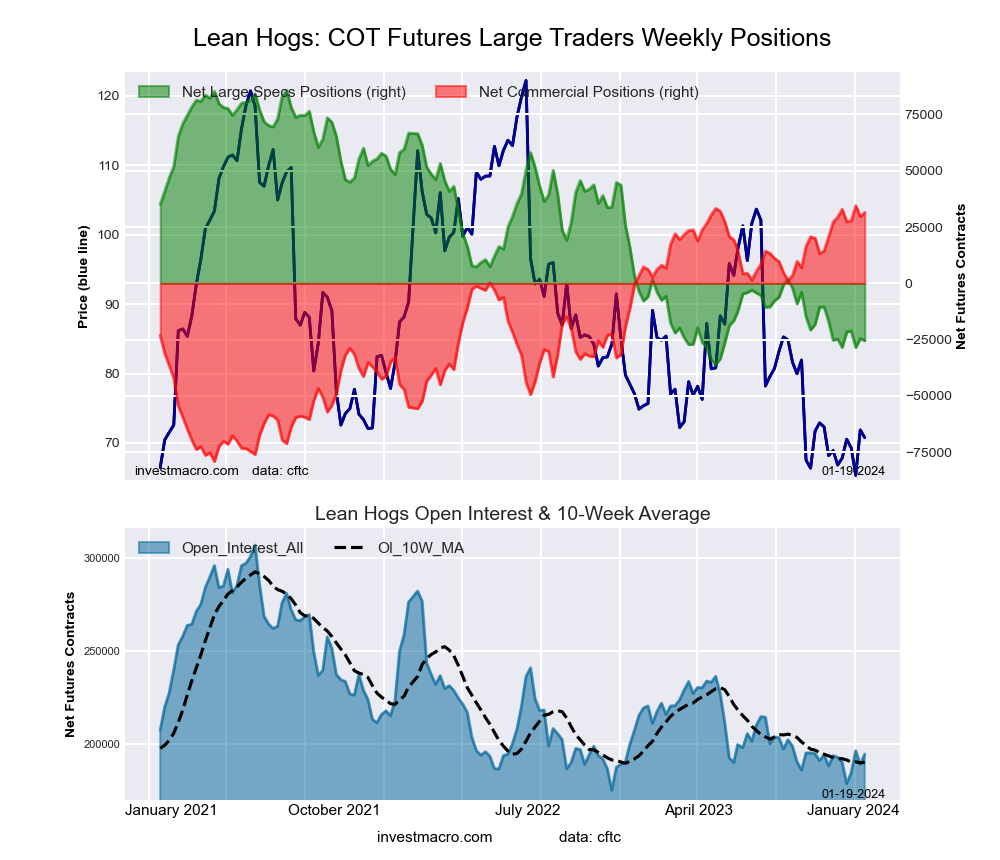
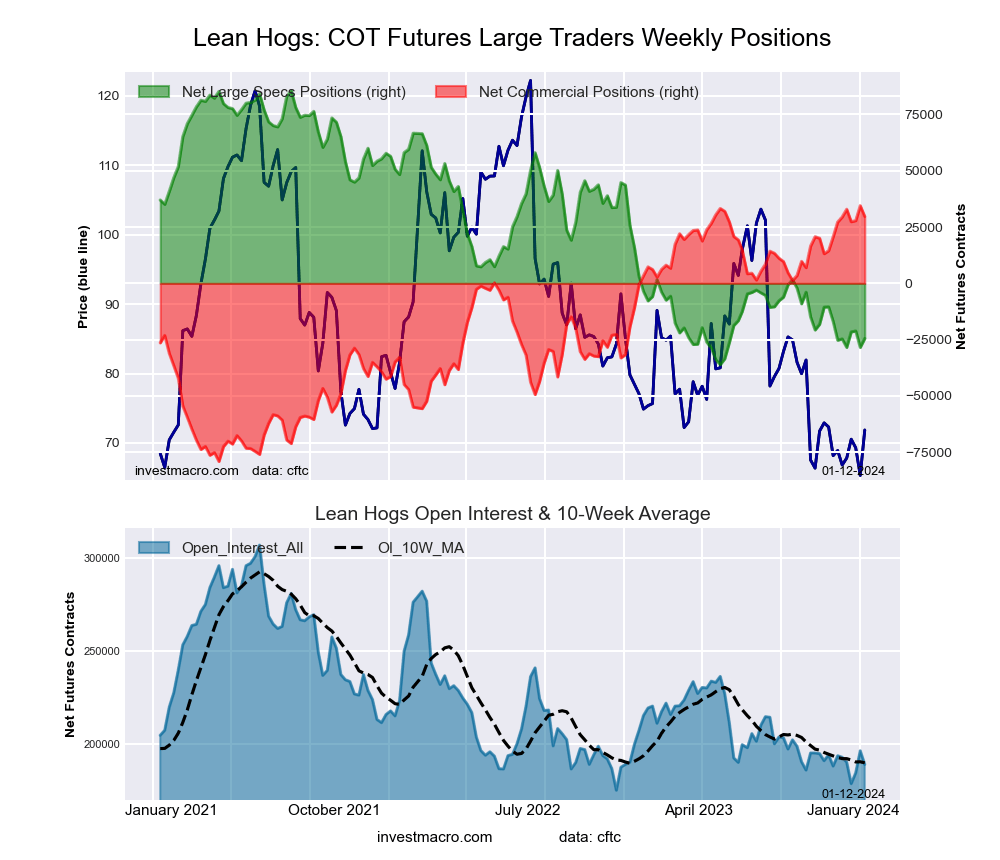
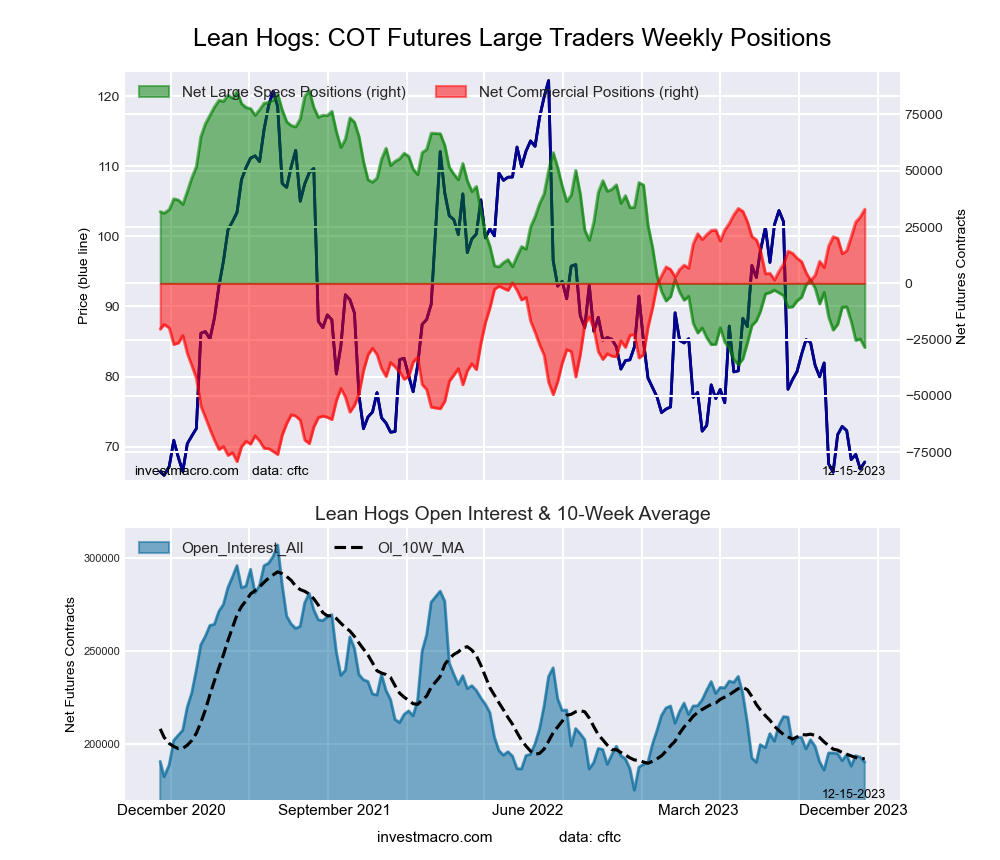
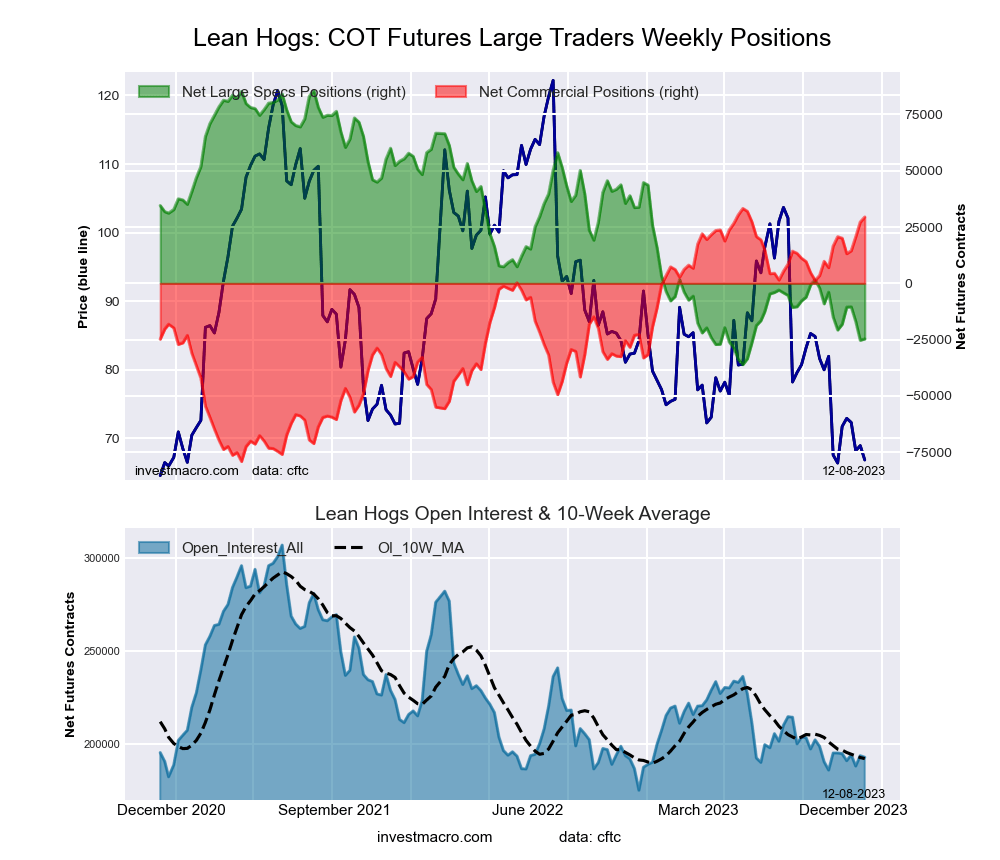
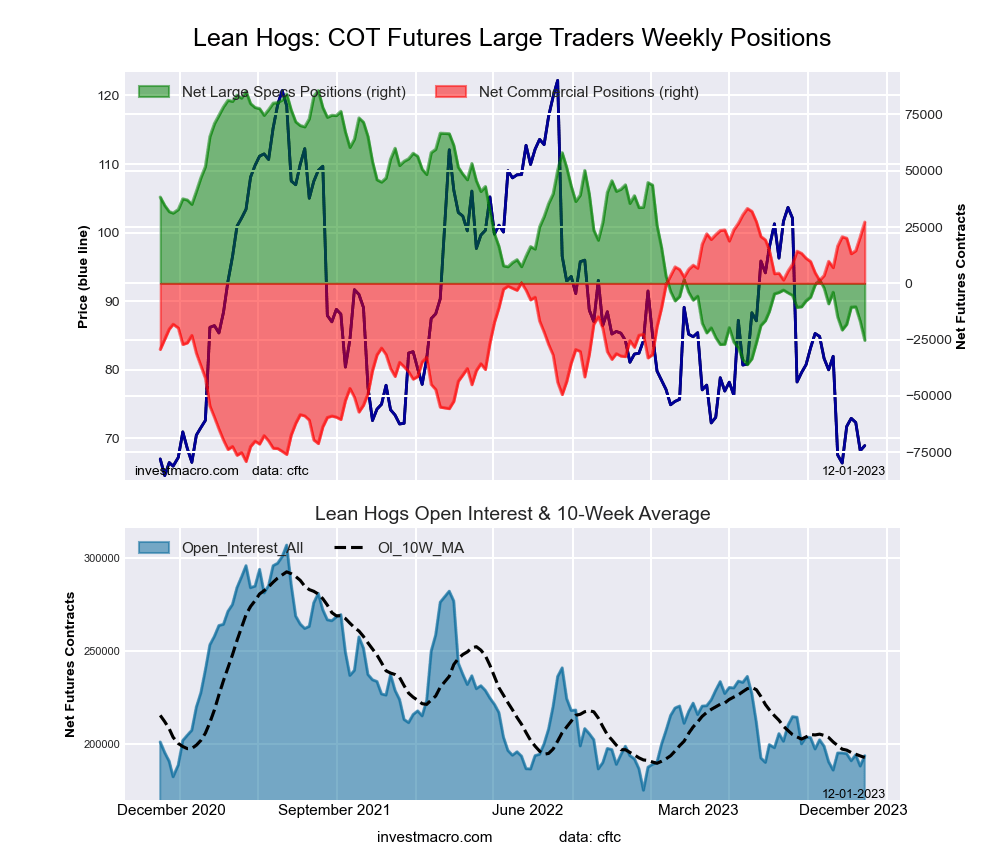
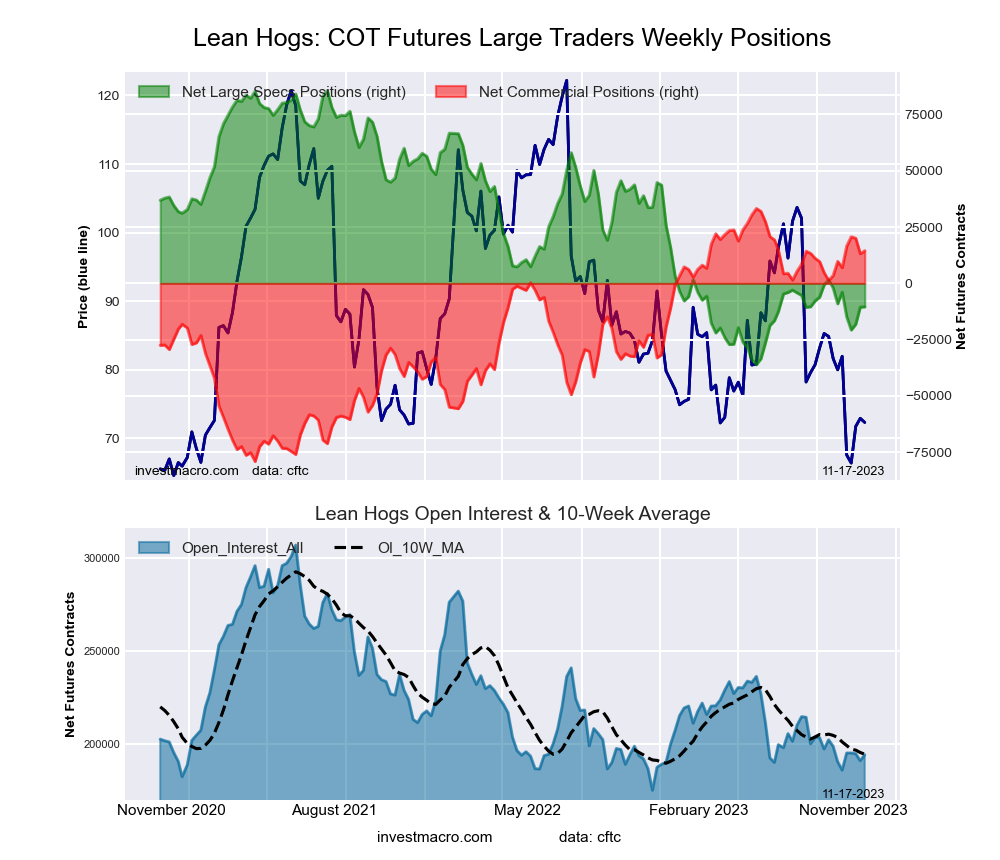
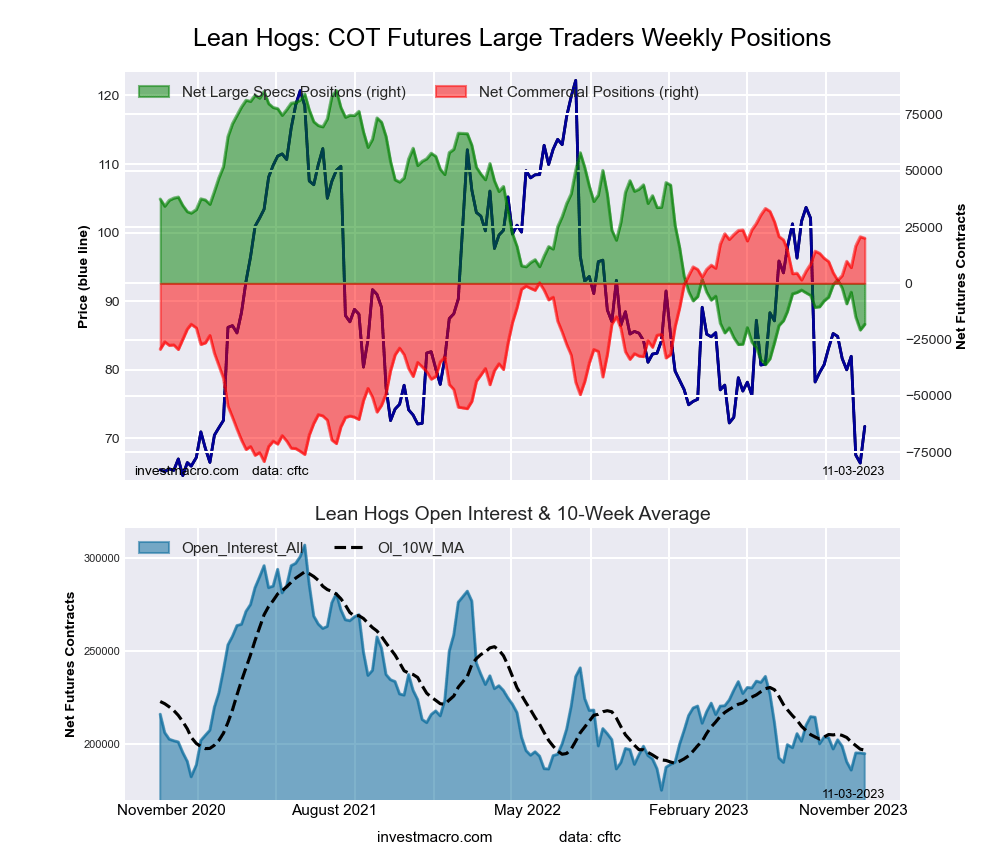
LEAN HOGS Futures:
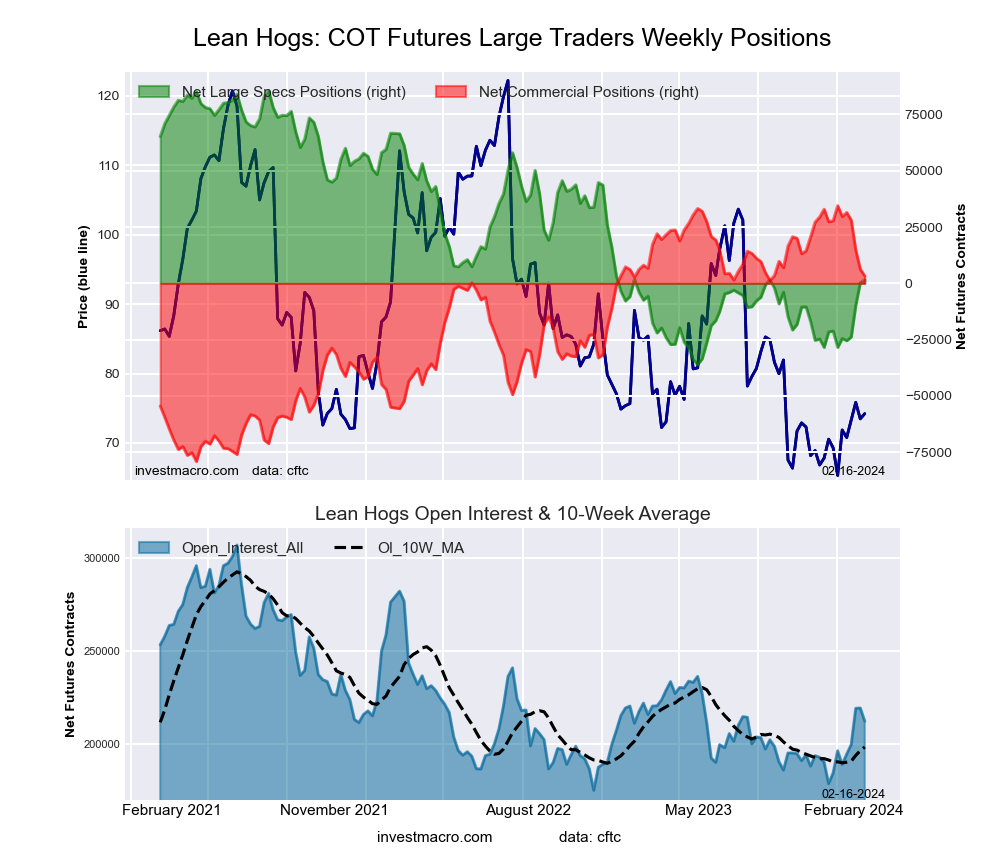 The LEAN HOGS large speculator standing this week was a net position of 1,579 contracts in the data reported through Tuesday. This was a weekly gain of 1,384 contracts from the previous week which had a total of 195 net contracts.
This week’s current strength score (the trader positioning range over the past three years, measured from 0 to 100) shows the speculators are currently Bearish with a score of 31.0 percent. The commercials are Bullish with a score of 72.5 percent and the small traders (not shown in chart) are Bullish with a score of 61.7 percent.
Price Trend-Following Model: Strong Uptrend
Our weekly trend-following model classifies the current market price position as: Strong Uptrend. The current action for the model is considered to be: New Buy – Long Position.
| LEAN HOGS Futures Statistics | SPECULATORS | COMMERCIALS | SMALL TRADERS |
| – Percent of Open Interest Longs: | 33.4 | 39.1 | 8.7 |
| – Percent of Open Interest Shorts: | 32.7 | 37.6 | 11.0 |
| – Net Position: | 1,579 | 3,243 | -4,822 |
| – Gross Longs: | 70,928 | 82,947 | 18,474 |
| – Gross Shorts: | 69,349 | 79,704 | 23,296 |
| – Long to Short Ratio: | 1.0 to 1 | 1.0 to 1 | 0.8 to 1 |
| NET POSITION TREND: | |||
| – Strength Index Score (3 Year Range Pct): | 31.0 | 72.5 | 61.7 |
| – Strength Index Reading (3 Year Range): | Bearish | Bullish | Bullish |
| NET POSITION MOVEMENT INDEX: | |||
| – 6-Week Change in Strength Index: | 24.7 | -27.5 | 5.4 |
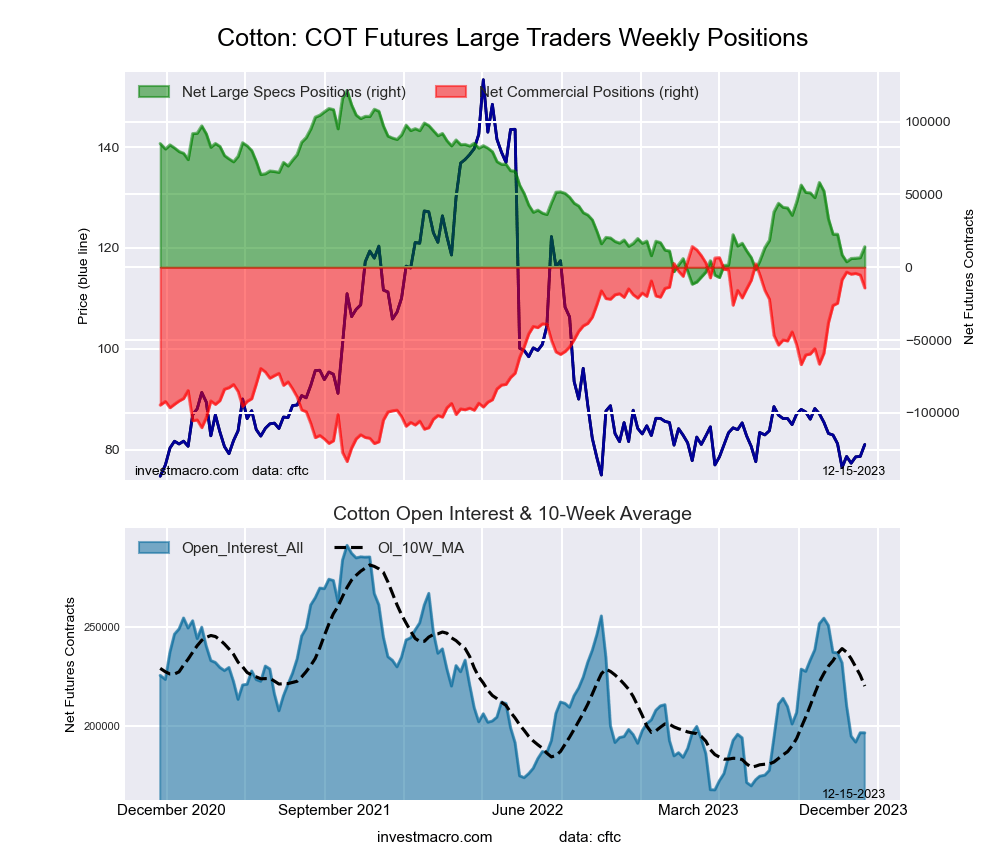
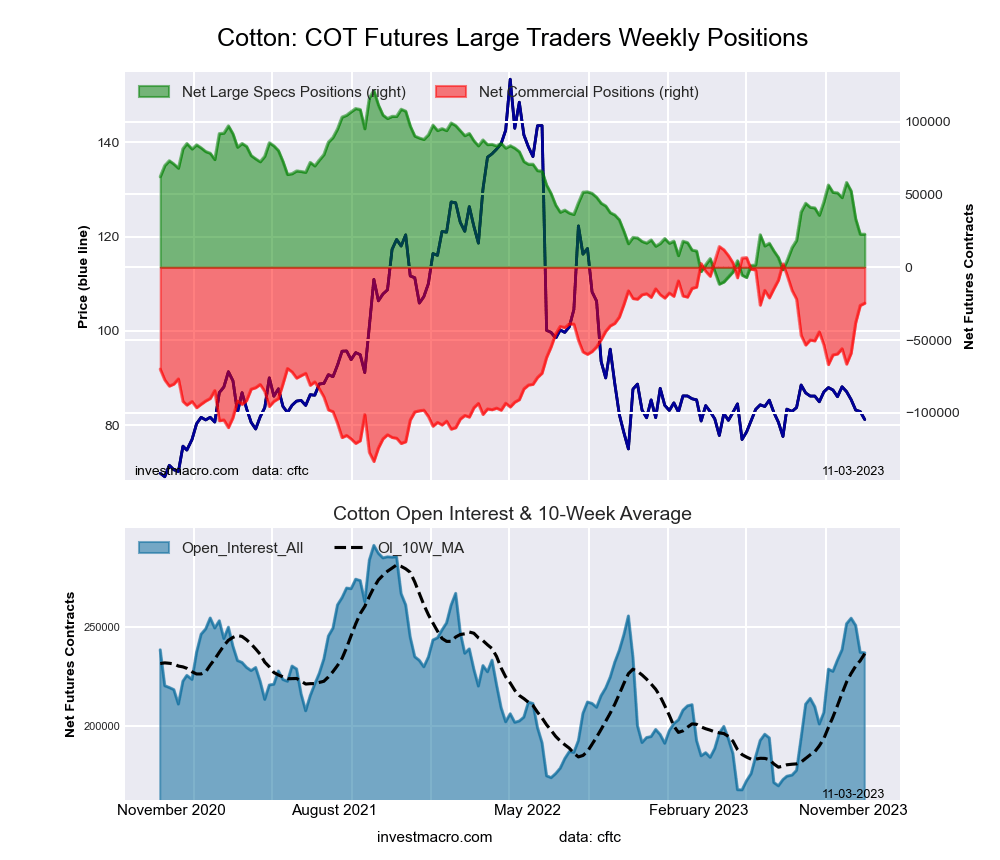
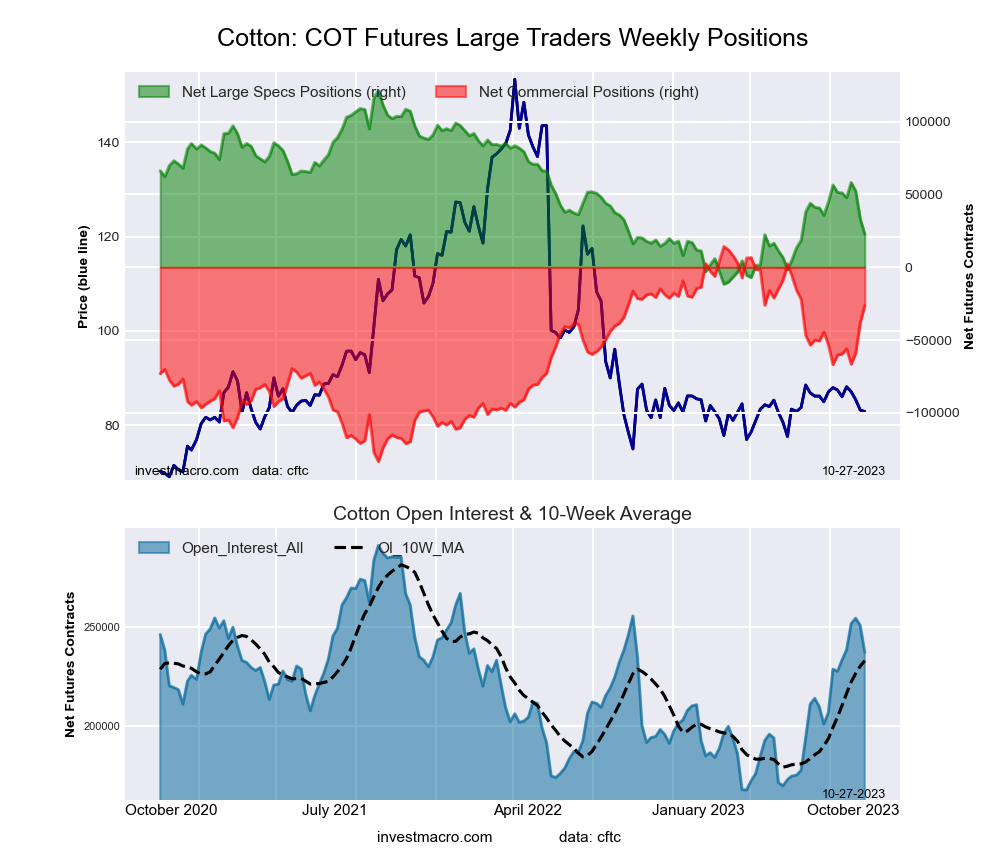
COTTON Futures:
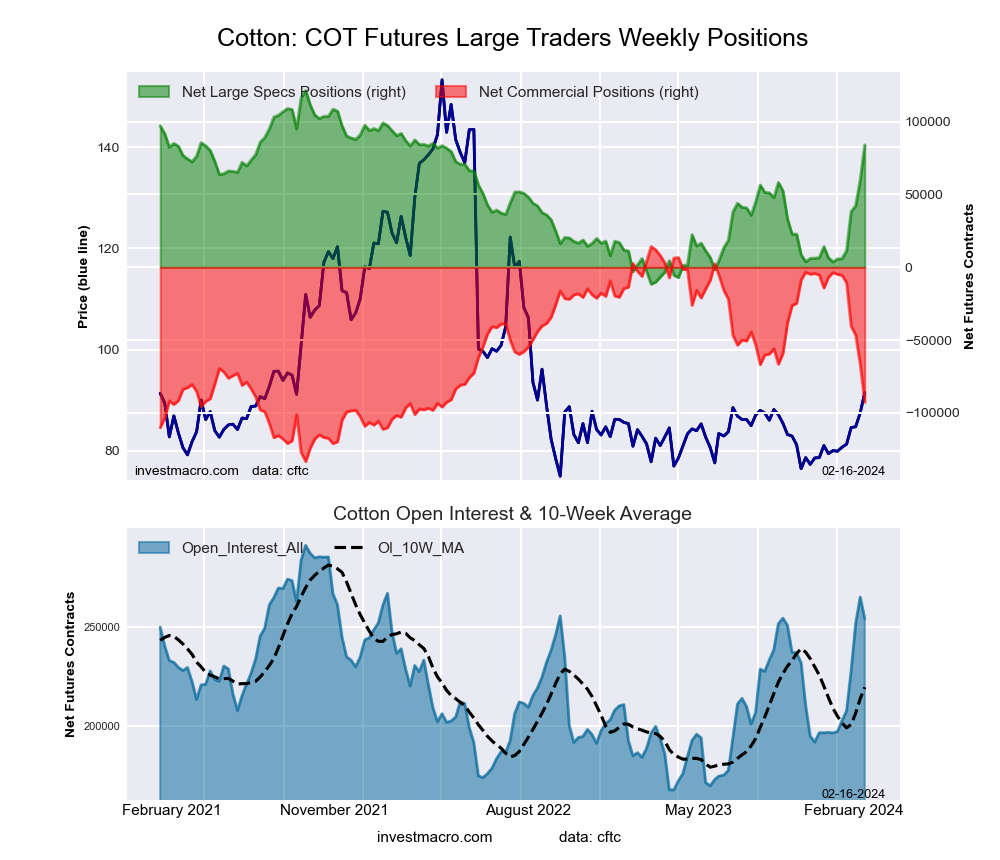 The COTTON large speculator standing this week was a net position of 83,935 contracts in the data reported through Tuesday. This was a weekly lift of 24,092 contracts from the previous week which had a total of 59,843 net contracts.
This week’s current strength score (the trader positioning range over the past three years, measured from 0 to 100) shows the speculators are currently Bullish with a score of 71.9 percent. The commercials are Bearish with a score of 27.6 percent and the small traders (not shown in chart) are Bullish with a score of 68.4 percent.
Price Trend-Following Model: Strong Uptrend
Our weekly trend-following model classifies the current market price position as: Strong Uptrend. The current action for the model is considered to be: Hold – Maintain Long Position.
| COTTON Futures Statistics | SPECULATORS | COMMERCIALS | SMALL TRADERS |
| – Percent of Open Interest Longs: | 40.3 | 36.8 | 7.1 |
| – Percent of Open Interest Shorts: | 7.2 | 73.2 | 3.7 |
| – Net Position: | 83,935 | -92,565 | 8,630 |
| – Gross Longs: | 102,360 | 93,505 | 17,952 |
| – Gross Shorts: | 18,425 | 186,070 | 9,322 |
| – Long to Short Ratio: | 5.6 to 1 | 0.5 to 1 | 1.9 to 1 |
| NET POSITION TREND: | |||
| – Strength Index Score (3 Year Range Pct): | 71.9 | 27.6 | 68.4 |
| – Strength Index Reading (3 Year Range): | Bullish | Bearish | Bullish |
| NET POSITION MOVEMENT INDEX: | |||
| – 6-Week Change in Strength Index: | 58.9 | -59.5 | 57.6 |
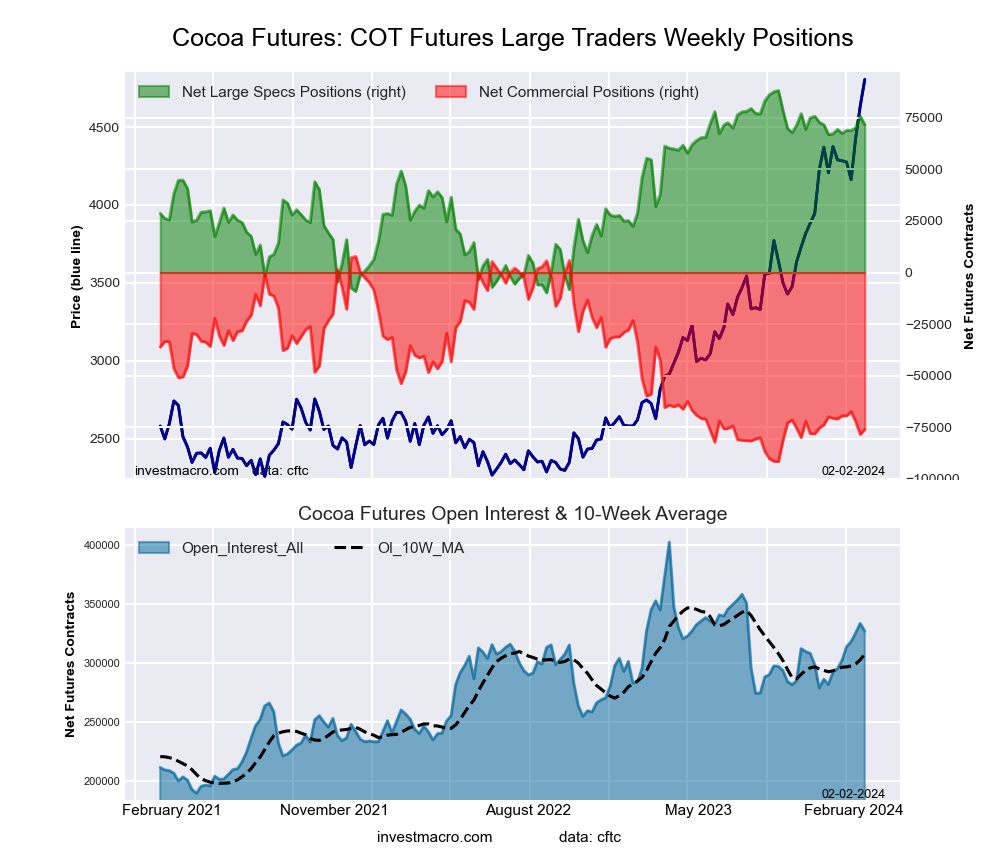
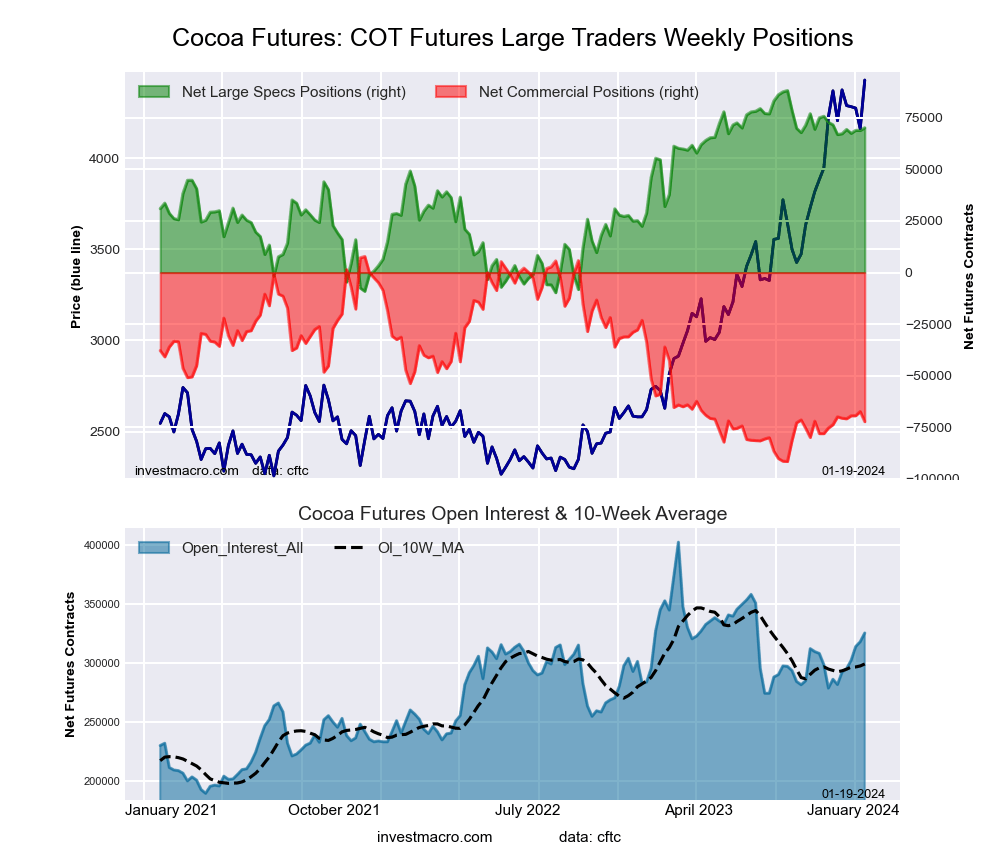
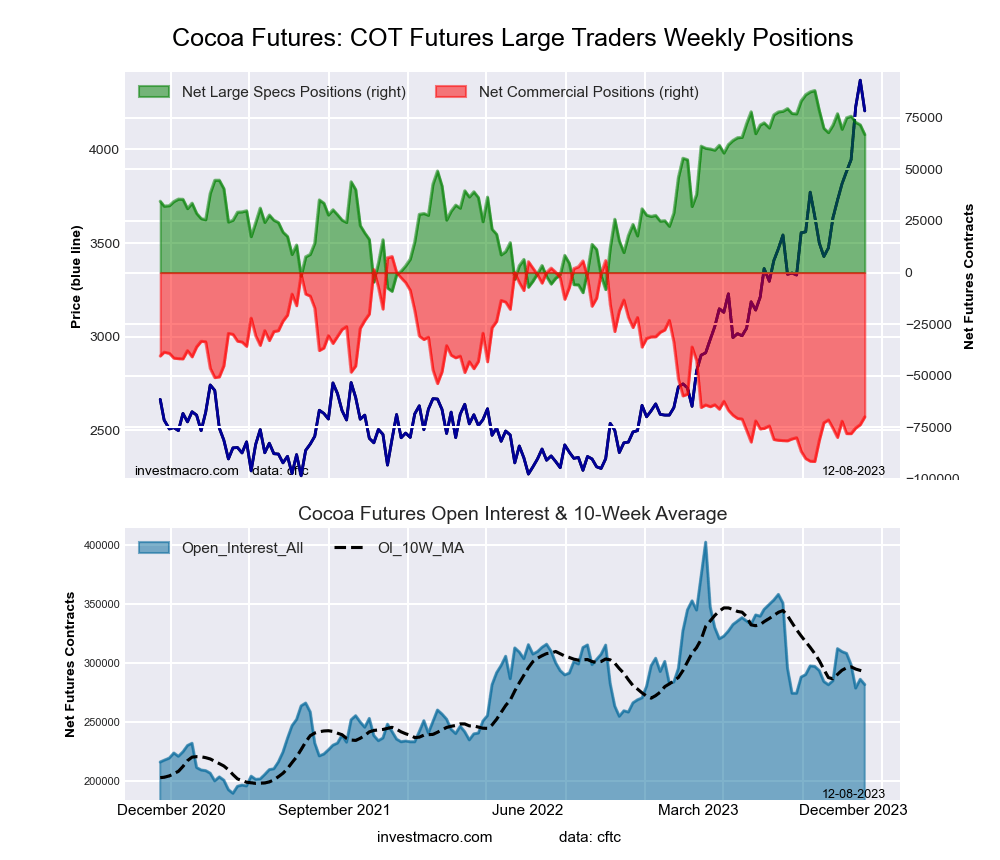
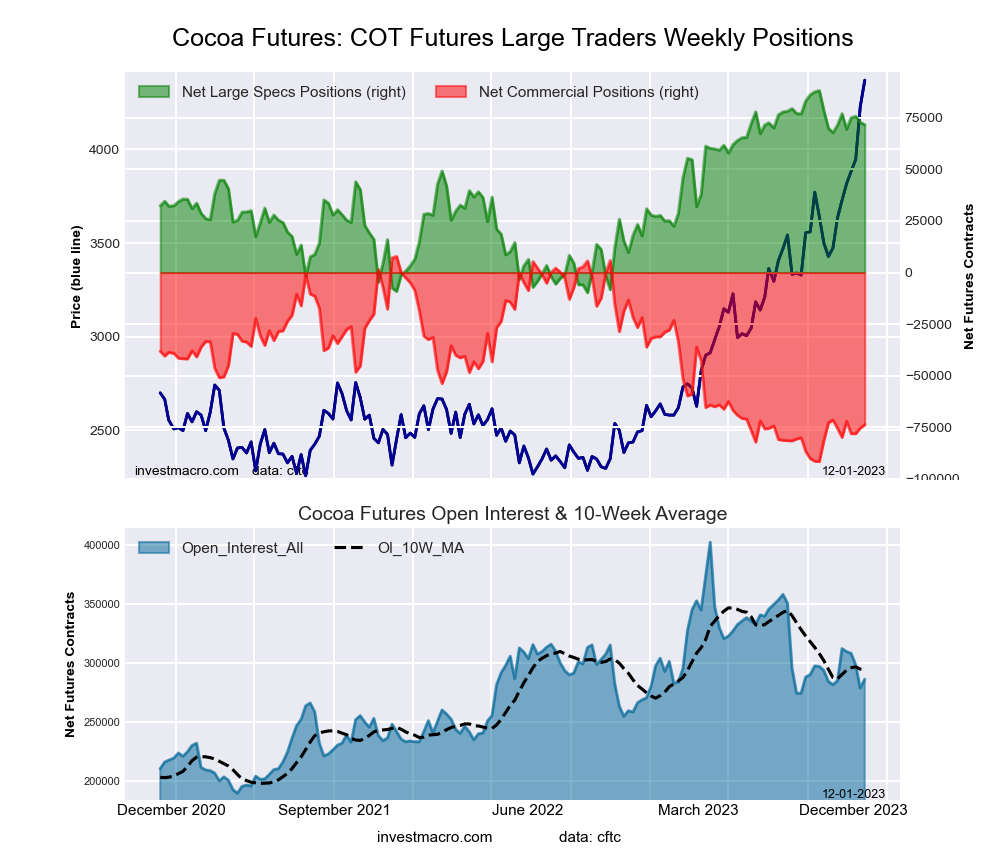
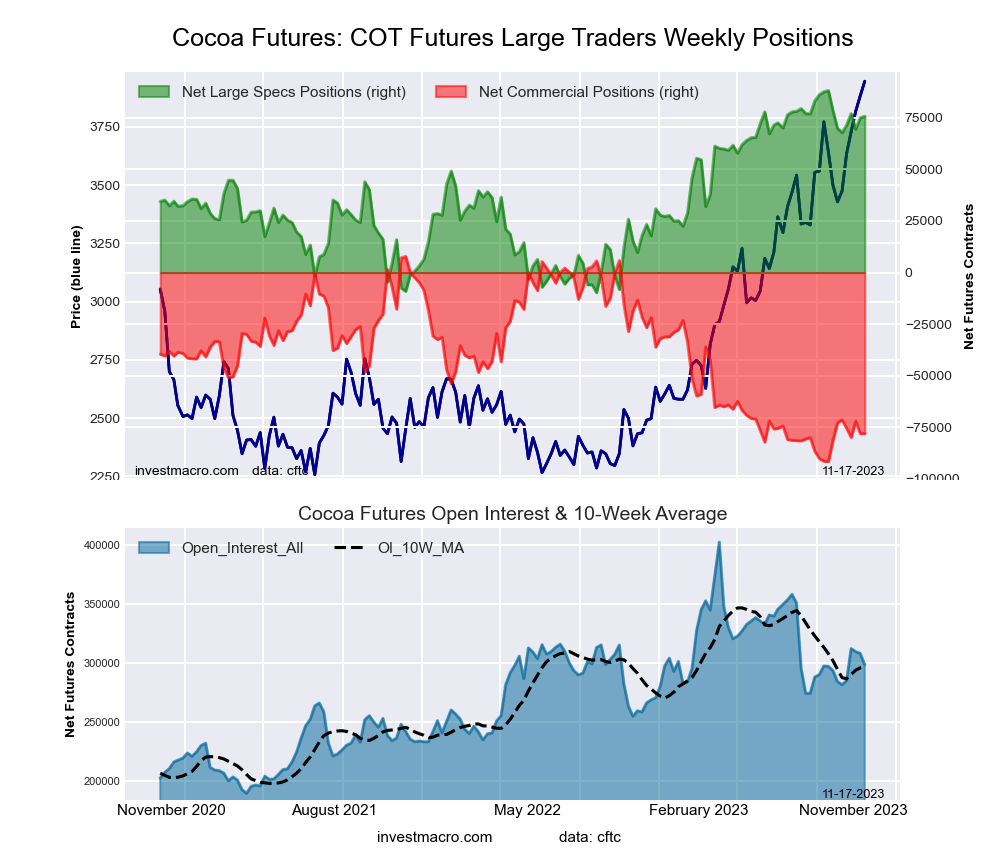
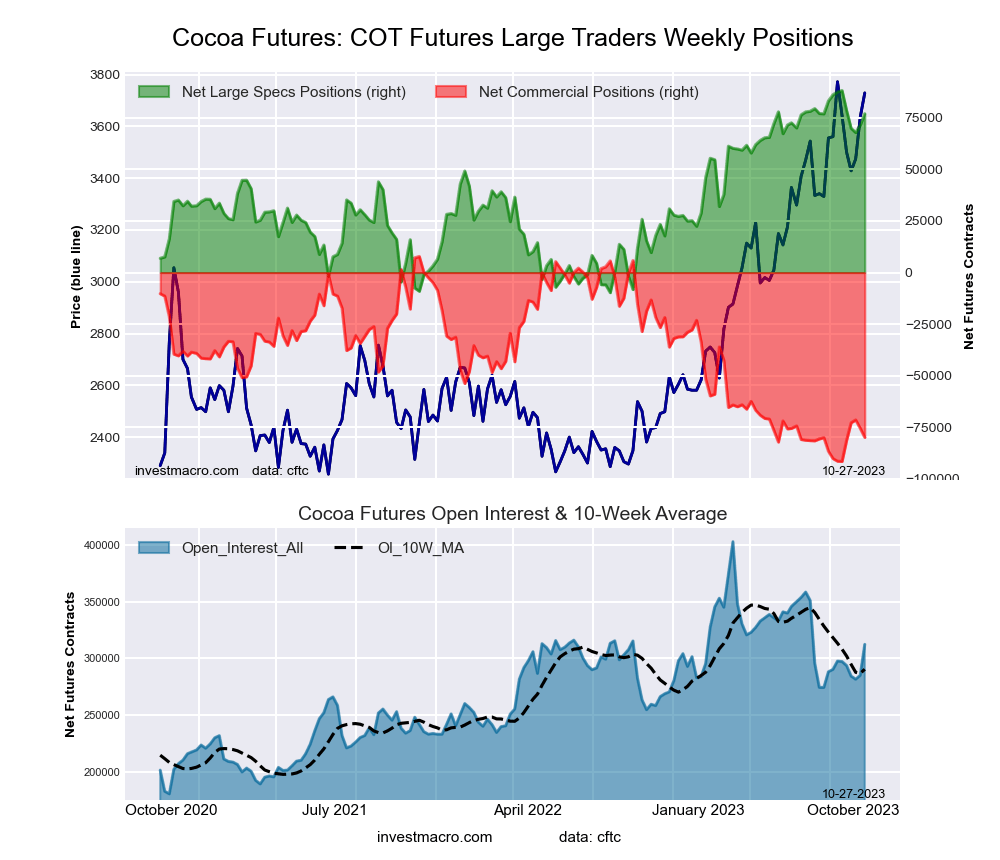
COCOA Futures:
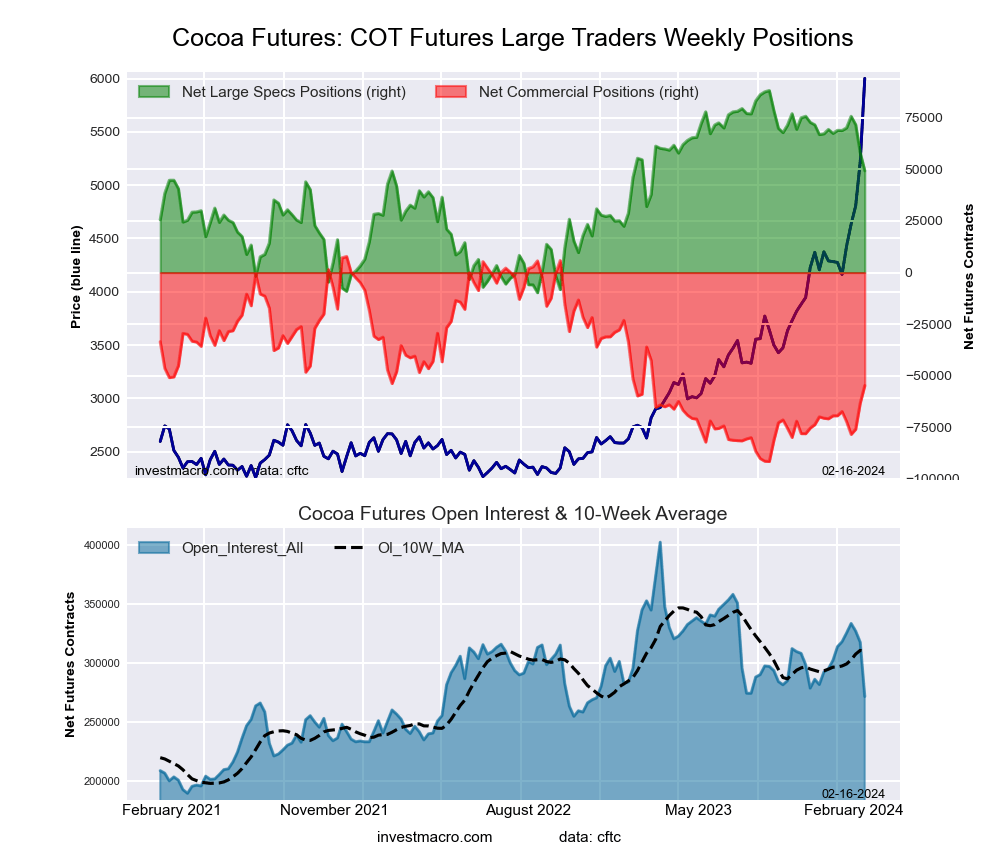 The COCOA large speculator standing this week was a net position of 49,351 contracts in the data reported through Tuesday. This was a weekly decrease of -8,763 contracts from the previous week which had a total of 58,114 net contracts.
This week’s current strength score (the trader positioning range over the past three years, measured from 0 to 100) shows the speculators are currently Bullish with a score of 60.3 percent. The commercials are Bearish with a score of 37.0 percent and the small traders (not shown in chart) are Bullish with a score of 58.8 percent.
Price Trend-Following Model: Strong Uptrend
Our weekly trend-following model classifies the current market price position as: Strong Uptrend. The current action for the model is considered to be: Hold – Maintain Long Position.
| COCOA Futures Statistics | SPECULATORS | COMMERCIALS | SMALL TRADERS |
| – Percent of Open Interest Longs: | 35.2 | 31.4 | 6.1 |
| – Percent of Open Interest Shorts: | 17.0 | 51.6 | 4.0 |
| – Net Position: | 49,351 | -54,822 | 5,471 |
| – Gross Longs: | 95,562 | 85,415 | 16,442 |
| – Gross Shorts: | 46,211 | 140,237 | 10,971 |
| – Long to Short Ratio: | 2.1 to 1 | 0.6 to 1 | 1.5 to 1 |
| NET POSITION TREND: | |||
| – Strength Index Score (3 Year Range Pct): | 60.3 | 37.0 | 58.8 |
| – Strength Index Reading (3 Year Range): | Bullish | Bearish | Bullish |
| NET POSITION MOVEMENT INDEX: | |||
| – 6-Week Change in Strength Index: | -20.0 | 14.7 | 42.4 |
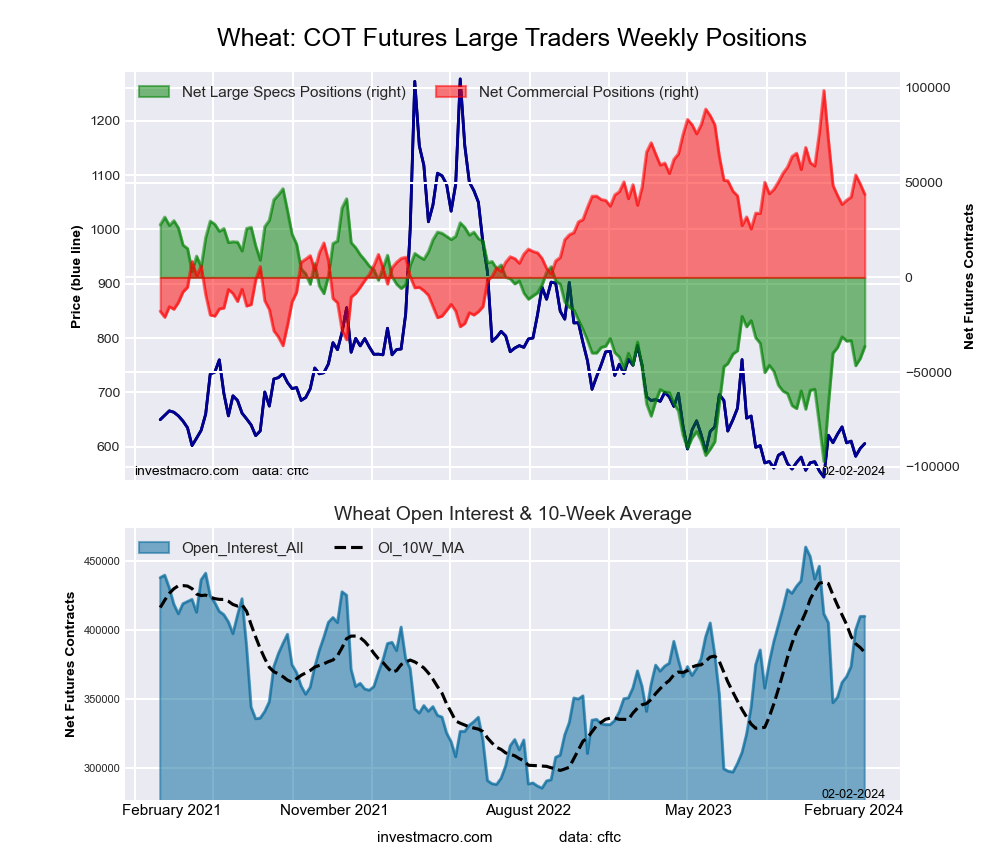
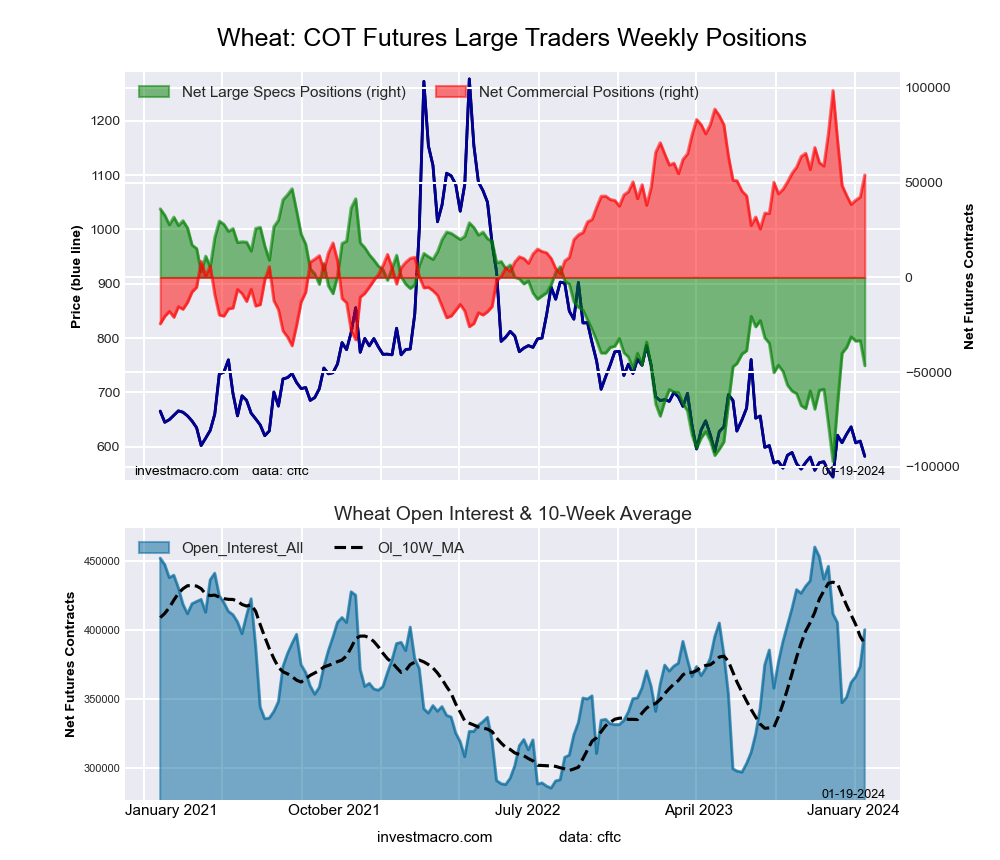
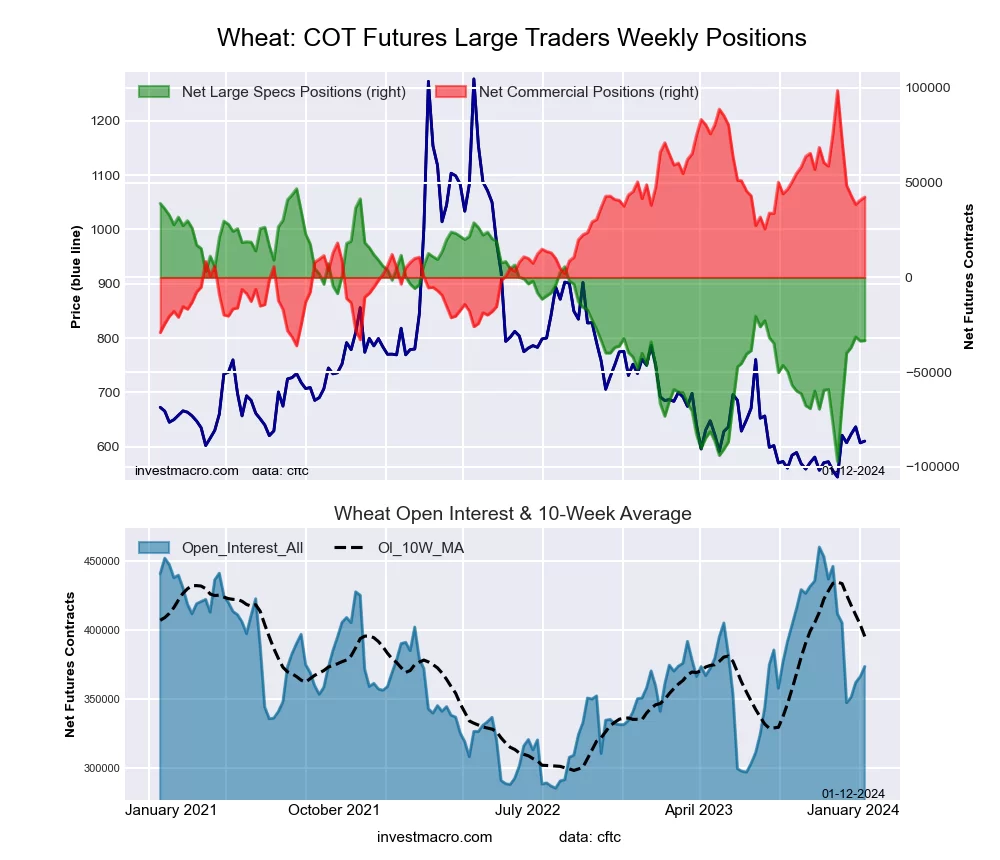
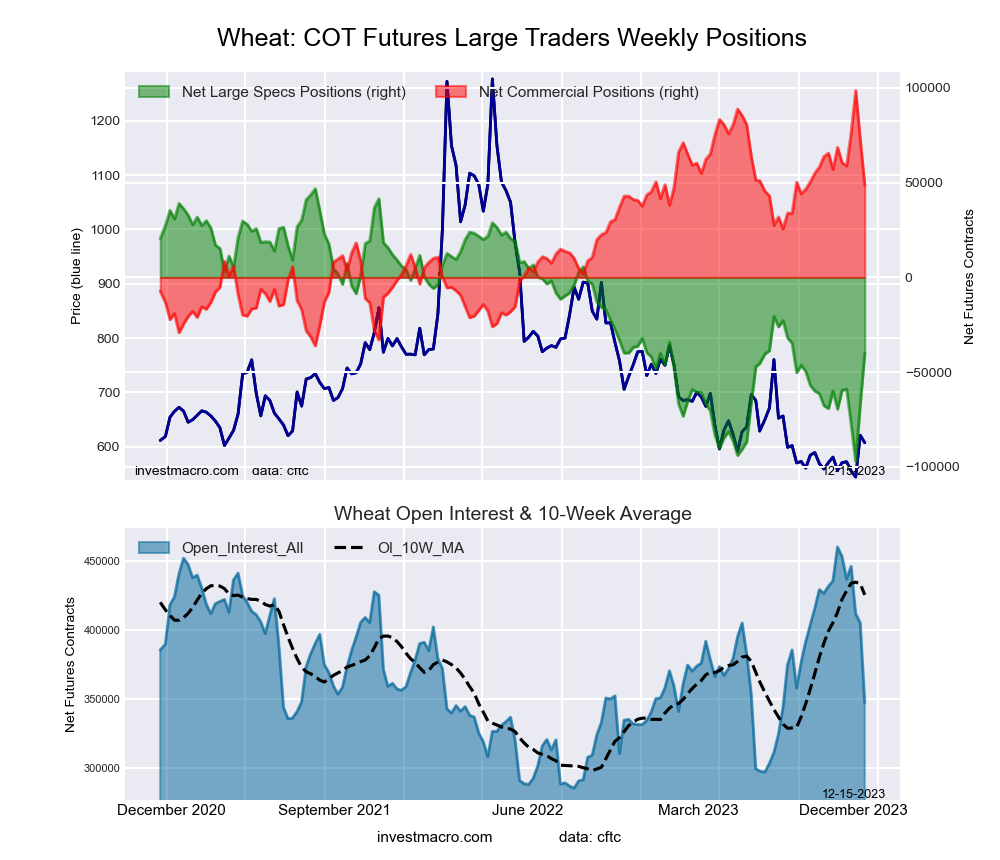
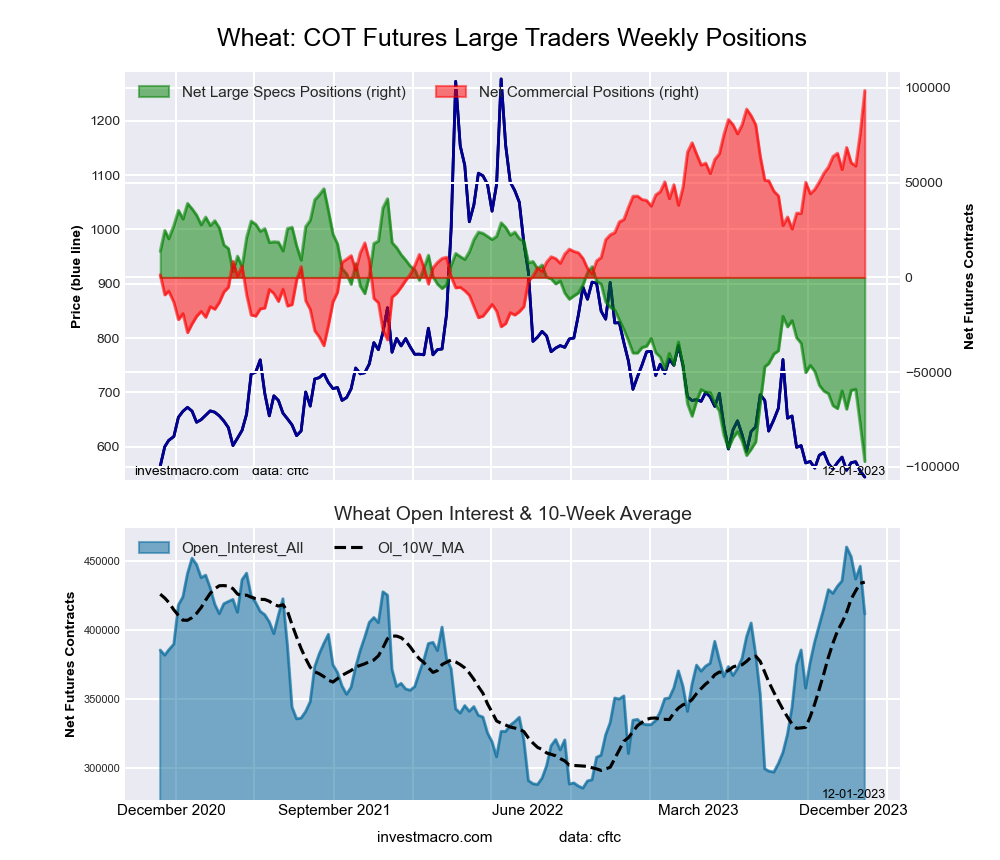
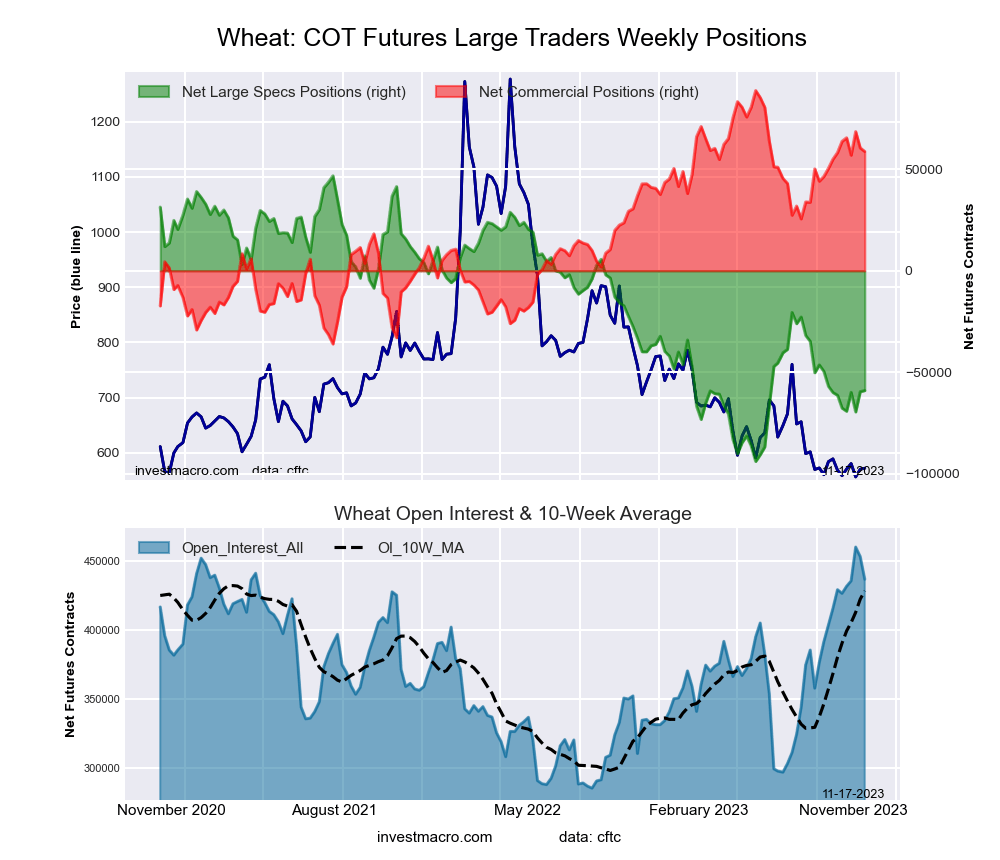
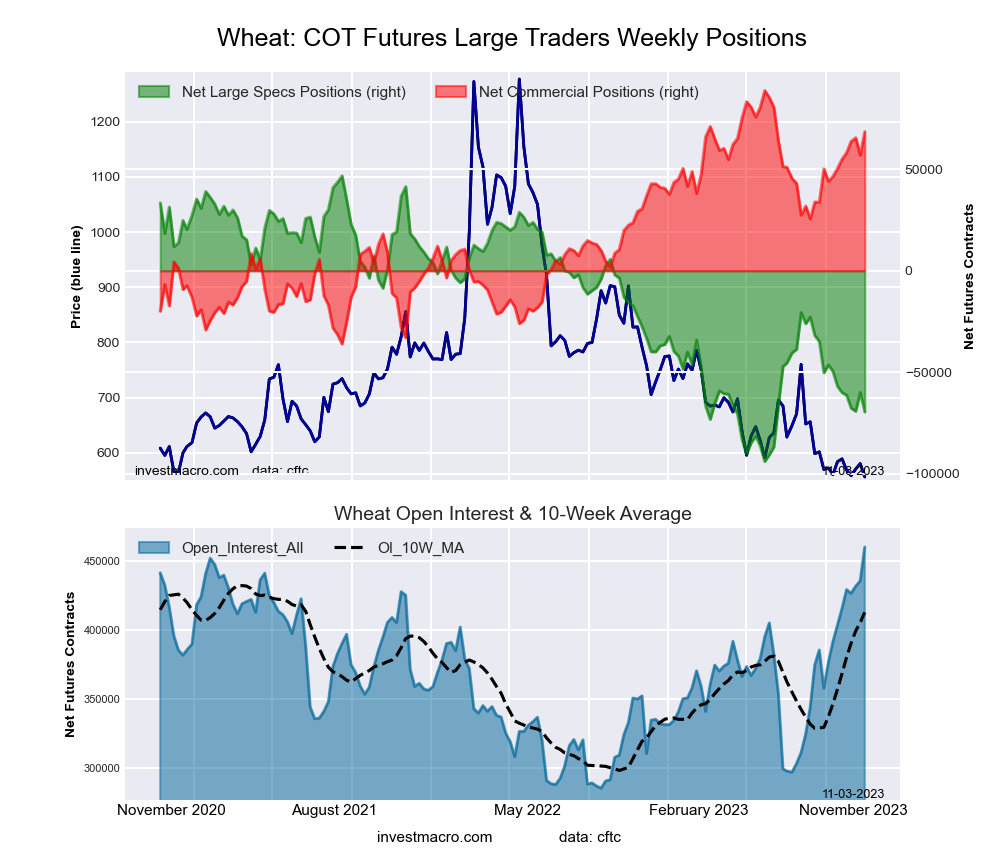
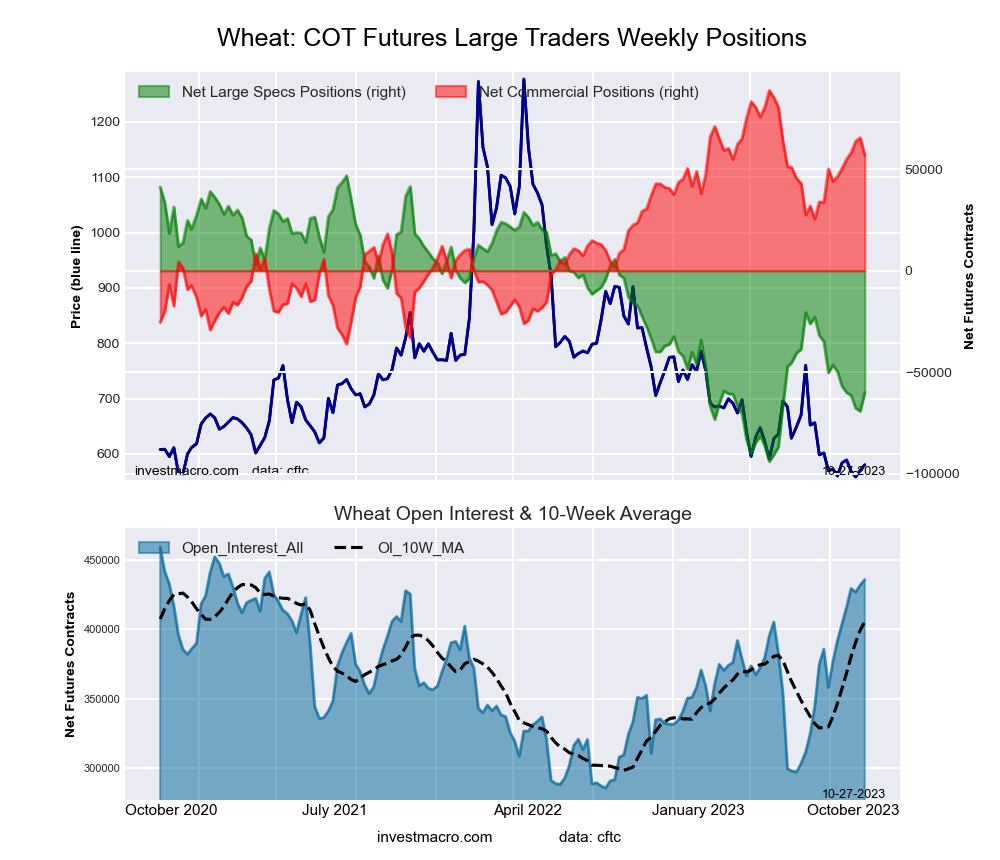
WHEAT Futures:
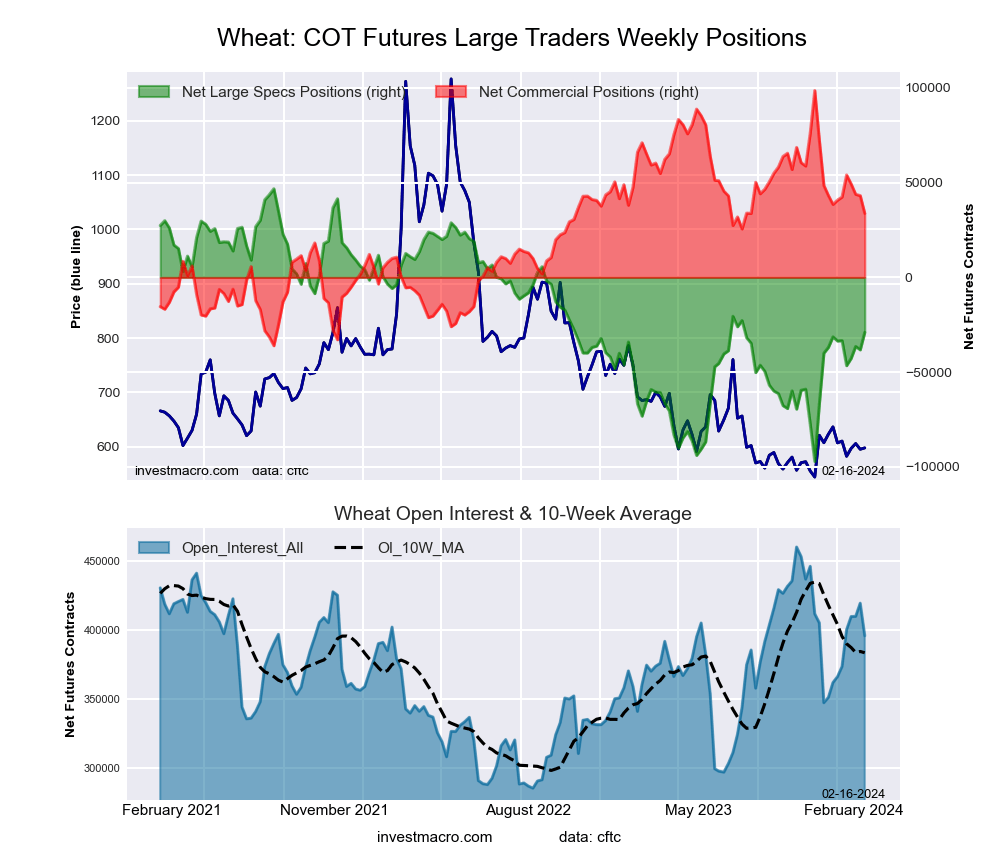 The WHEAT large speculator standing this week was a net position of -29,007 contracts in the data reported through Tuesday. This was a weekly rise of 9,277 contracts from the previous week which had a total of -38,284 net contracts.
This week’s current strength score (the trader positioning range over the past three years, measured from 0 to 100) shows the speculators are currently Bearish with a score of 47.4 percent. The commercials are Bullish with a score of 51.8 percent and the small traders (not shown in chart) are Bearish with a score of 45.5 percent.
Price Trend-Following Model: Weak Uptrend
Our weekly trend-following model classifies the current market price position as: Weak Uptrend. The current action for the model is considered to be: Hold – Maintain Long Position.
| WHEAT Futures Statistics | SPECULATORS | COMMERCIALS | SMALL TRADERS |
| – Percent of Open Interest Longs: | 31.5 | 36.4 | 7.5 |
| – Percent of Open Interest Shorts: | 38.9 | 27.8 | 8.7 |
| – Net Position: | -29,007 | 33,760 | -4,753 |
| – Gross Longs: | 124,909 | 143,969 | 29,853 |
| – Gross Shorts: | 153,916 | 110,209 | 34,606 |
| – Long to Short Ratio: | 0.8 to 1 | 1.3 to 1 | 0.9 to 1 |
| NET POSITION TREND: | |||
| – Strength Index Score (3 Year Range Pct): | 47.4 | 51.8 | 45.5 |
| – Strength Index Reading (3 Year Range): | Bearish | Bullish | Bearish |
| NET POSITION MOVEMENT INDEX: | |||
| – 6-Week Change in Strength Index: | 3.2 | -5.2 | 10.4 |
Article By InvestMacro – Receive our weekly COT Newsletter
*COT Report: The COT data, released weekly to the public each Friday, is updated through the most recent Tuesday (data is 3 days old) and shows a quick view of how large speculators or non-commercials (for-profit traders) were positioned in the futures markets.
The CFTC categorizes trader positions according to commercial hedgers (traders who use futures contracts for hedging as part of the business), non-commercials (large traders who speculate to realize trading profits) and nonreportable traders (usually small traders/speculators) as well as their open interest (contracts open in the market at time of reporting). See CFTC criteria here.


