By InvestMacro

Here are the latest charts and statistics for the Commitment of Traders (COT) reports data published by the Commodities Futures Trading Commission (CFTC).
The latest COT data is updated through Tuesday February 27th and shows a quick view of how large traders (for-profit speculators and commercial entities) were positioned in the futures markets.
Weekly Speculator Changes led by Corn & Lean Hogs
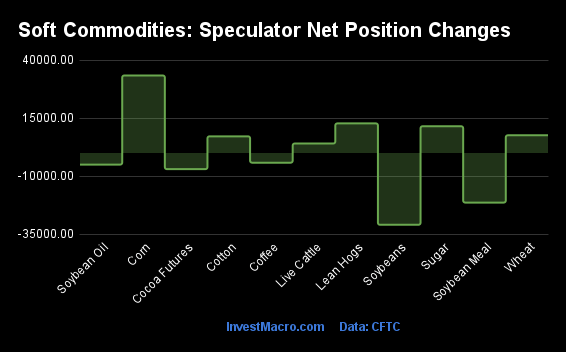
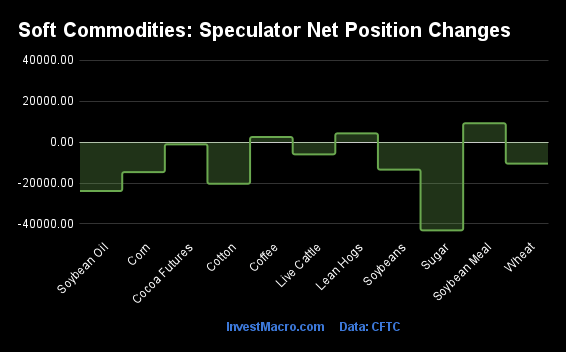
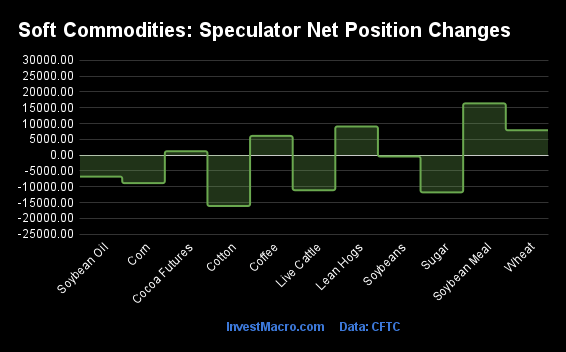
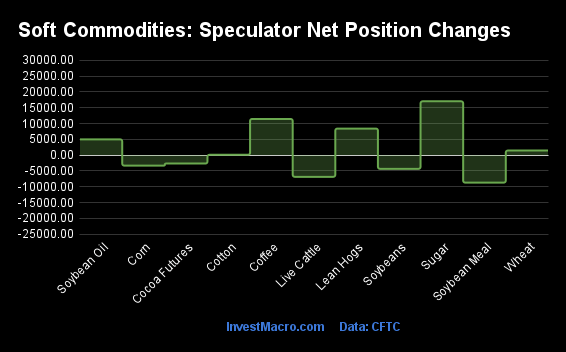
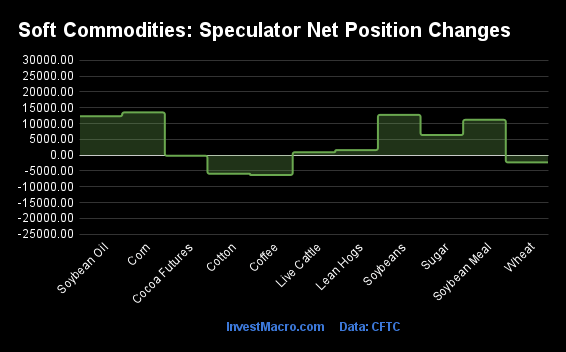
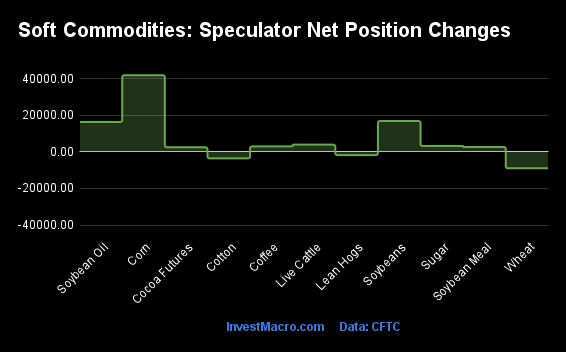
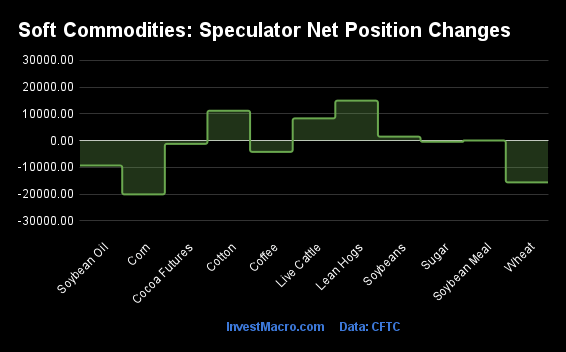
The COT soft commodities markets speculator bets were a bit higher this week as six out of the eleven softs markets we cover had higher positioning while the other five markets had lower speculator contracts.
Leading the gains for the softs markets was Corn (33,463 contracts) with Lean Hogs (12,790 contracts), Sugar (11,564 contracts), Wheat (7,658 contracts), Cotton (7,212 contracts) and Live Cattle (4,119 contracts) also showing positive weeks.
The markets with the declines in speculator bets this week were Soybean Meal (-21,367 contracts) with Soybeans (-30,944 contracts), Coffee (-4,163 contracts), Soybean Oil (-4,985 contracts) and Cocoa (-6,938 contracts) also registering lower bets on the week.
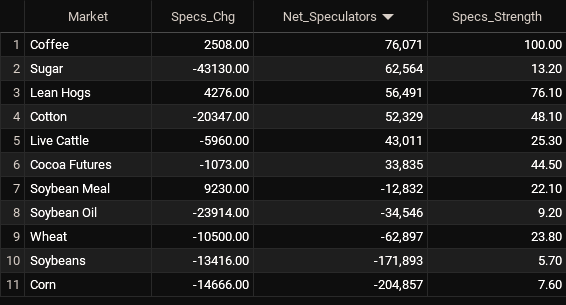
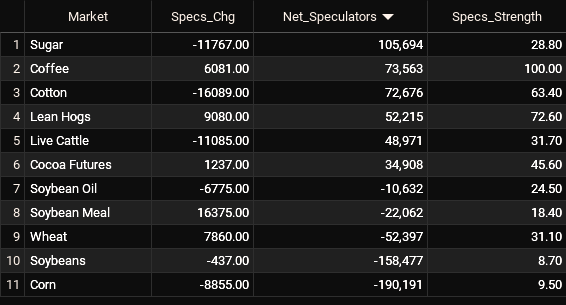
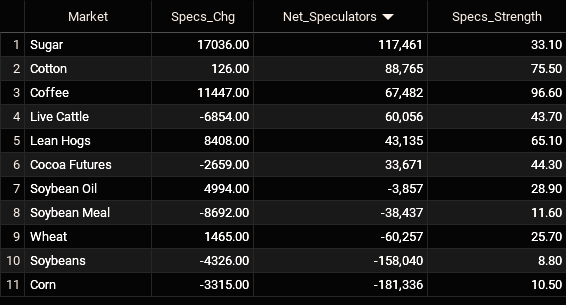
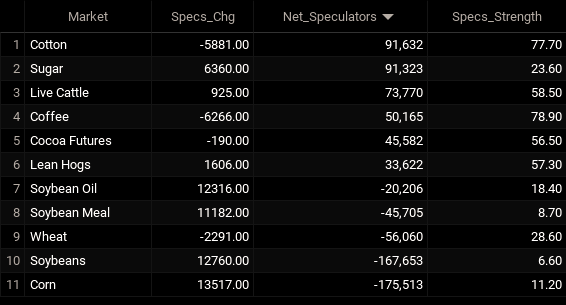
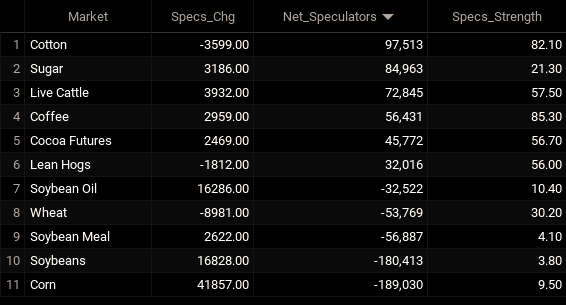
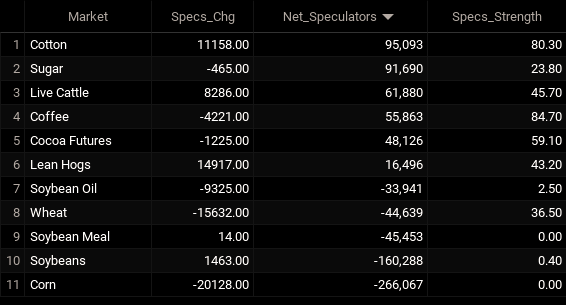
Net Speculators Leaderboard
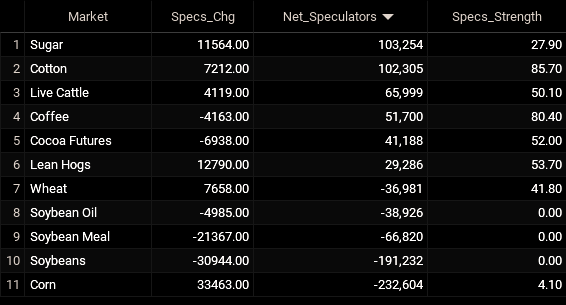
Legend: Weekly Speculators Change | Speculators Current Net Position | Speculators Strength Score compared to last 3-Years (0-100 range)
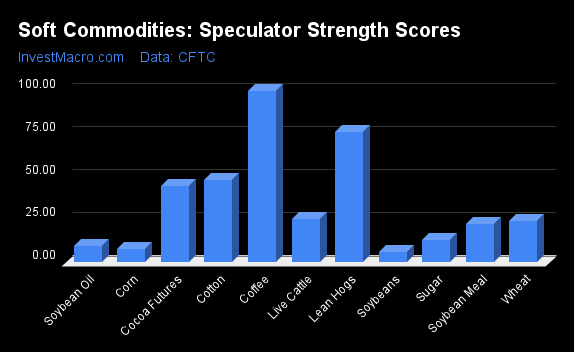
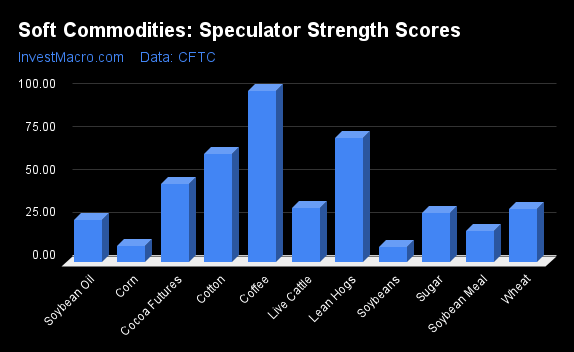
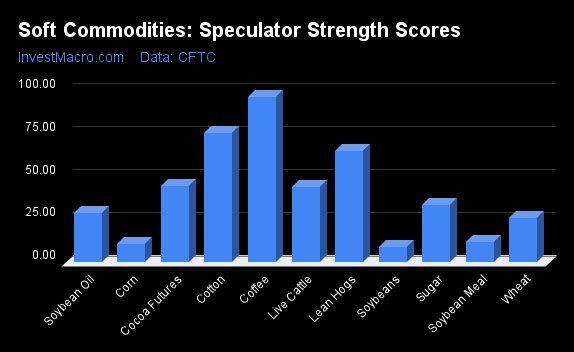
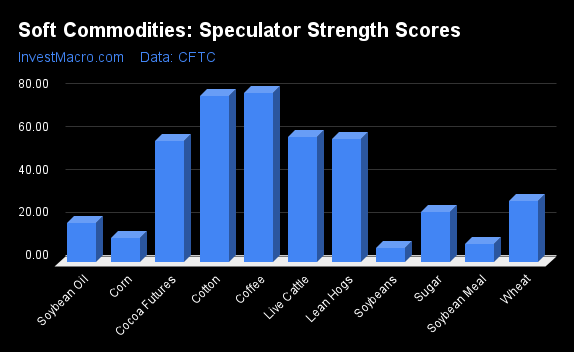
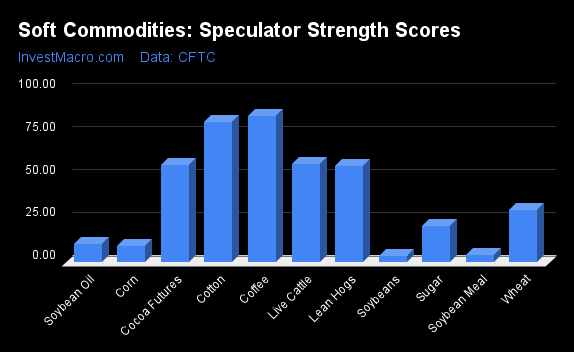
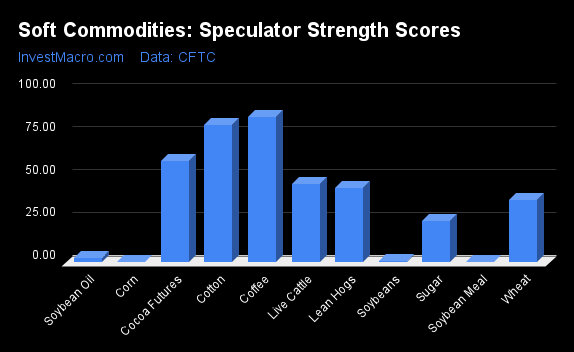
Strength Scores led by Cotton & Coffee
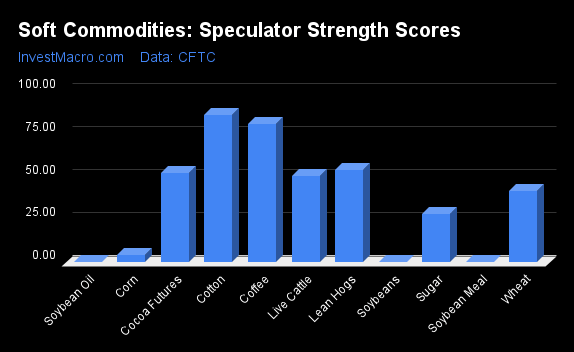
COT Strength Scores (a normalized measure of Speculator positions over a 3-Year range, from 0 to 100 where above 80 is Extreme-Bullish and below 20 is Extreme-Bearish) showed that Cotton (86 percent) and Coffee (80 percent) lead the softs markets this week. Lean Hogs (54 percent), Cocoa (52 percent) and Live Cattle (50 percent) come in as the next highest in the weekly strength scores.
On the downside, Soybean Oil (0 percent), Soybean Meal (0 percent), Soybeans (0 percent) and Corn (4 percent) come in at the lowest strength levels currently and are in Extreme-Bearish territory (below 20 percent).
Strength Statistics:
Corn (4.1 percent) vs Corn previous week (0.0 percent)
Sugar (27.9 percent) vs Sugar previous week (23.8 percent)
Coffee (80.4 percent) vs Coffee previous week (84.7 percent)
Soybeans (0.0 percent) vs Soybeans previous week (7.0 percent)
Soybean Oil (0.0 percent) vs Soybean Oil previous week (3.1 percent)
Soybean Meal (0.0 percent) vs Soybean Meal previous week (8.8 percent)
Live Cattle (50.1 percent) vs Live Cattle previous week (45.7 percent)
Lean Hogs (53.7 percent) vs Lean Hogs previous week (43.2 percent)
Cotton (85.7 percent) vs Cotton previous week (80.3 percent)
Cocoa (52.0 percent) vs Cocoa previous week (59.1 percent)
Wheat (41.8 percent) vs Wheat previous week (36.5 percent)
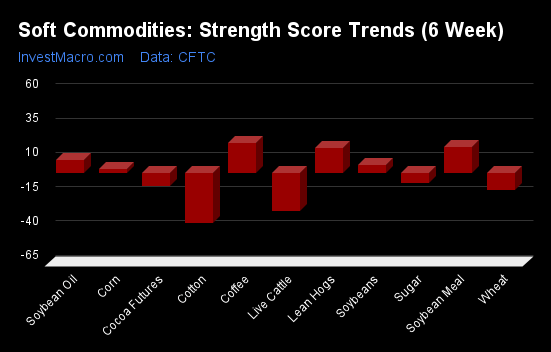
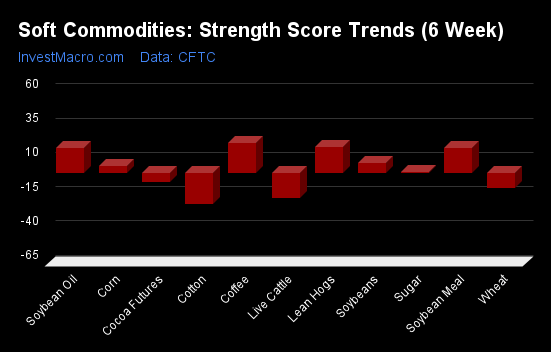
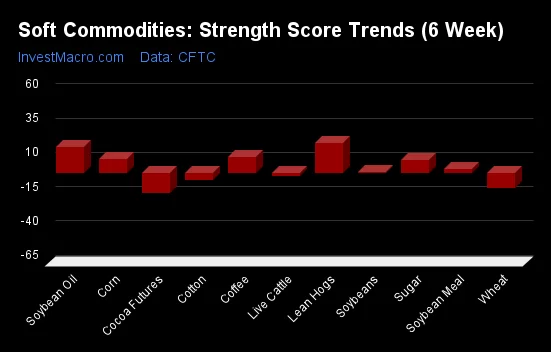
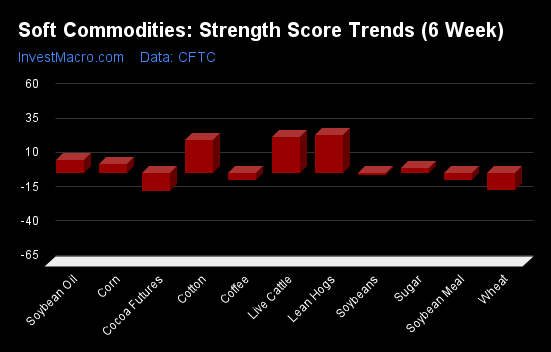
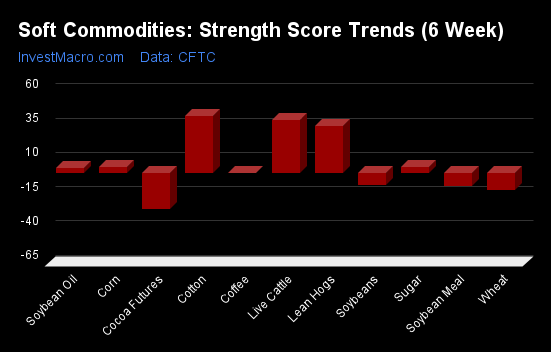
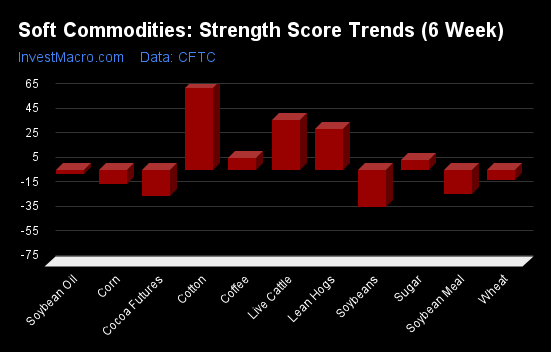
Cotton & Live Cattle top the 6-Week Strength Trends
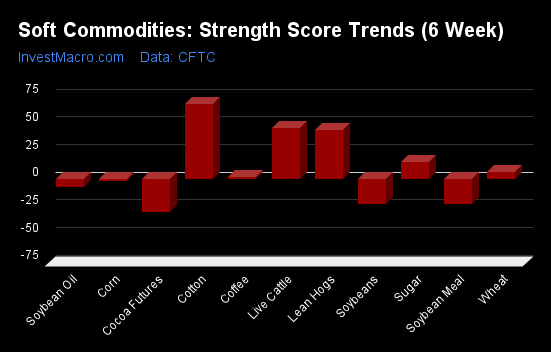
COT Strength Score Trends (or move index, calculates the 6-week changes in strength scores) showed that Cotton (68 percent) and Live Cattle (47 percent) lead the past six weeks trends for soft commodities. Lean Hogs (45 percent), Sugar (16 percent) and Wheat (7 percent) are the next highest positive movers in the latest trends data.
Cocoa (-30 percent) leads the downside trend scores currently with Soybean Meal (-23 percent), Soybeans (-22 percent) and Soybean Oil (-7 percent) following next with lower trend scores.
Strength Trend Statistics:
Corn (-1.6 percent) vs Corn previous week (-11.5 percent)
Sugar (15.6 percent) vs Sugar previous week (8.2 percent)
Coffee (2.4 percent) vs Coffee previous week (10.5 percent)
Soybeans (-22.1 percent) vs Soybeans previous week (-27.7 percent)
Soybean Oil (-7.1 percent) vs Soybean Oil previous week (-3.0 percent)
Soybean Meal (-22.8 percent) vs Soybean Meal previous week (-17.6 percent)
Live Cattle (46.6 percent) vs Live Cattle previous week (41.5 percent)
Lean Hogs (45.0 percent) vs Lean Hogs previous week (33.7 percent)
Cotton (68.4 percent) vs Cotton previous week (67.1 percent)
Cocoa (-29.6 percent) vs Cocoa previous week (-21.2 percent)
Wheat (6.7 percent) vs Wheat previous week (-7.8 percent)
Individual Soft Commodities Markets:
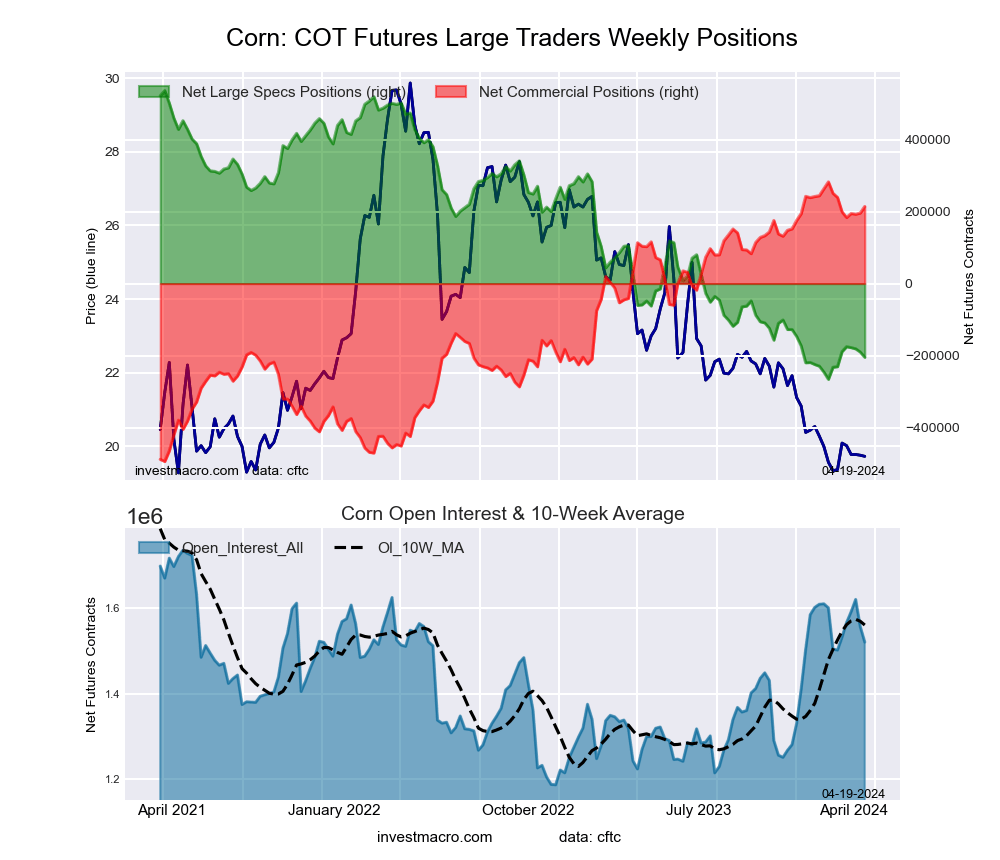
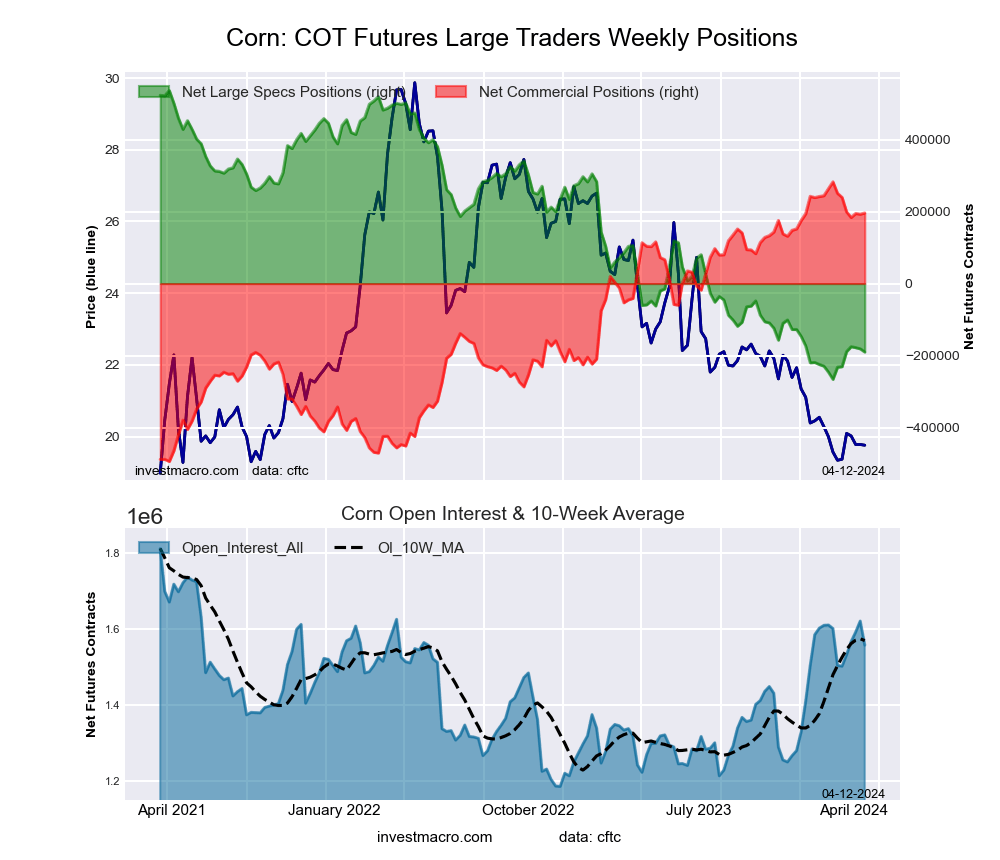
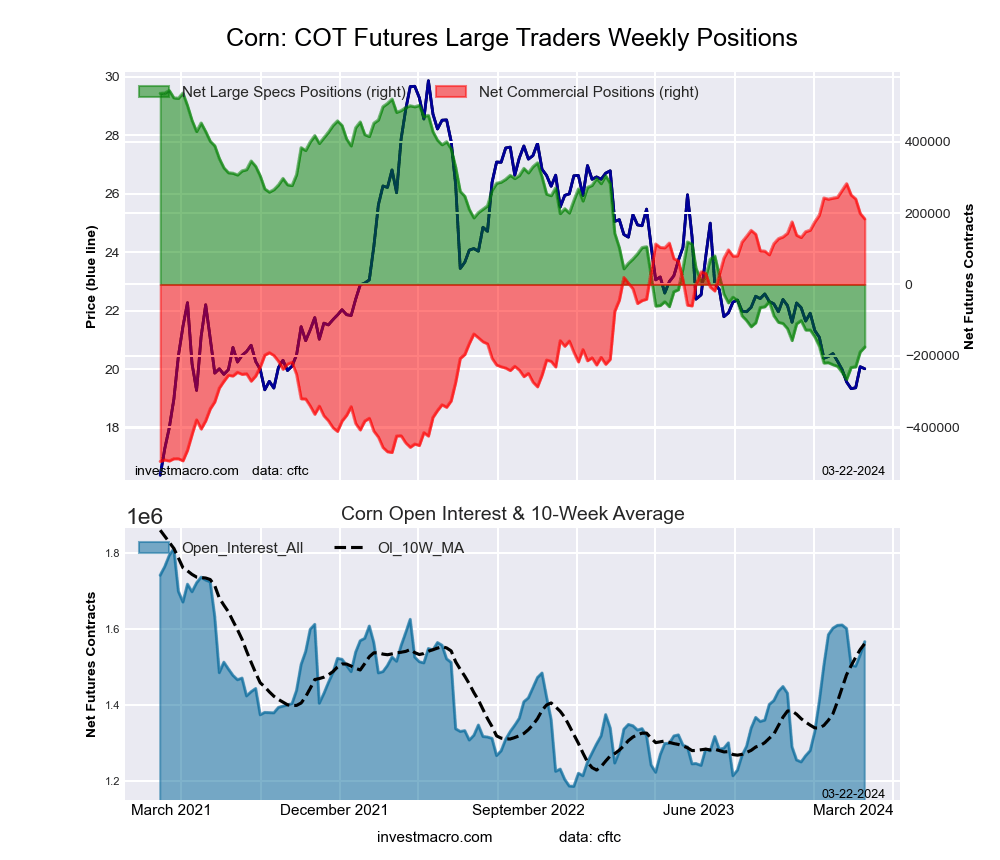
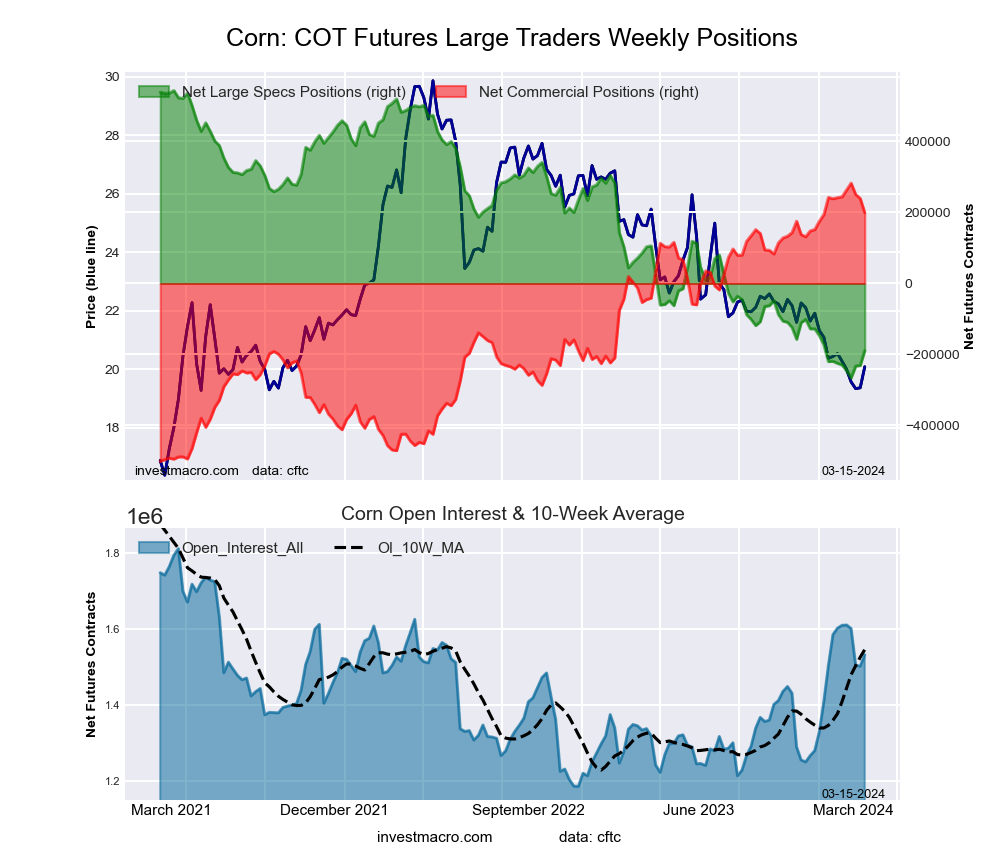
CORN Futures:
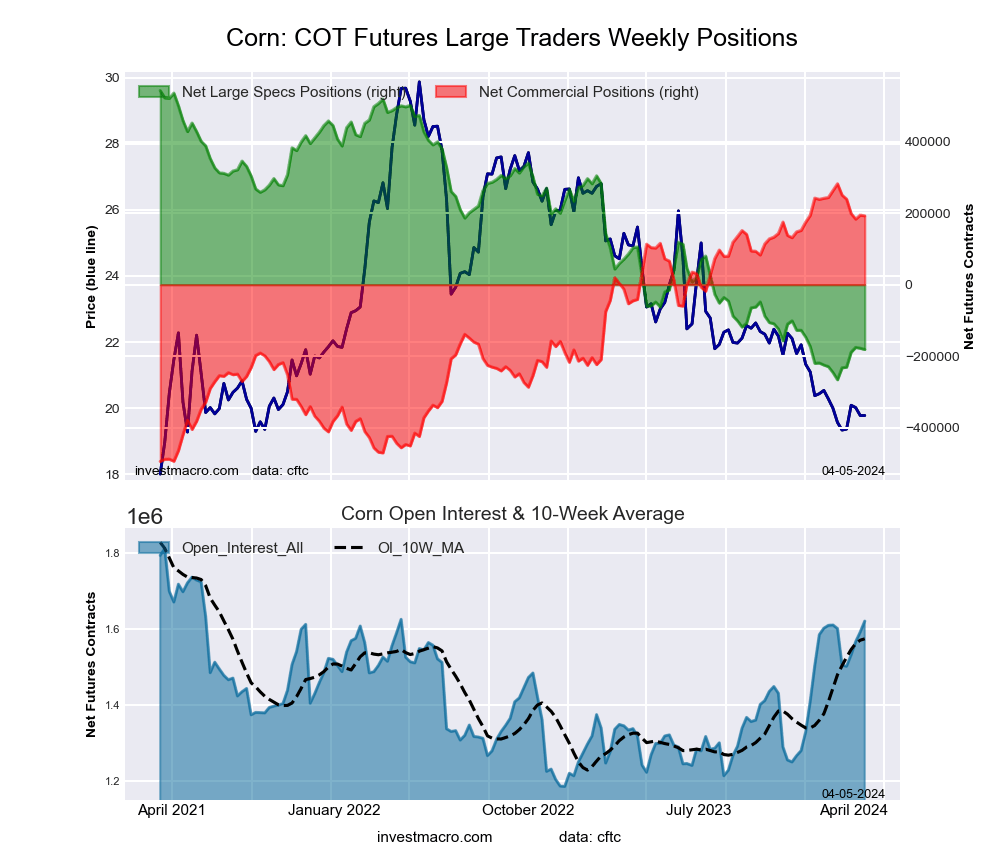
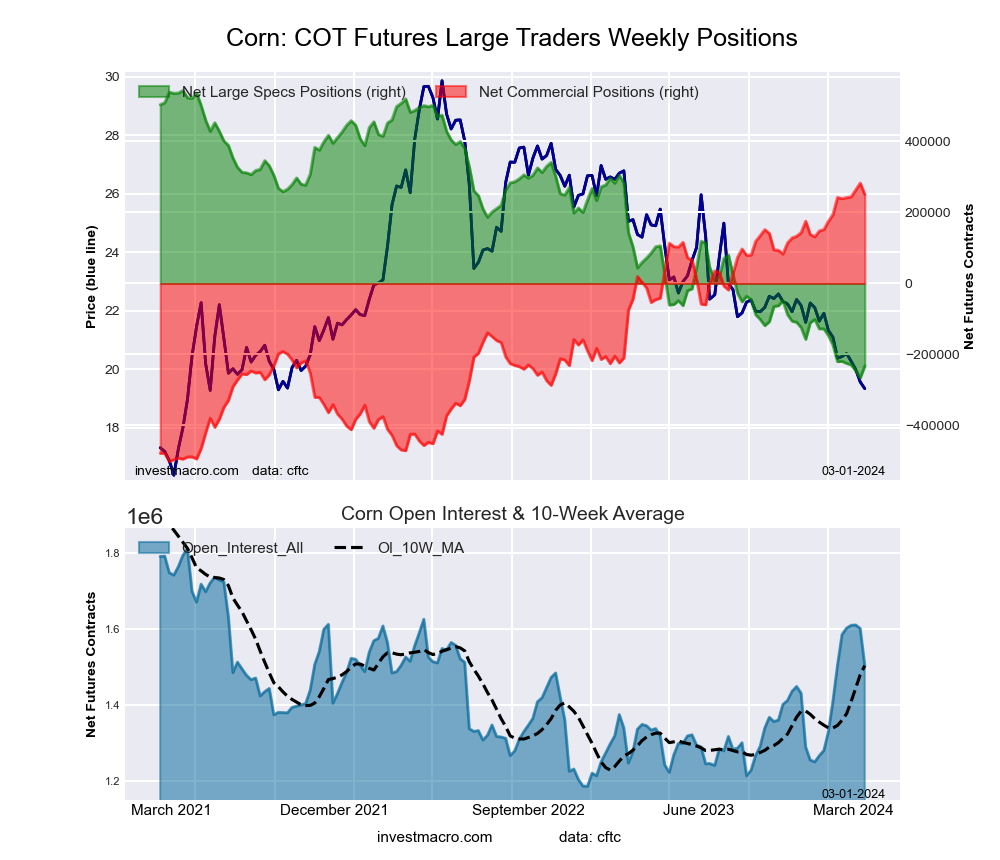 The CORN large speculator standing this week recorded a net position of -232,604 contracts in the data reported through Tuesday. This was a weekly increase of 33,463 contracts from the previous week which had a total of -266,067 net contracts.
This week’s current strength score (the trader positioning range over the past three years, measured from 0 to 100) shows the speculators are currently Bearish-Extreme with a score of 4.1 percent. The commercials are Bullish-Extreme with a score of 95.9 percent and the small traders (not shown in chart) are Bullish-Extreme with a score of 94.8 percent.
Price Trend-Following Model: Strong Downtrend
Our weekly trend-following model classifies the current market price position as: Strong Downtrend. The current action for the model is considered to be: Hold – Maintain Short Position.
| CORN Futures Statistics | SPECULATORS | COMMERCIALS | SMALL TRADERS |
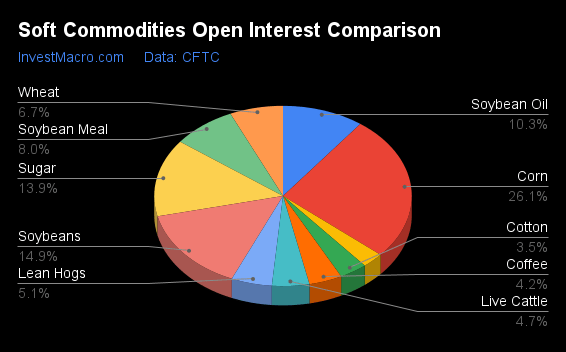
| – Percent of Open Interest Longs: | 19.7 | 44.6 | 10.0 |
| – Percent of Open Interest Shorts: | 35.1 | 27.9 | 11.2 |
| – Net Position: | -232,604 | 250,628 | -18,024 |
| – Gross Longs: | 295,676 | 670,777 | 151,100 |
| – Gross Shorts: | 528,280 | 420,149 | 169,124 |
| – Long to Short Ratio: | 0.6 to 1 | 1.6 to 1 | 0.9 to 1 |
| NET POSITION TREND: | | | |
| – Strength Index Score (3 Year Range Pct): | 4.1 | 95.9 | 94.8 |
| – Strength Index Reading (3 Year Range): | Bearish-Extreme | Bullish-Extreme | Bullish-Extreme |
| NET POSITION MOVEMENT INDEX: | | | |
| – 6-Week Change in Strength Index: | -1.6 | 1.1 | 6.3 |
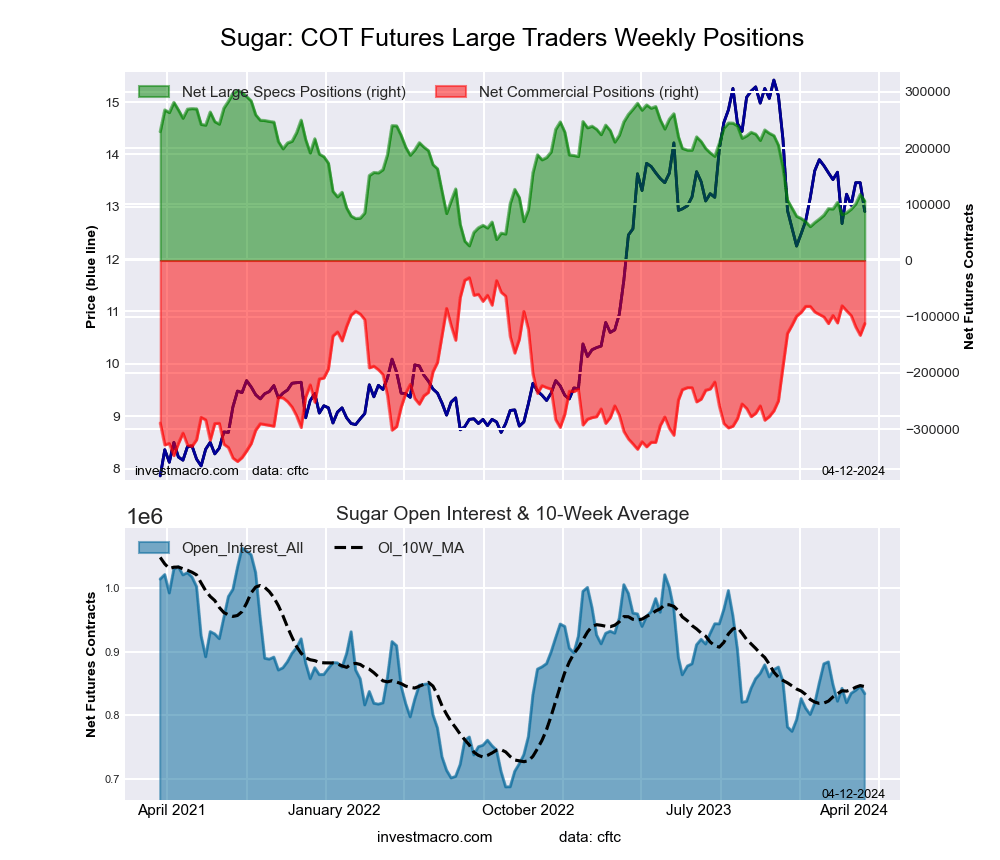
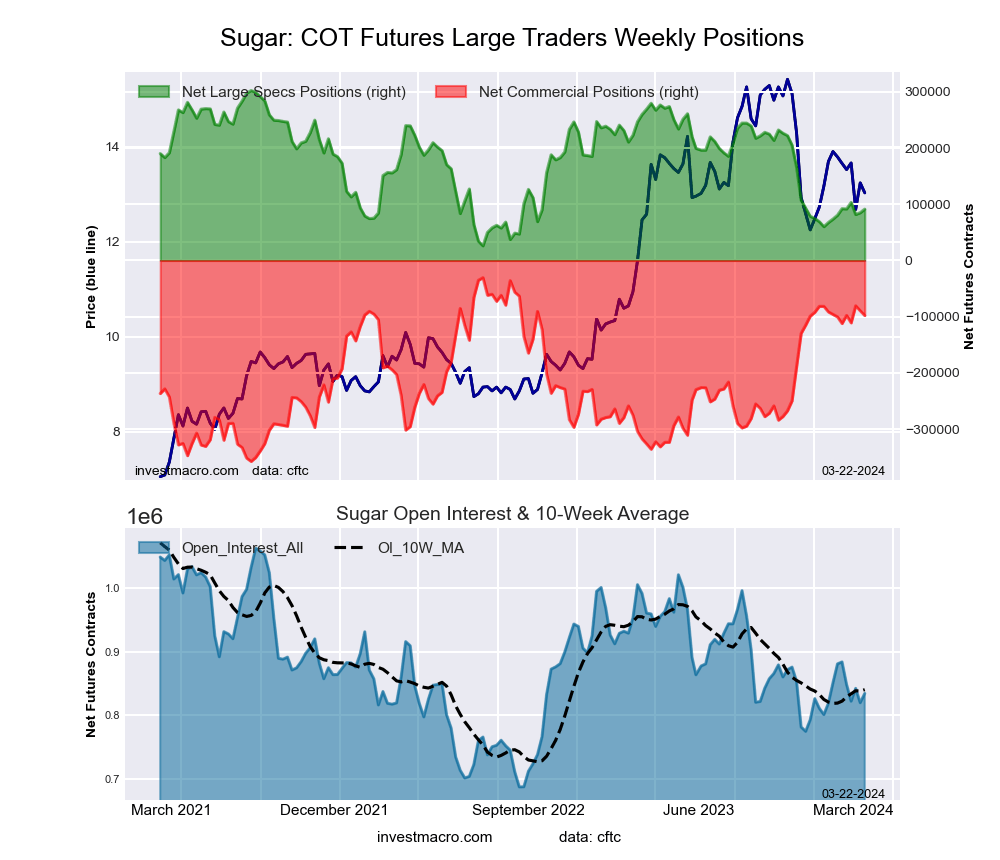
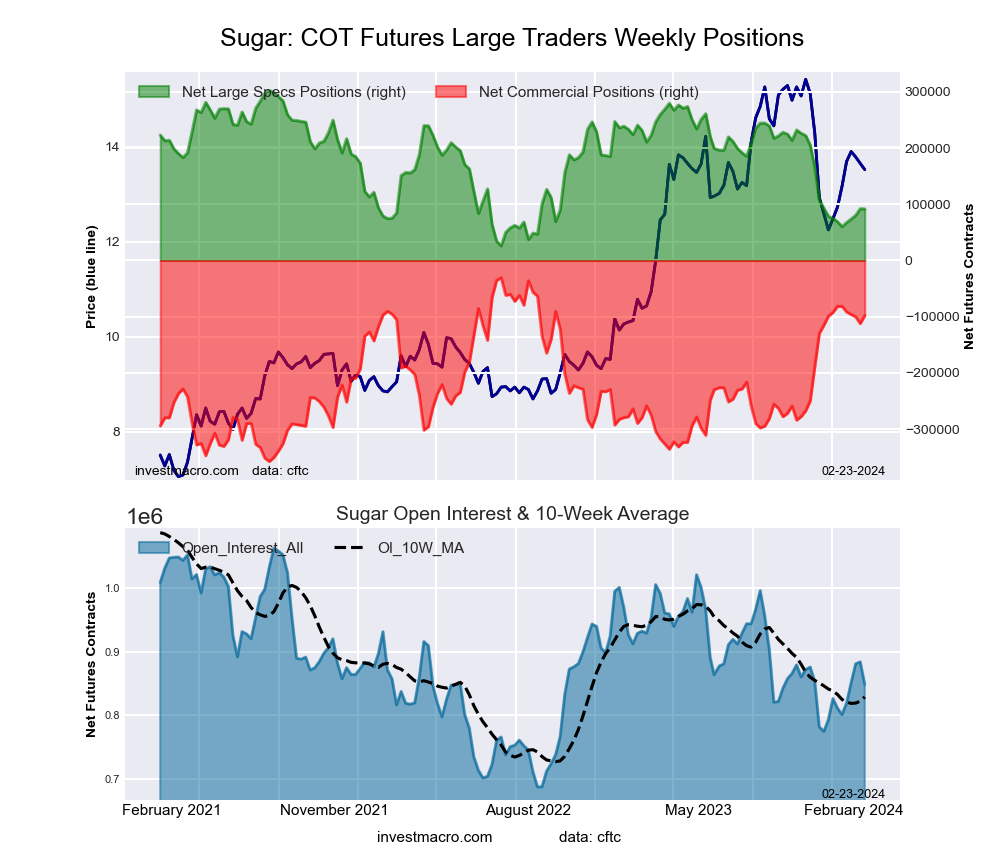
SUGAR Futures:
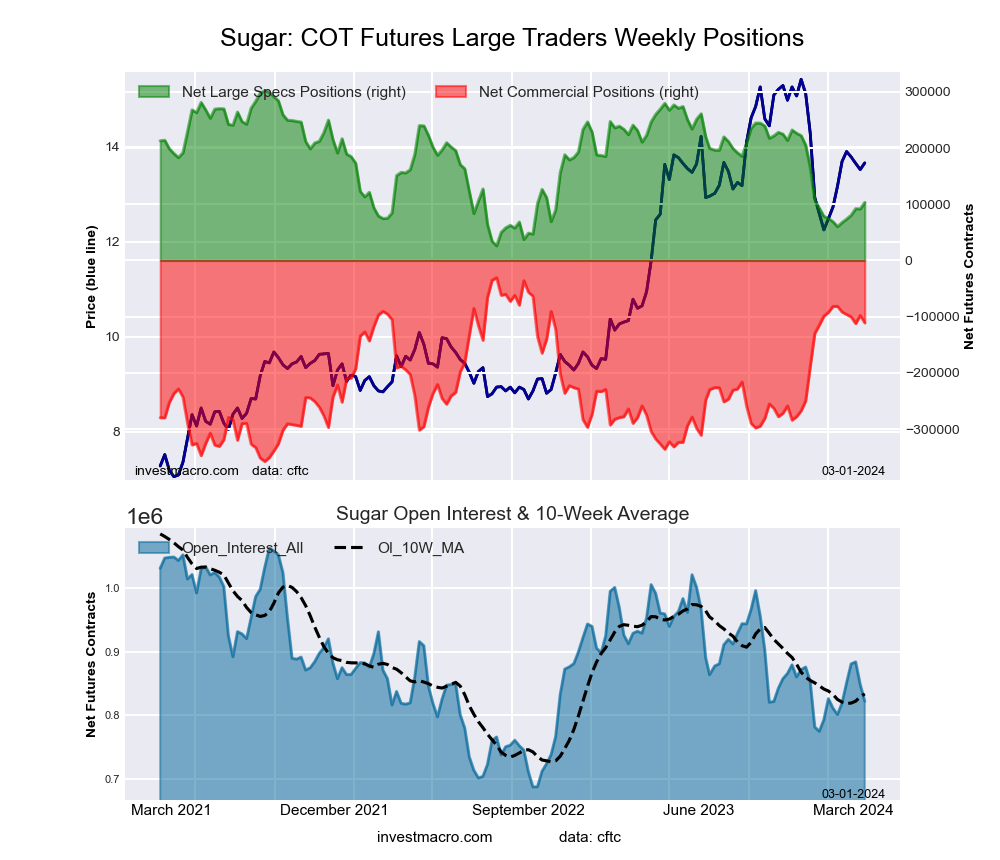 The SUGAR large speculator standing this week recorded a net position of 103,254 contracts in the data reported through Tuesday. This was a weekly boost of 11,564 contracts from the previous week which had a total of 91,690 net contracts.
This week’s current strength score (the trader positioning range over the past three years, measured from 0 to 100) shows the speculators are currently Bearish with a score of 27.9 percent. The commercials are Bullish with a score of 75.4 percent and the small traders (not shown in chart) are Bearish-Extreme with a score of 13.5 percent.
Price Trend-Following Model: Downtrend
Our weekly trend-following model classifies the current market price position as: Downtrend. The current action for the model is considered to be: Hold – Maintain Short Position.
| SUGAR Futures Statistics | SPECULATORS | COMMERCIALS | SMALL TRADERS |
| – Percent of Open Interest Longs: | 22.9 | 52.5 | 8.0 |
| – Percent of Open Interest Shorts: | 10.3 | 65.9 | 7.1 |
| – Net Position: | 103,254 | -110,952 | 7,698 |
| – Gross Longs: | 187,869 | 431,227 | 66,010 |
| – Gross Shorts: | 84,615 | 542,179 | 58,312 |
| – Long to Short Ratio: | 2.2 to 1 | 0.8 to 1 | 1.1 to 1 |
| NET POSITION TREND: | | | |
| – Strength Index Score (3 Year Range Pct): | 27.9 | 75.4 | 13.5 |
| – Strength Index Reading (3 Year Range): | Bearish | Bullish | Bearish-Extreme |
| NET POSITION MOVEMENT INDEX: | | | |
| – 6-Week Change in Strength Index: | 15.6 | -9.0 | -20.0 |
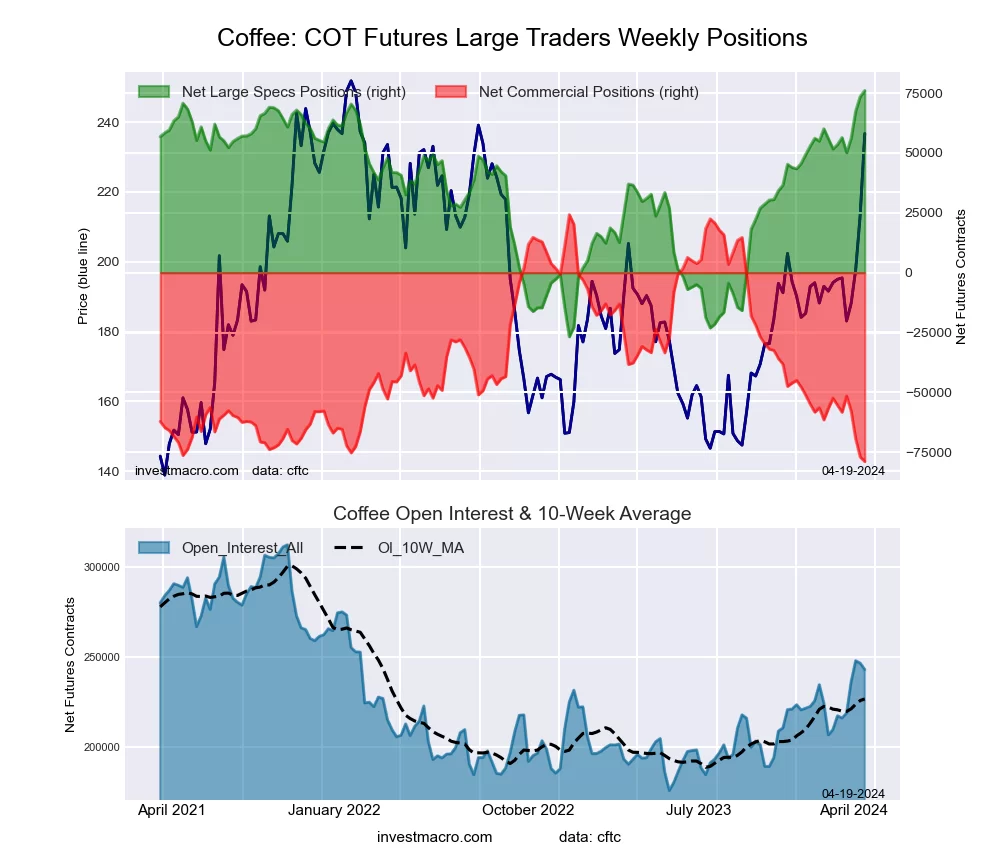
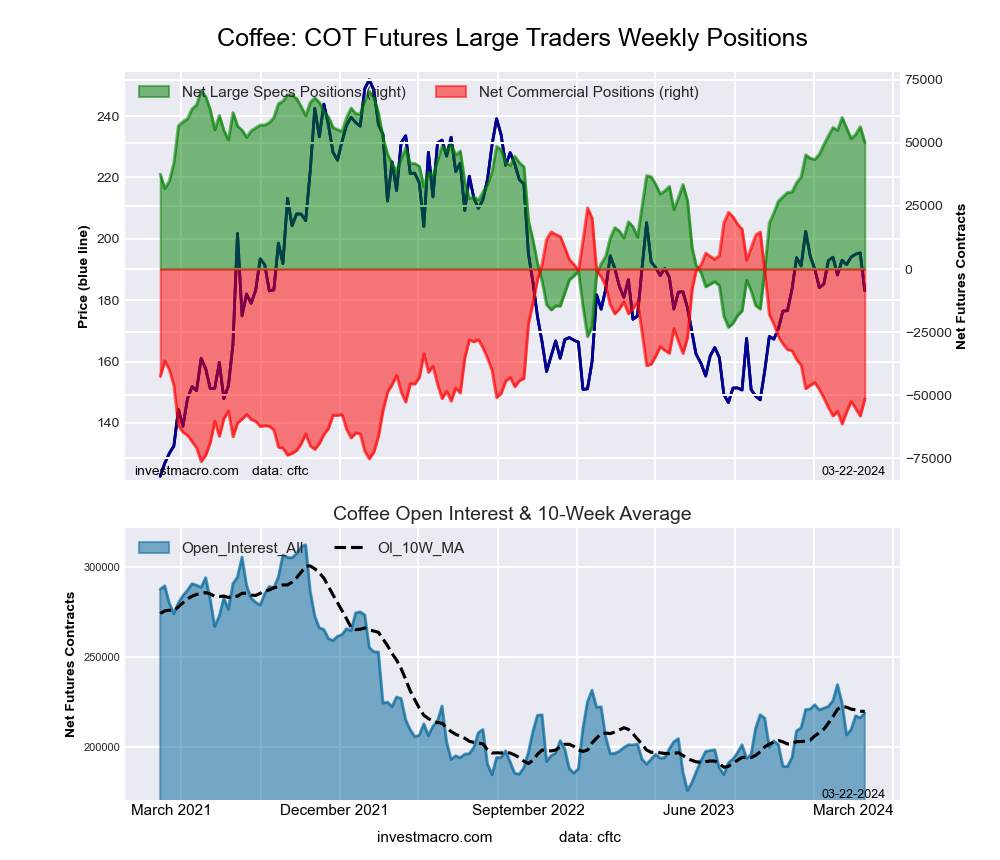
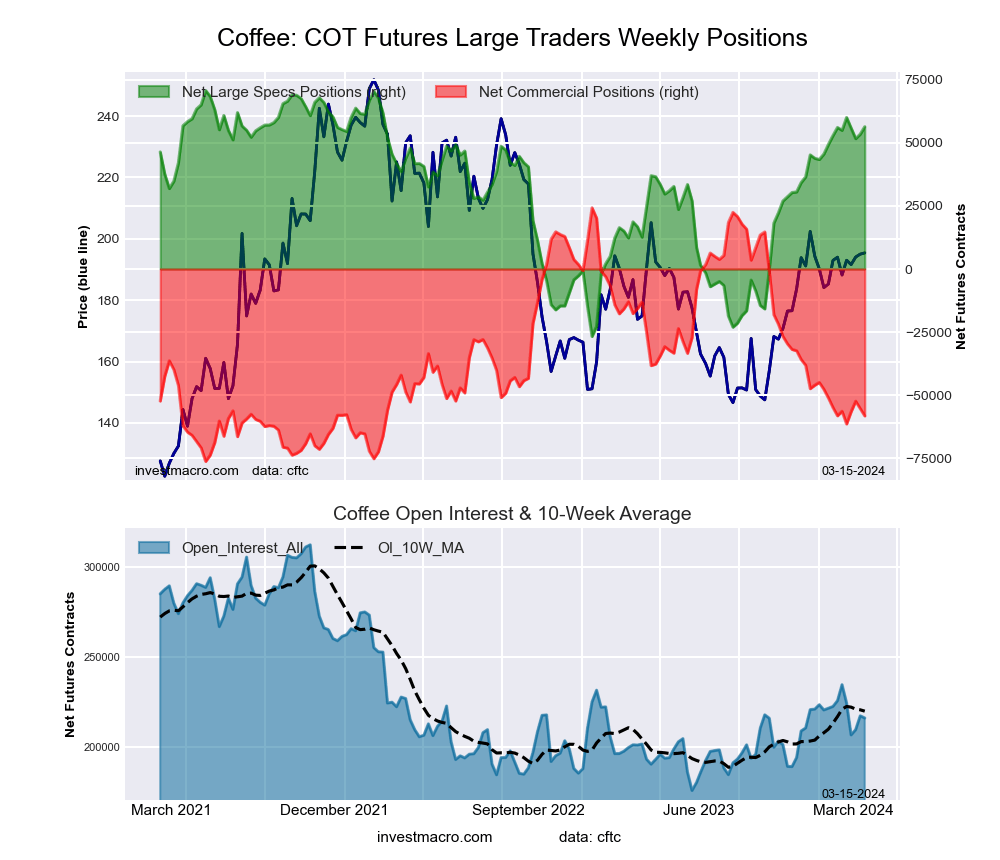
COFFEE Futures:
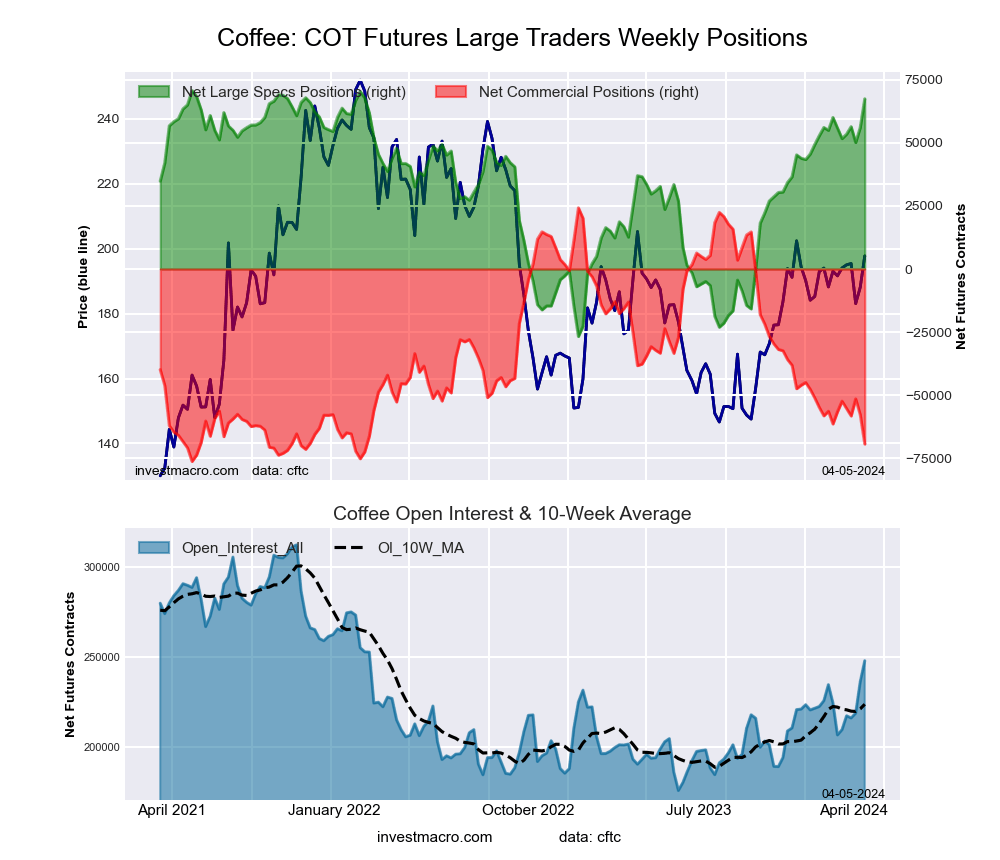
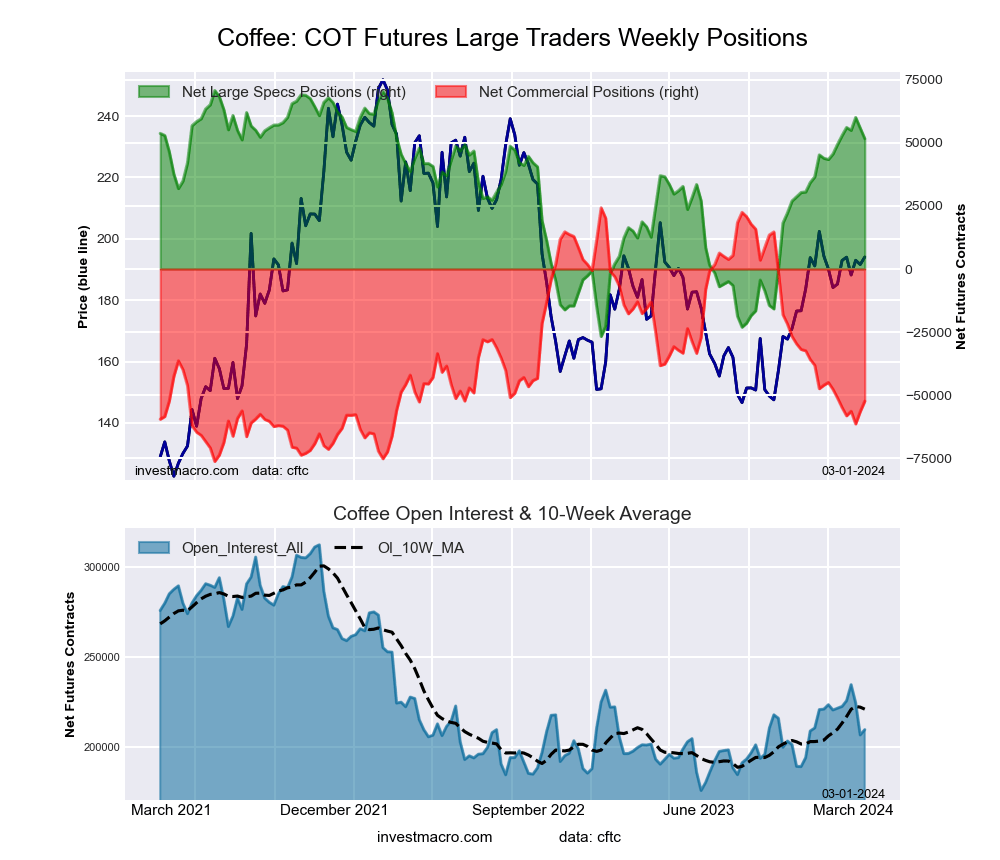 The COFFEE large speculator standing this week recorded a net position of 51,700 contracts in the data reported through Tuesday. This was a weekly lowering of -4,163 contracts from the previous week which had a total of 55,863 net contracts.
This week’s current strength score (the trader positioning range over the past three years, measured from 0 to 100) shows the speculators are currently Bullish-Extreme with a score of 80.4 percent. The commercials are Bearish with a score of 23.8 percent and the small traders (not shown in chart) are Bearish with a score of 23.9 percent.
Price Trend-Following Model: Uptrend
Our weekly trend-following model classifies the current market price position as: Uptrend. The current action for the model is considered to be: Hold – Maintain Long Position.
| COFFEE Futures Statistics | SPECULATORS | COMMERCIALS | SMALL TRADERS |
| – Percent of Open Interest Longs: | 36.0 | 38.0 | 3.5 |
| – Percent of Open Interest Shorts: | 11.3 | 63.1 | 3.2 |
| – Net Position: | 51,700 | -52,424 | 724 |
| – Gross Longs: | 75,330 | 79,690 | 7,361 |
| – Gross Shorts: | 23,630 | 132,114 | 6,637 |
| – Long to Short Ratio: | 3.2 to 1 | 0.6 to 1 | 1.1 to 1 |
| NET POSITION TREND: | | | |
| – Strength Index Score (3 Year Range Pct): | 80.4 | 23.8 | 23.9 |
| – Strength Index Reading (3 Year Range): | Bullish-Extreme | Bearish | Bearish |
| NET POSITION MOVEMENT INDEX: | | | |
| – 6-Week Change in Strength Index: | 2.4 | -1.3 | -14.1 |
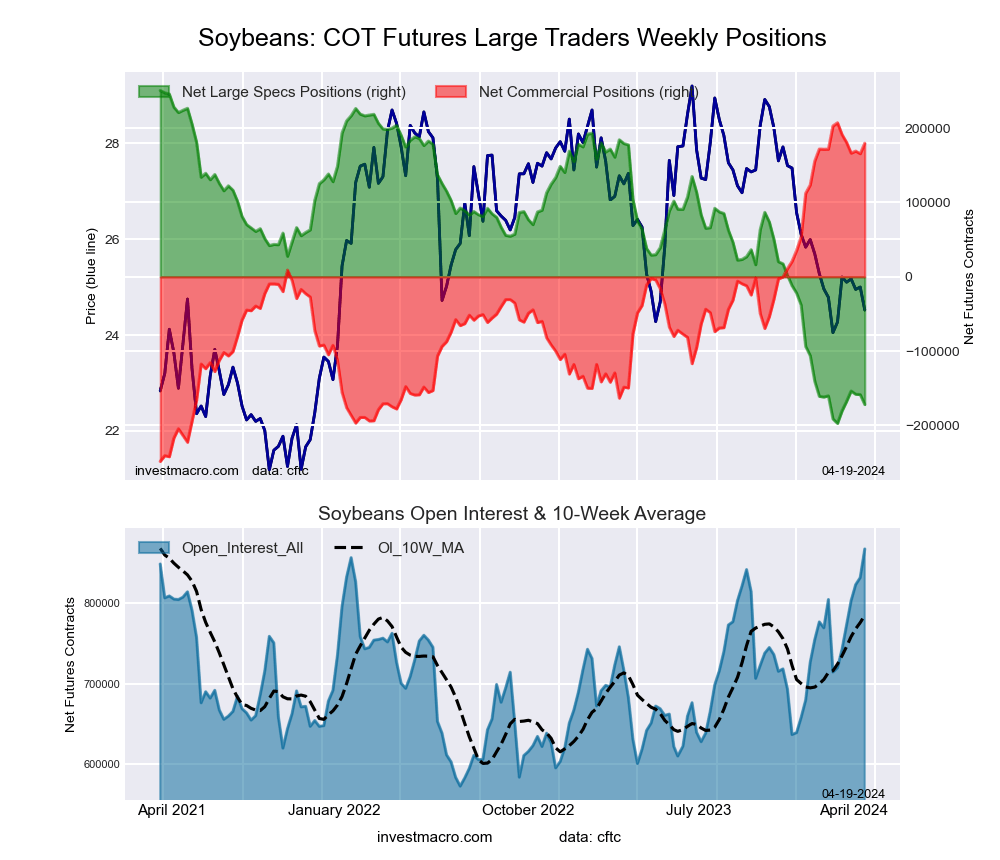
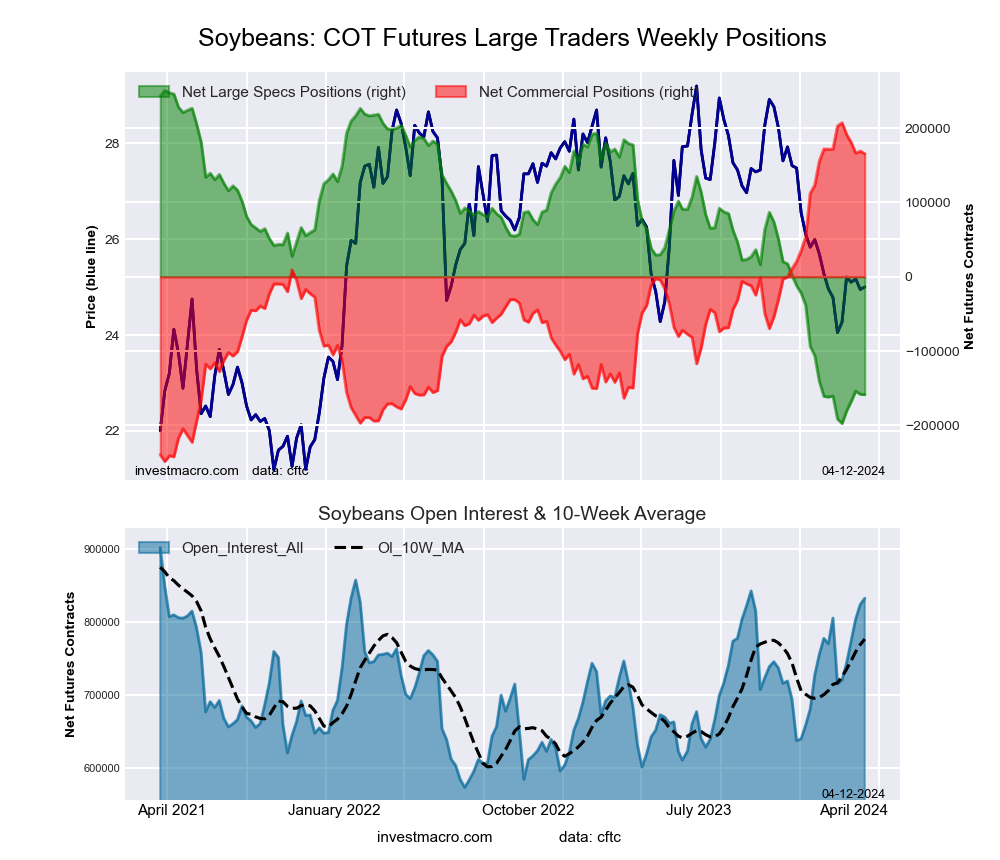
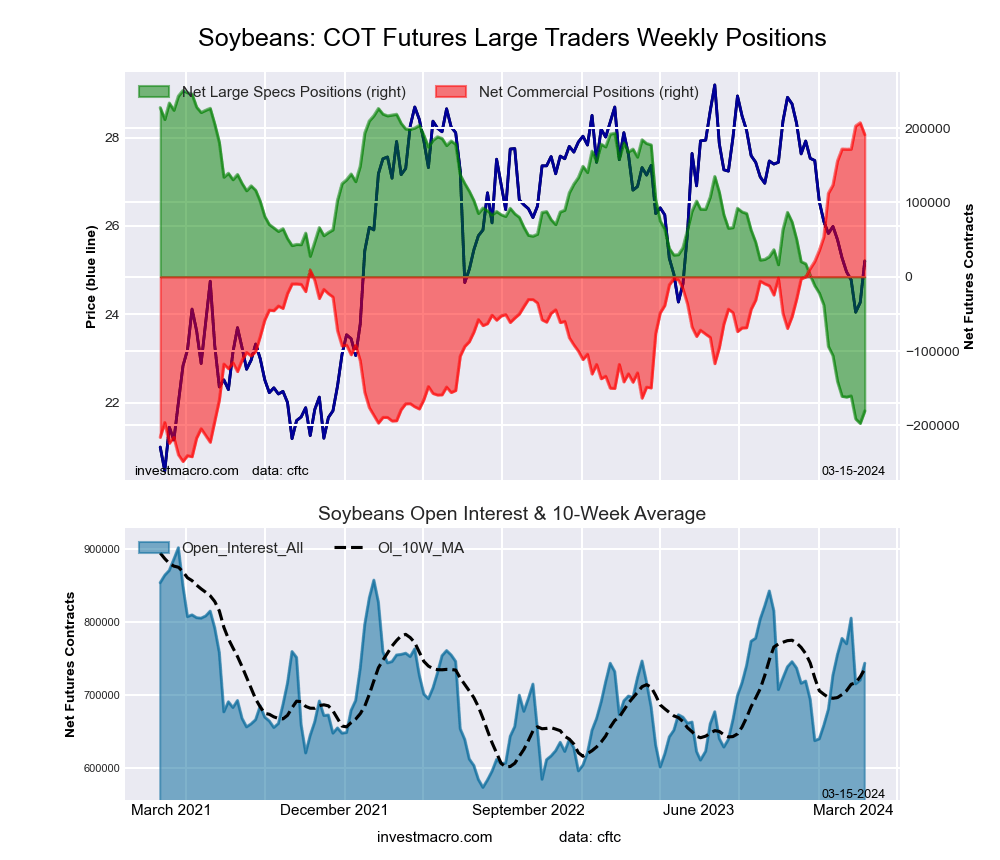
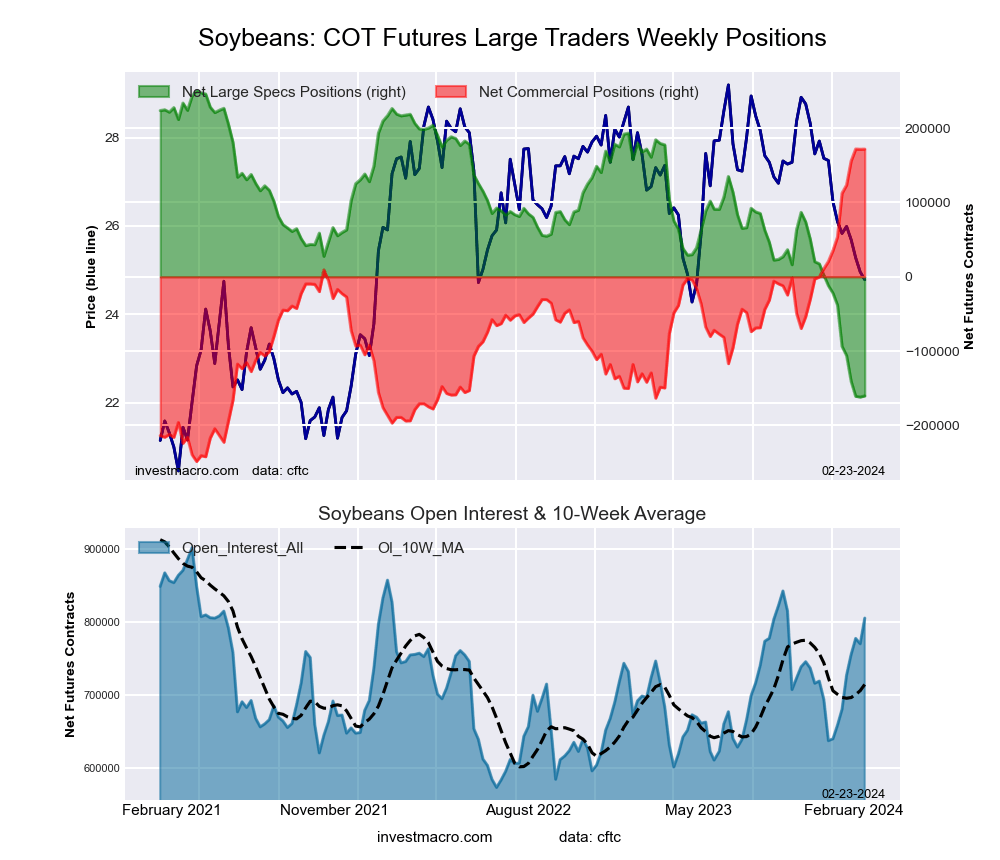
SOYBEANS Futures:
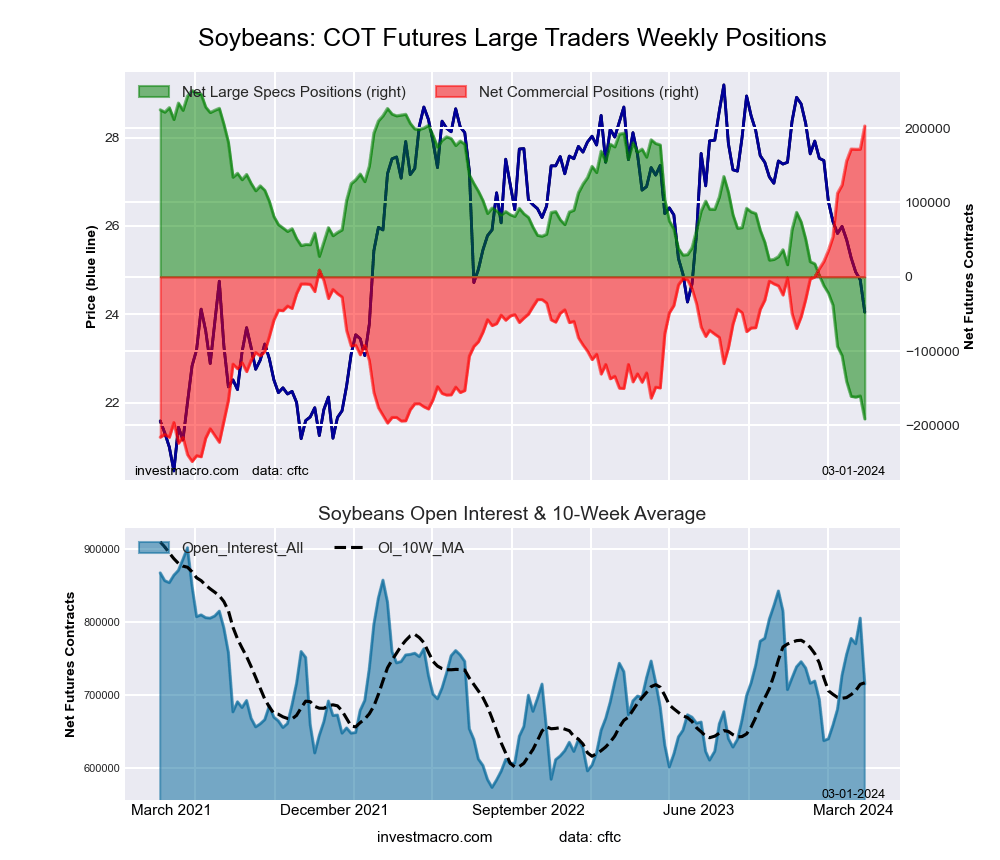 The SOYBEANS large speculator standing this week recorded a net position of -191,232 contracts in the data reported through Tuesday. This was a weekly reduction of -30,944 contracts from the previous week which had a total of -160,288 net contracts.
This week’s current strength score (the trader positioning range over the past three years, measured from 0 to 100) shows the speculators are currently Bearish-Extreme with a score of 0.0 percent. The commercials are Bullish-Extreme with a score of 100.0 percent and the small traders (not shown in chart) are Bullish with a score of 76.7 percent.
Price Trend-Following Model: Strong Downtrend
Our weekly trend-following model classifies the current market price position as: Strong Downtrend. The current action for the model is considered to be: Hold – Maintain Short Position.
| SOYBEANS Futures Statistics | SPECULATORS | COMMERCIALS | SMALL TRADERS |
| – Percent of Open Interest Longs: | 12.9 | 60.5 | 7.3 |
| – Percent of Open Interest Shorts: | 39.7 | 32.1 | 8.9 |
| – Net Position: | -191,232 | 202,950 | -11,718 |
| – Gross Longs: | 92,361 | 432,418 | 51,829 |
| – Gross Shorts: | 283,593 | 229,468 | 63,547 |
| – Long to Short Ratio: | 0.3 to 1 | 1.9 to 1 | 0.8 to 1 |
| NET POSITION TREND: | | | |
| – Strength Index Score (3 Year Range Pct): | 0.0 | 100.0 | 76.7 |
| – Strength Index Reading (3 Year Range): | Bearish-Extreme | Bullish-Extreme | Bullish |
| NET POSITION MOVEMENT INDEX: | | | |
| – 6-Week Change in Strength Index: | -22.1 | 20.1 | 17.2 |
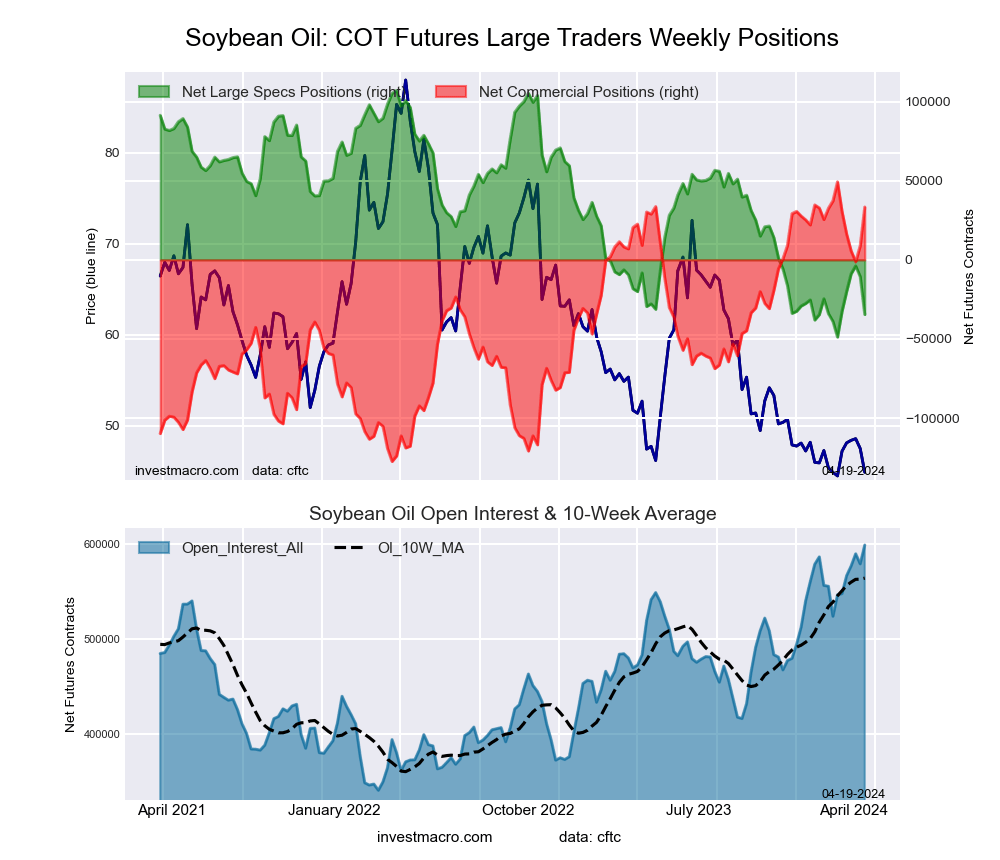
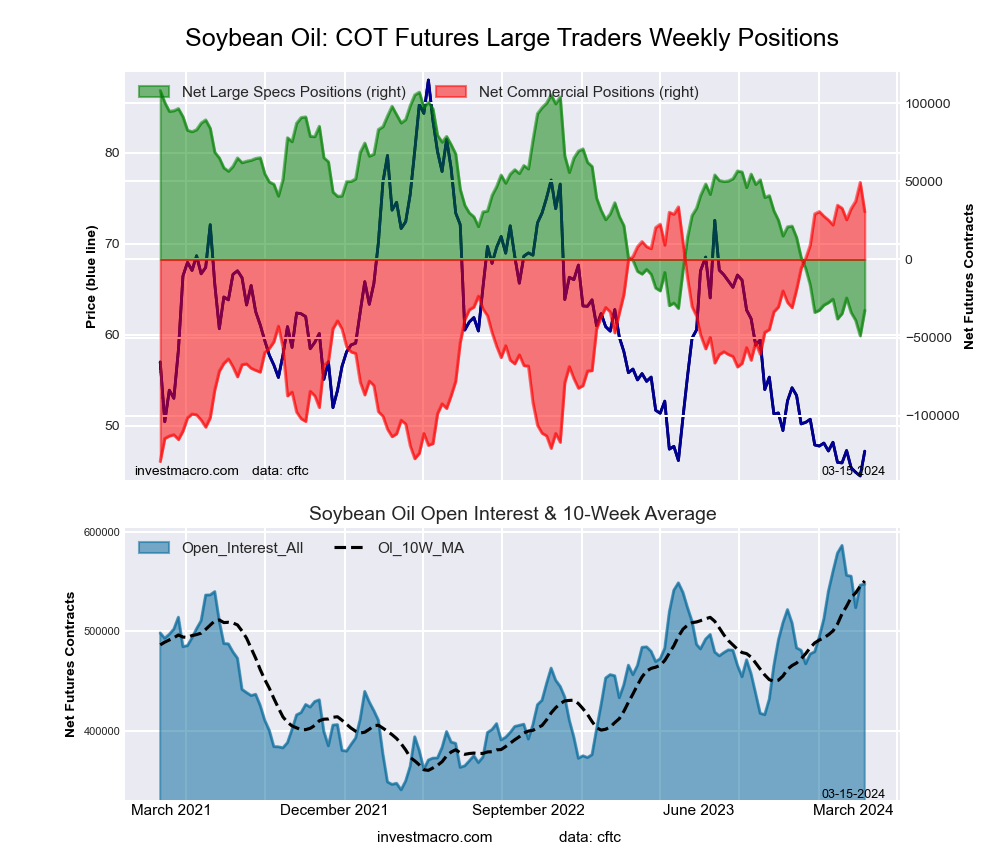
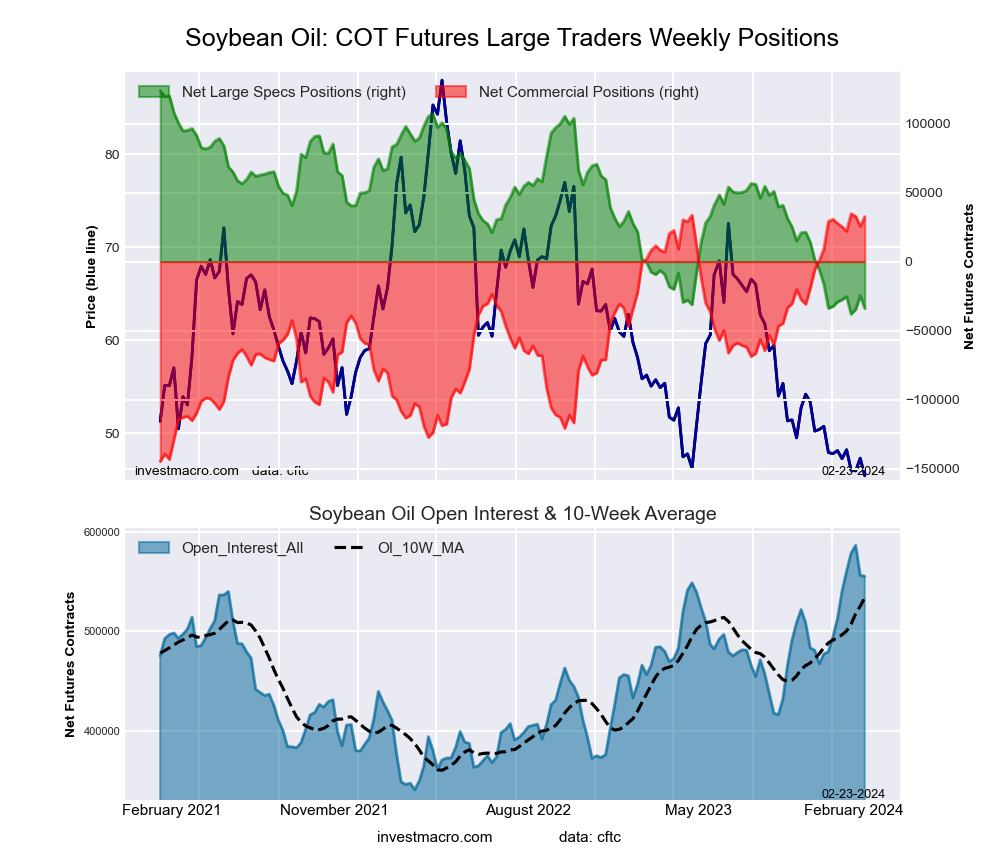
SOYBEAN OIL Futures:
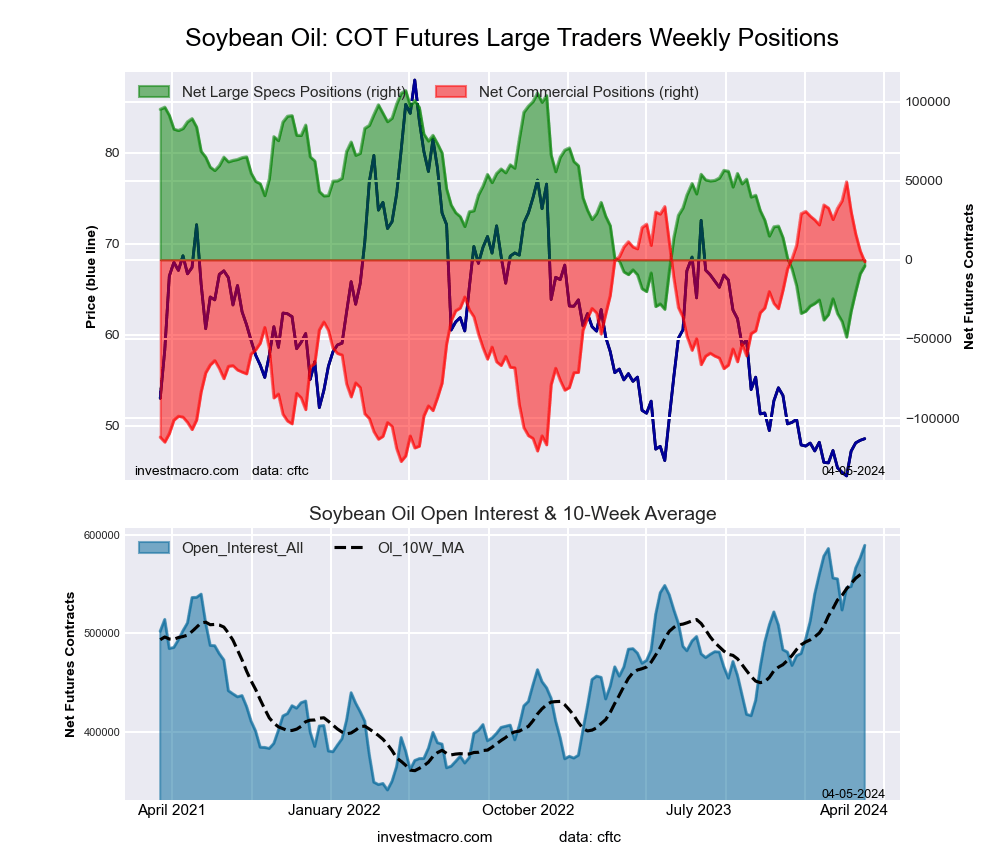
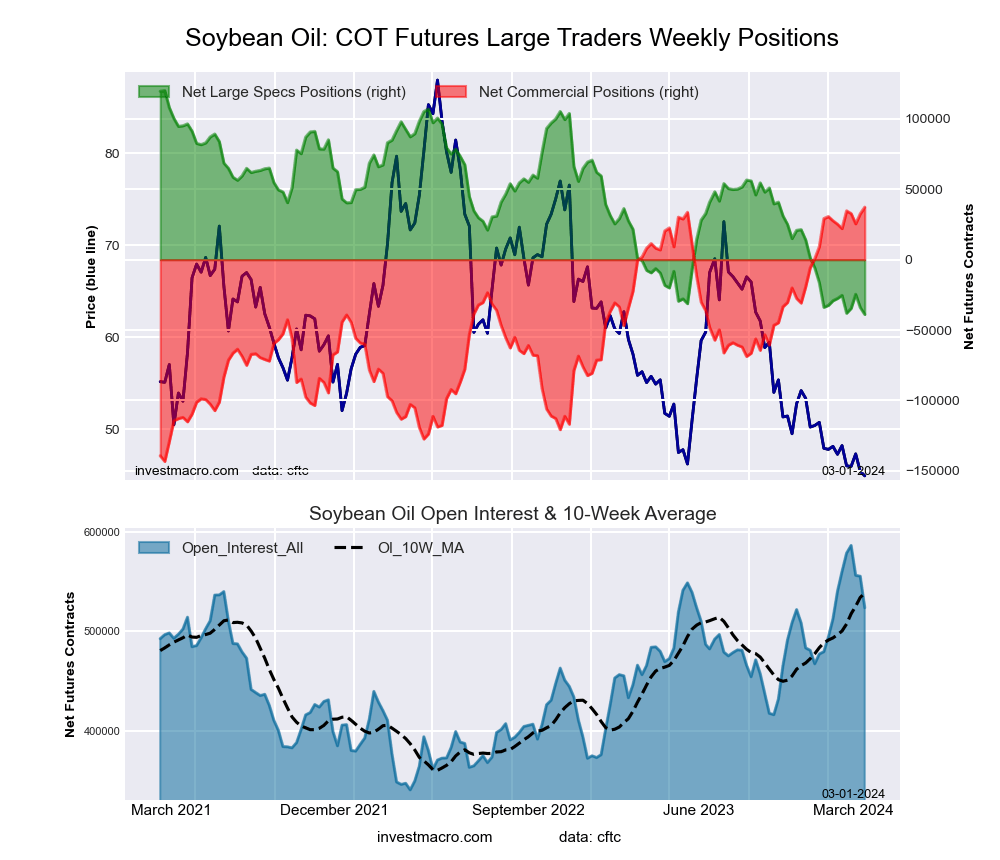 The SOYBEAN OIL large speculator standing this week recorded a net position of -38,926 contracts in the data reported through Tuesday. This was a weekly decrease of -4,985 contracts from the previous week which had a total of -33,941 net contracts.
This week’s current strength score (the trader positioning range over the past three years, measured from 0 to 100) shows the speculators are currently Bearish-Extreme with a score of 0.0 percent. The commercials are Bullish-Extreme with a score of 100.0 percent and the small traders (not shown in chart) are Bearish-Extreme with a score of 19.7 percent.
Price Trend-Following Model: Downtrend
Our weekly trend-following model classifies the current market price position as: Downtrend. The current action for the model is considered to be: Hold – Maintain Short Position.
| SOYBEAN OIL Futures Statistics | SPECULATORS | COMMERCIALS | SMALL TRADERS |
| – Percent of Open Interest Longs: | 20.6 | 48.2 | 5.4 |
| – Percent of Open Interest Shorts: | 28.0 | 41.1 | 5.1 |
| – Net Position: | -38,926 | 37,289 | 1,637 |
| – Gross Longs: | 107,981 | 252,660 | 28,265 |
| – Gross Shorts: | 146,907 | 215,371 | 26,628 |
| – Long to Short Ratio: | 0.7 to 1 | 1.2 to 1 | 1.1 to 1 |
| NET POSITION TREND: | | | |
| – Strength Index Score (3 Year Range Pct): | 0.0 | 100.0 | 19.7 |
| – Strength Index Reading (3 Year Range): | Bearish-Extreme | Bullish-Extreme | Bearish-Extreme |
| NET POSITION MOVEMENT INDEX: | | | |
| – 6-Week Change in Strength Index: | -7.1 | 6.7 | -2.7 |
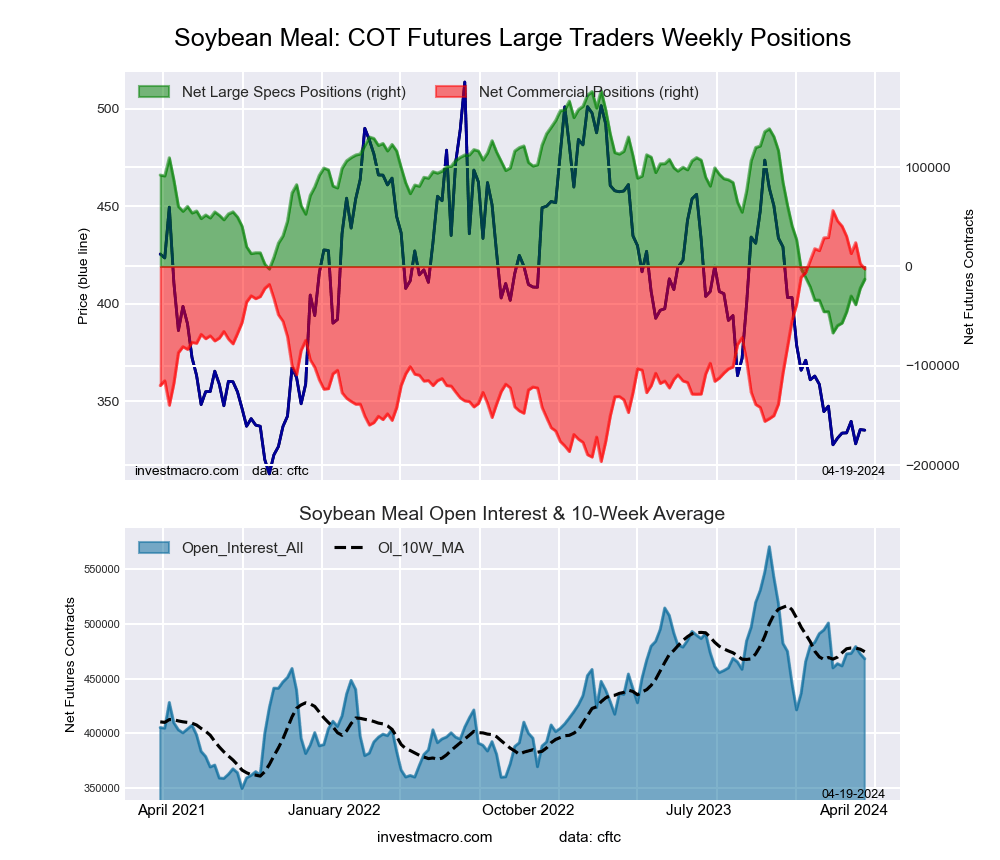
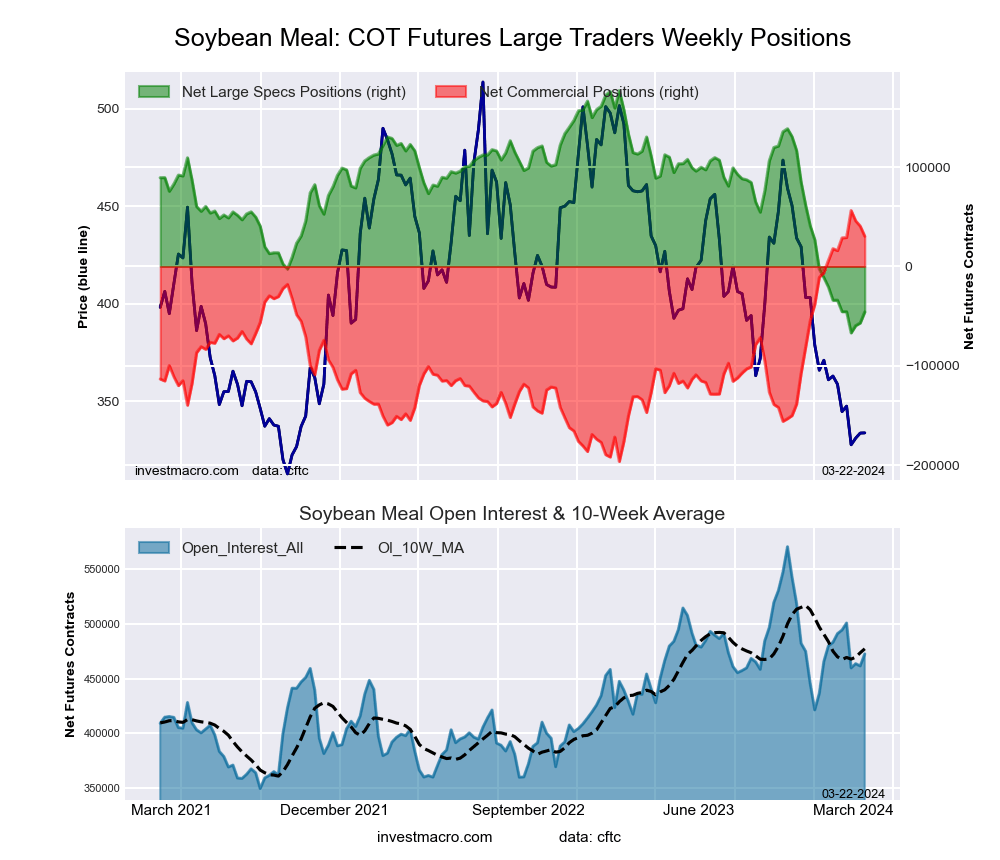
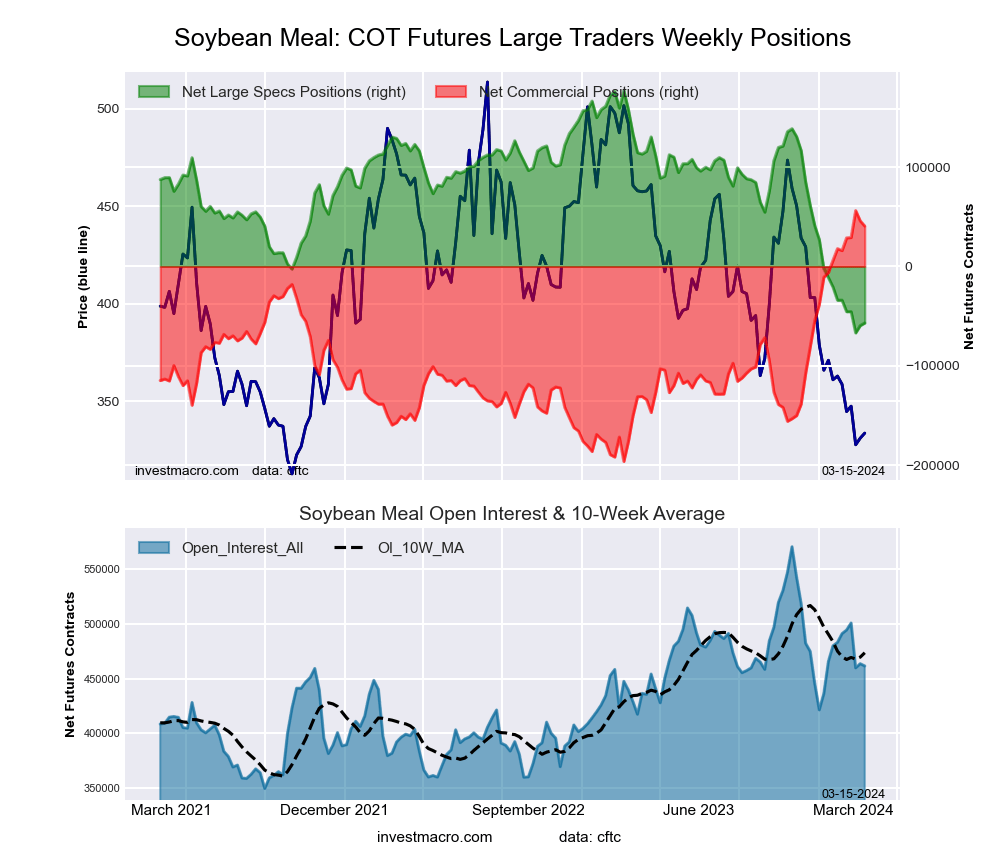
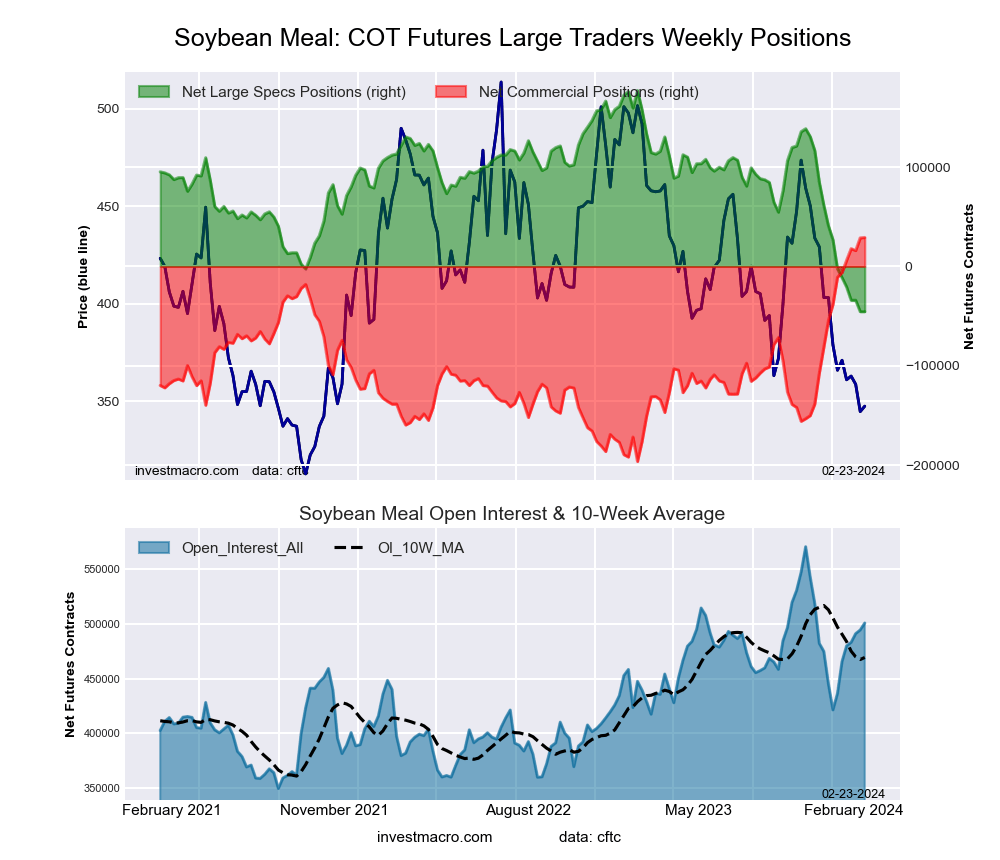
SOYBEAN MEAL Futures:
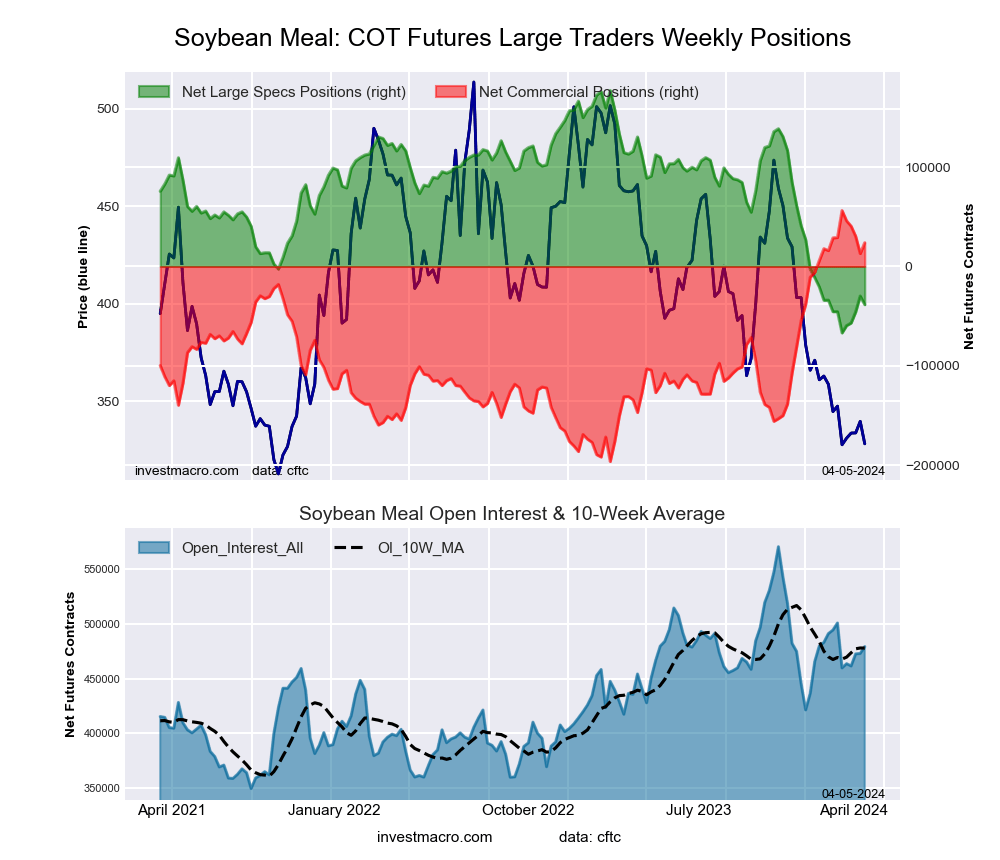
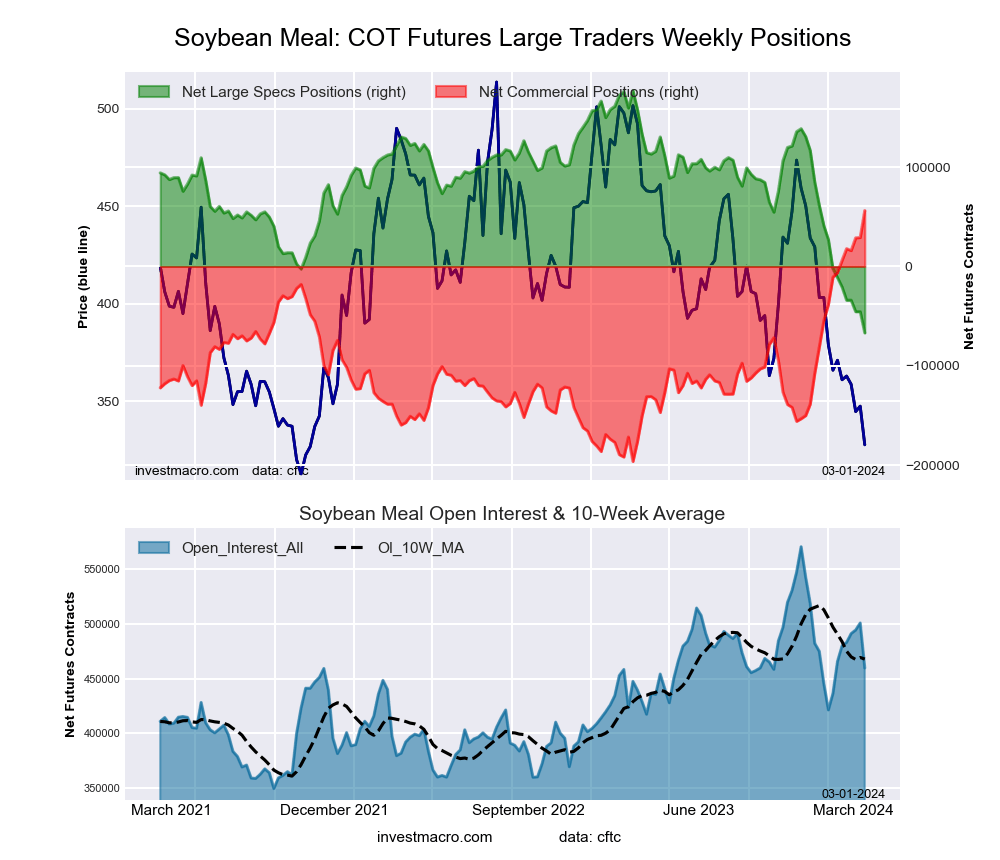 The SOYBEAN MEAL large speculator standing this week recorded a net position of -66,820 contracts in the data reported through Tuesday. This was a weekly fall of -21,367 contracts from the previous week which had a total of -45,453 net contracts.
This week’s current strength score (the trader positioning range over the past three years, measured from 0 to 100) shows the speculators are currently Bearish-Extreme with a score of 0.0 percent. The commercials are Bullish-Extreme with a score of 100.0 percent and the small traders (not shown in chart) are Bearish-Extreme with a score of 3.2 percent.
Price Trend-Following Model: Downtrend
Our weekly trend-following model classifies the current market price position as: Downtrend. The current action for the model is considered to be: Hold – Maintain Short Position.
| SOYBEAN MEAL Futures Statistics | SPECULATORS | COMMERCIALS | SMALL TRADERS |
| – Percent of Open Interest Longs: | 17.6 | 52.8 | 9.8 |
| – Percent of Open Interest Shorts: | 32.1 | 40.5 | 7.5 |
| – Net Position: | -66,820 | 56,238 | 10,582 |
| – Gross Longs: | 80,930 | 242,674 | 44,952 |
| – Gross Shorts: | 147,750 | 186,436 | 34,370 |
| – Long to Short Ratio: | 0.5 to 1 | 1.3 to 1 | 1.3 to 1 |
| NET POSITION TREND: | | | |
| – Strength Index Score (3 Year Range Pct): | 0.0 | 100.0 | 3.2 |
| – Strength Index Reading (3 Year Range): | Bearish-Extreme | Bullish-Extreme | Bearish-Extreme |
| NET POSITION MOVEMENT INDEX: | | | |
| – 6-Week Change in Strength Index: | -22.8 | 24.7 | -30.8 |
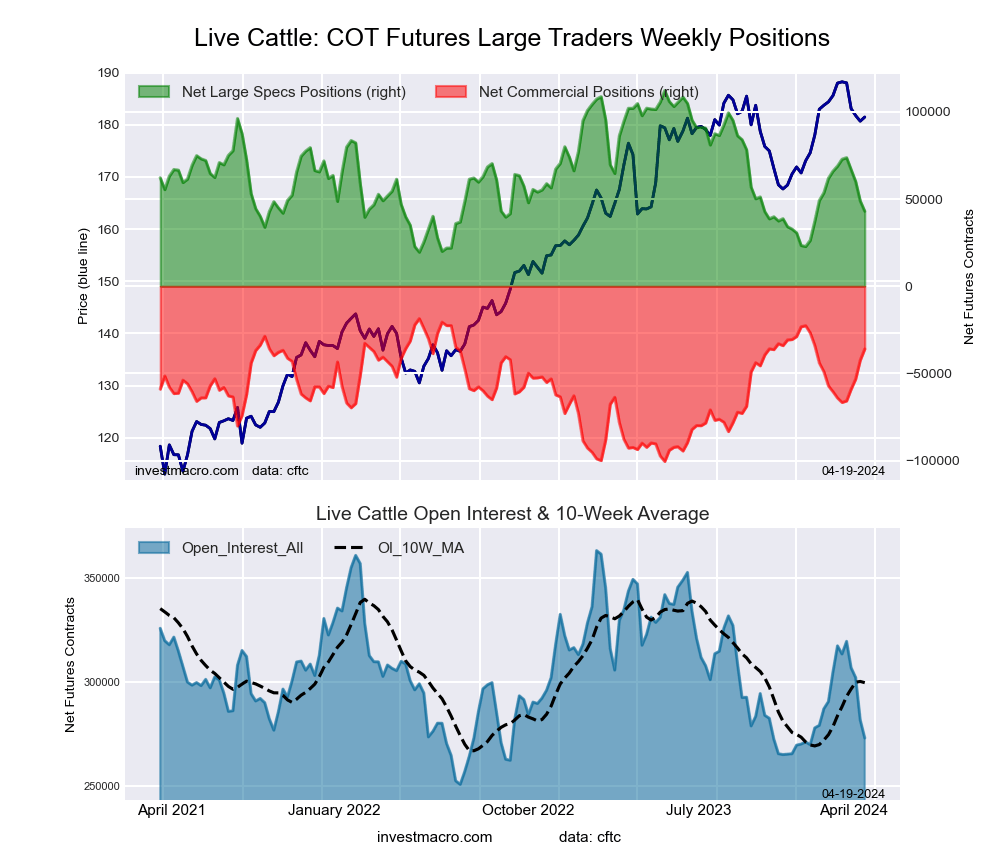
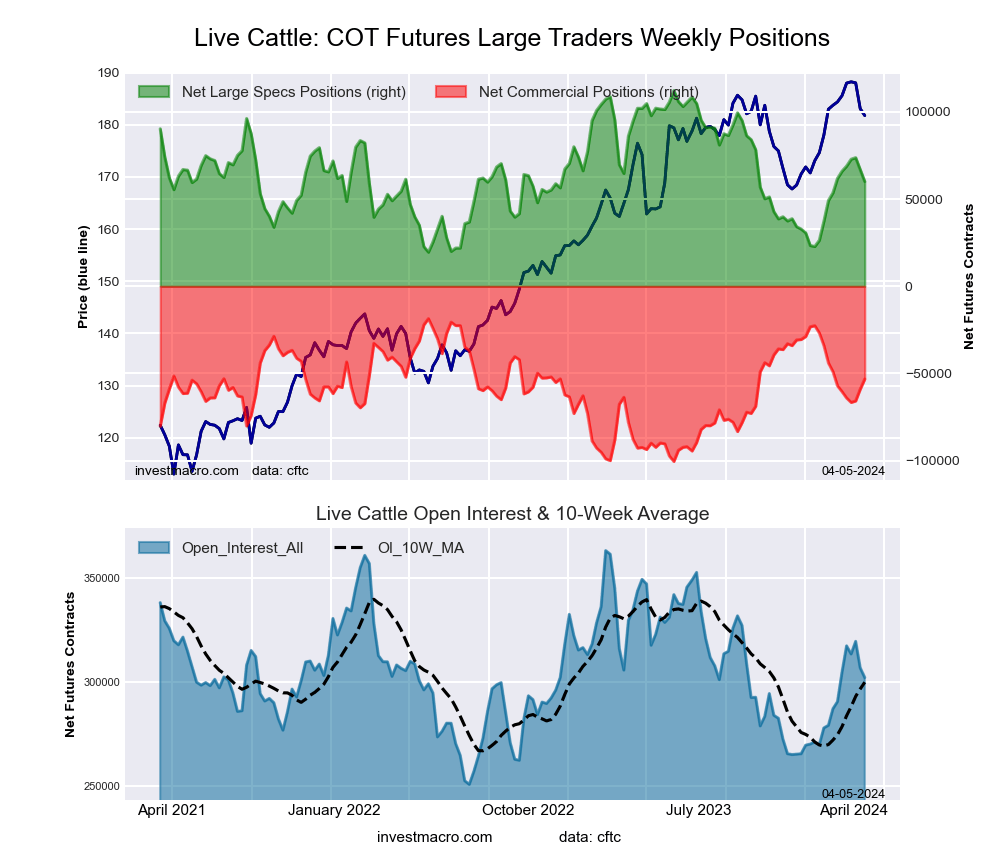
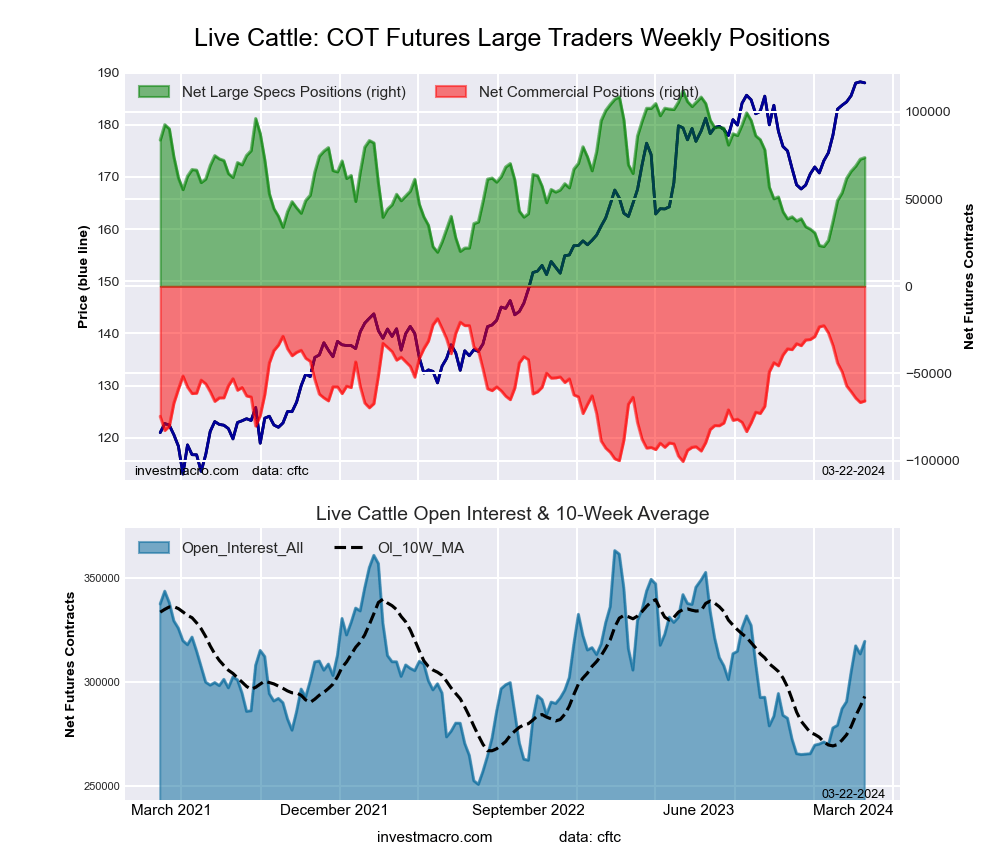
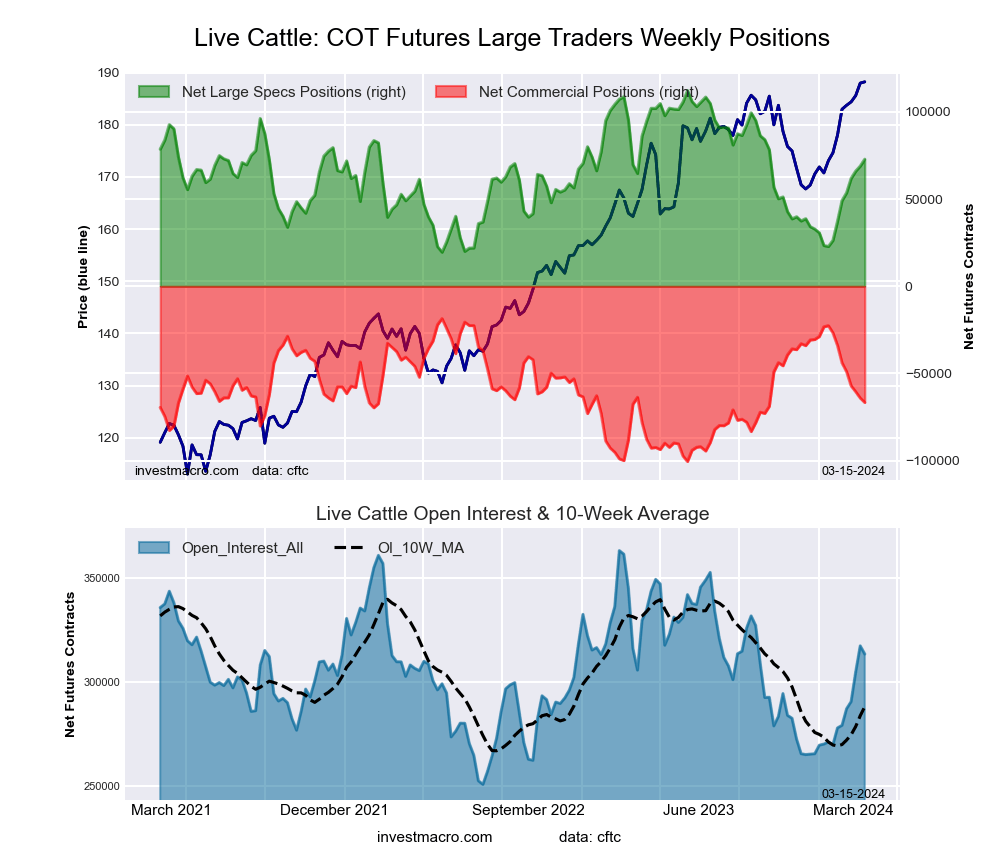
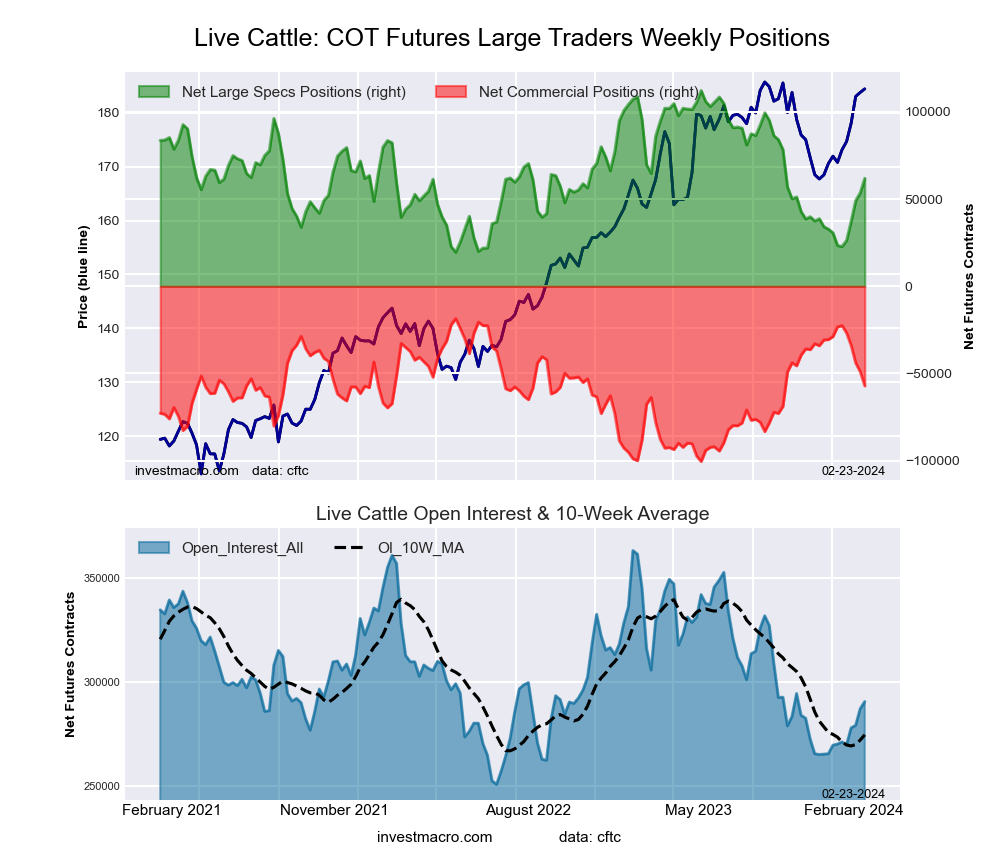
LIVE CATTLE Futures:
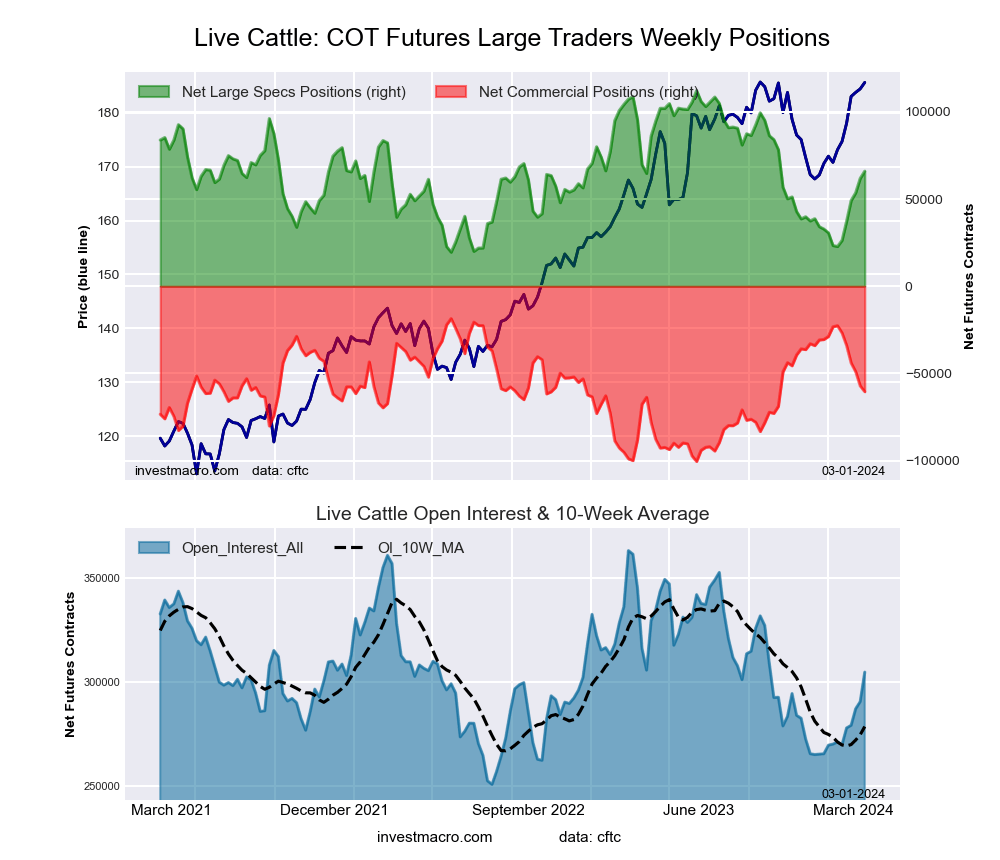 The LIVE CATTLE large speculator standing this week recorded a net position of 65,999 contracts in the data reported through Tuesday. This was a weekly boost of 4,119 contracts from the previous week which had a total of 61,880 net contracts.
This week’s current strength score (the trader positioning range over the past three years, measured from 0 to 100) shows the speculators are currently Bullish with a score of 50.1 percent. The commercials are Bearish with a score of 48.8 percent and the small traders (not shown in chart) are Bullish with a score of 60.2 percent.
Price Trend-Following Model: Strong Uptrend
Our weekly trend-following model classifies the current market price position as: Strong Uptrend. The current action for the model is considered to be: New Buy – Long Position.
| LIVE CATTLE Futures Statistics | SPECULATORS | COMMERCIALS | SMALL TRADERS |
| – Percent of Open Interest Longs: | 37.6 | 34.7 | 10.1 |
| – Percent of Open Interest Shorts: | 16.0 | 54.6 | 11.9 |
| – Net Position: | 65,999 | -60,465 | -5,534 |
| – Gross Longs: | 114,745 | 105,811 | 30,732 |
| – Gross Shorts: | 48,746 | 166,276 | 36,266 |
| – Long to Short Ratio: | 2.4 to 1 | 0.6 to 1 | 0.8 to 1 |
| NET POSITION TREND: | | | |
| – Strength Index Score (3 Year Range Pct): | 50.1 | 48.8 | 60.2 |
| – Strength Index Reading (3 Year Range): | Bullish | Bearish | Bullish |
| NET POSITION MOVEMENT INDEX: | | | |
| – 6-Week Change in Strength Index: | 46.6 | -46.2 | -28.5 |
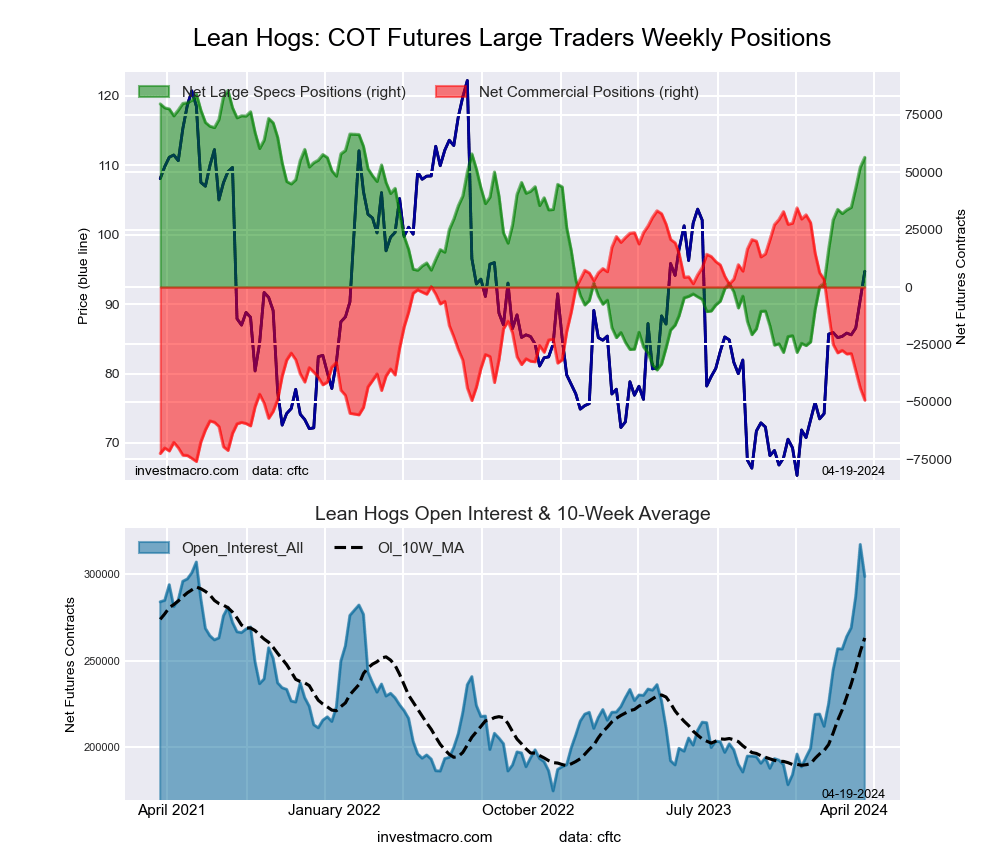
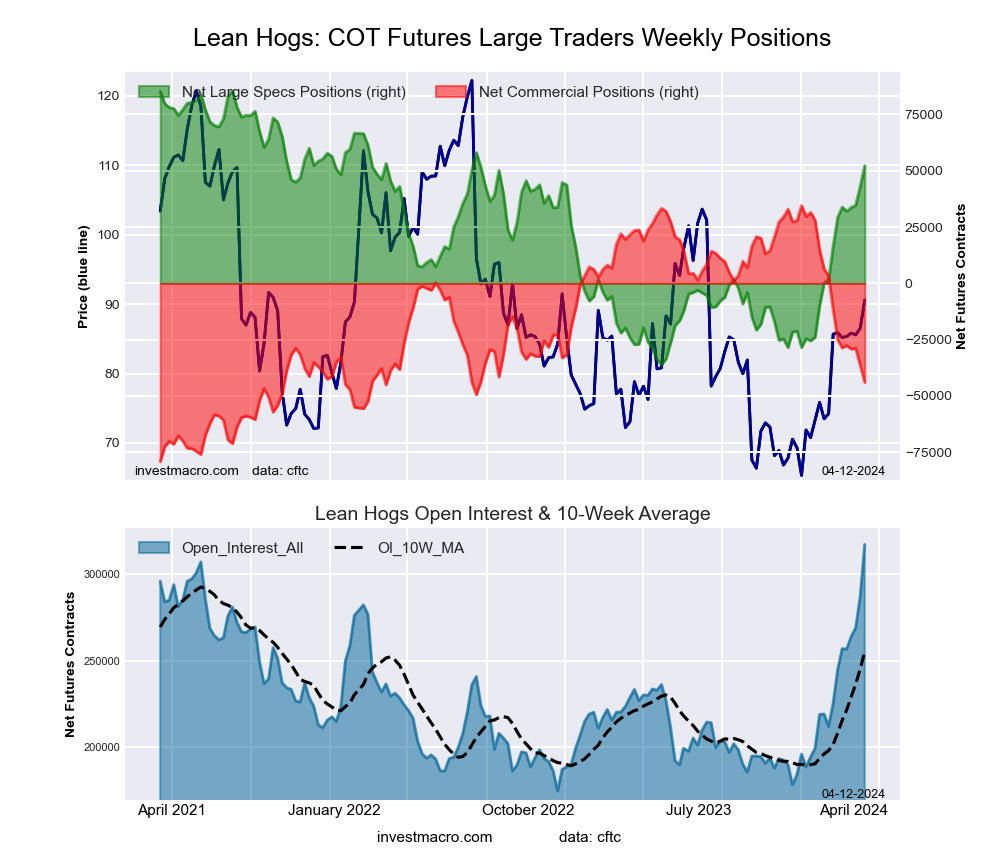
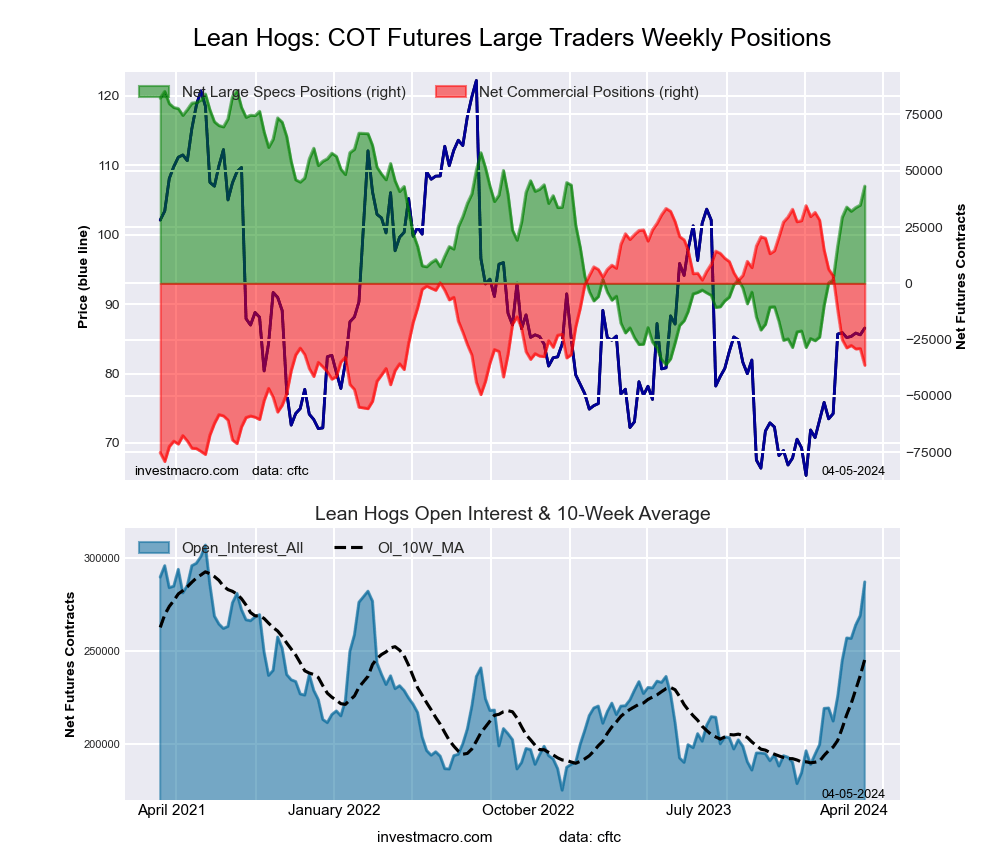
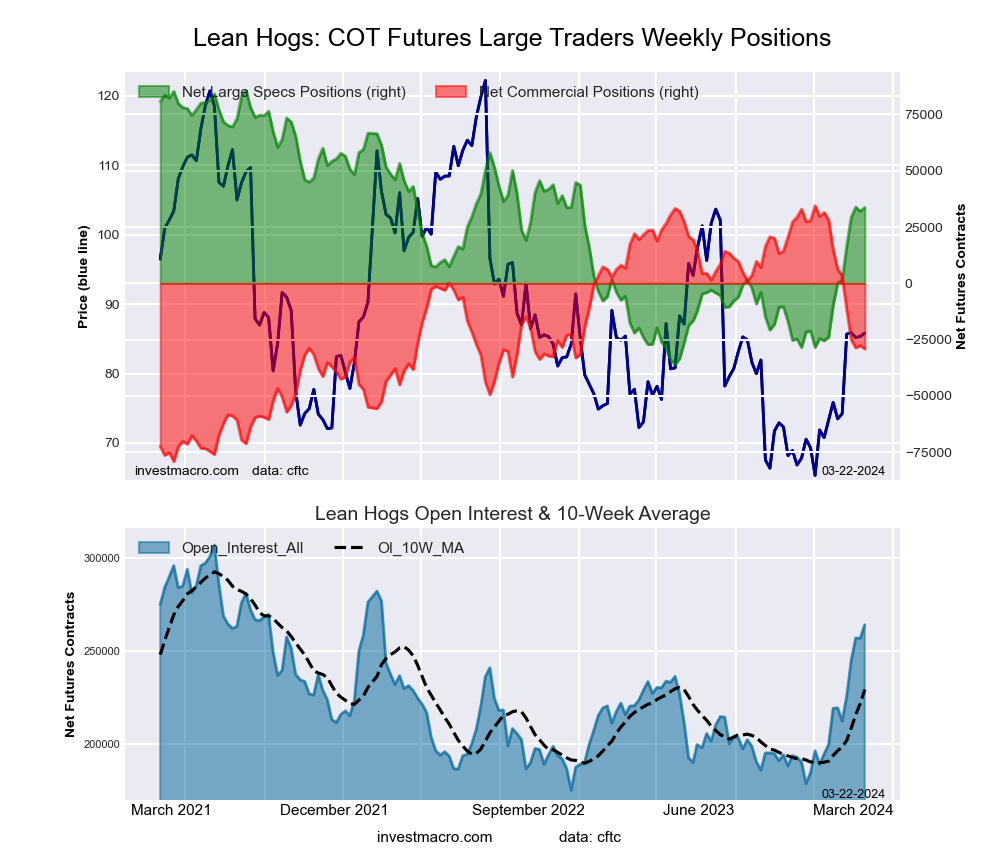
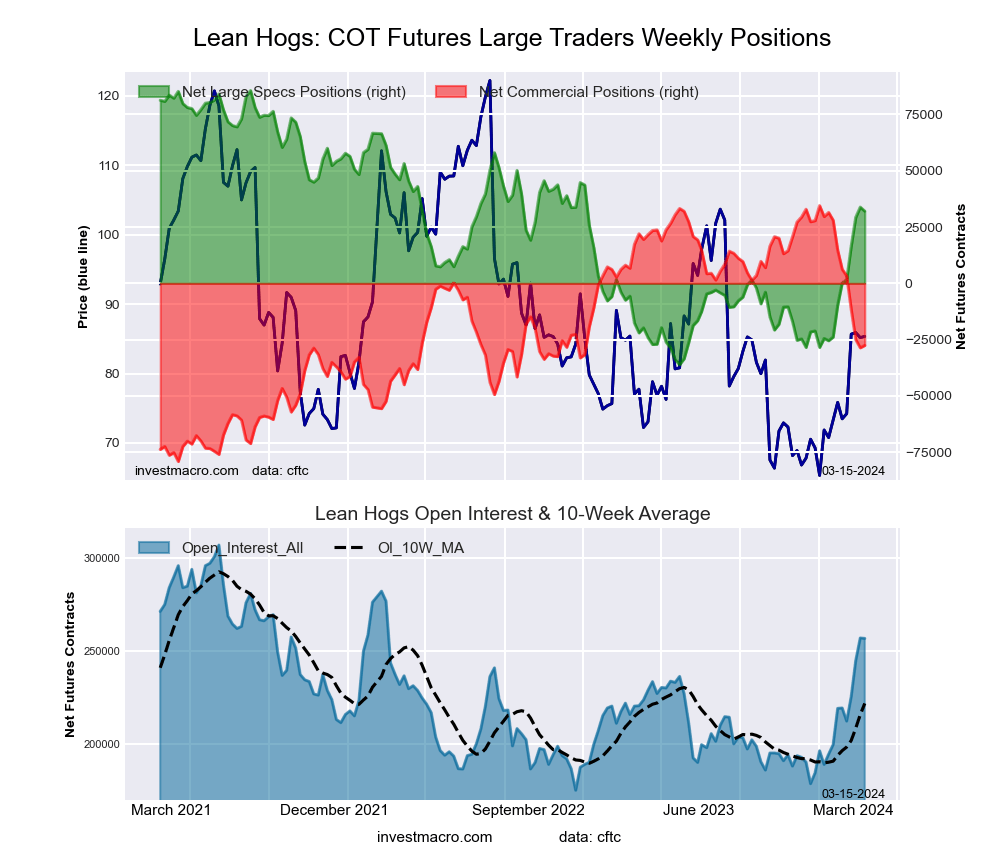
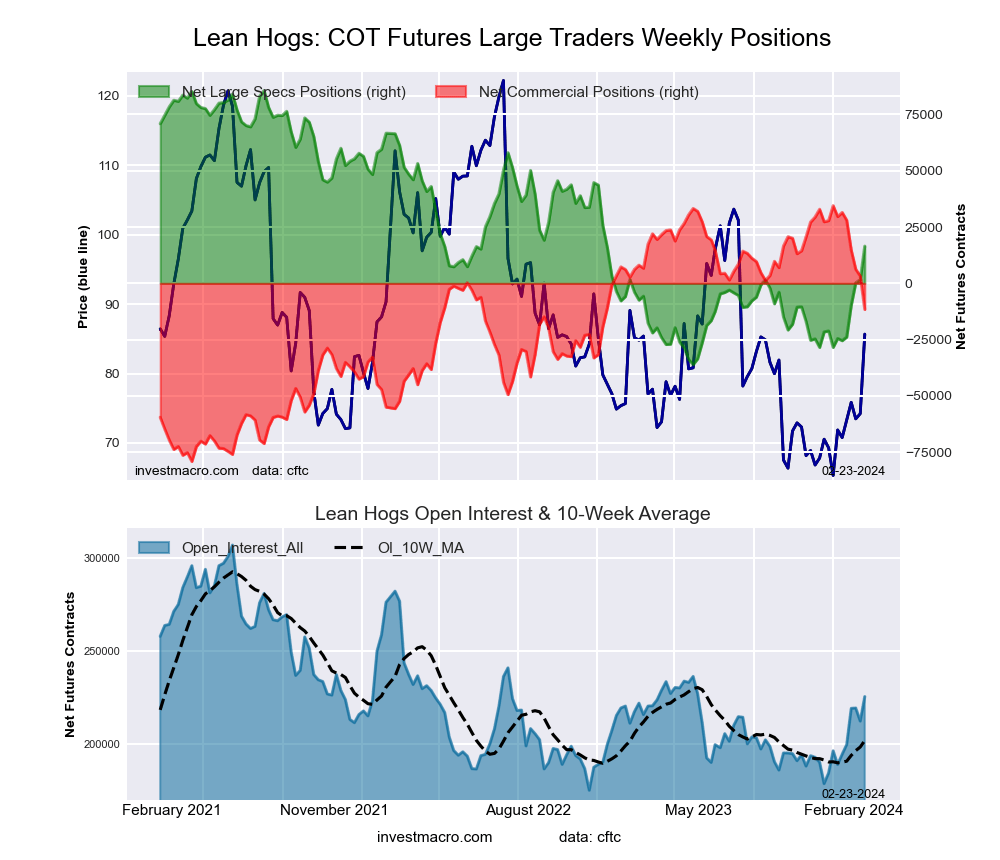
LEAN HOGS Futures:
 The LEAN HOGS large speculator standing this week recorded a net position of 29,286 contracts in the data reported through Tuesday. This was a weekly advance of 12,790 contracts from the previous week which had a total of 16,496 net contracts.
This week’s current strength score (the trader positioning range over the past three years, measured from 0 to 100) shows the speculators are currently Bullish with a score of 53.7 percent. The commercials are Bearish with a score of 47.6 percent and the small traders (not shown in chart) are Bullish with a score of 64.1 percent.
Price Trend-Following Model: Strong Uptrend
Our weekly trend-following model classifies the current market price position as: Strong Uptrend. The current action for the model is considered to be: Hold – Maintain Long Position.
| LEAN HOGS Futures Statistics | SPECULATORS | COMMERCIALS | SMALL TRADERS |
| – Percent of Open Interest Longs: | 38.4 | 33.8 | 8.5 |
| – Percent of Open Interest Shorts: | 26.5 | 44.0 | 10.2 |
| – Net Position: | 29,286 | -24,985 | -4,301 |
| – Gross Longs: | 94,037 | 82,658 | 20,760 |
| – Gross Shorts: | 64,751 | 107,643 | 25,061 |
| – Long to Short Ratio: | 1.5 to 1 | 0.8 to 1 | 0.8 to 1 |
| NET POSITION TREND: | | | |
| – Strength Index Score (3 Year Range Pct): | 53.7 | 47.6 | 64.1 |
| – Strength Index Reading (3 Year Range): | Bullish | Bearish | Bullish |
| NET POSITION MOVEMENT INDEX: | | | |
| – 6-Week Change in Strength Index: | 45.0 | -49.7 | 7.5 |
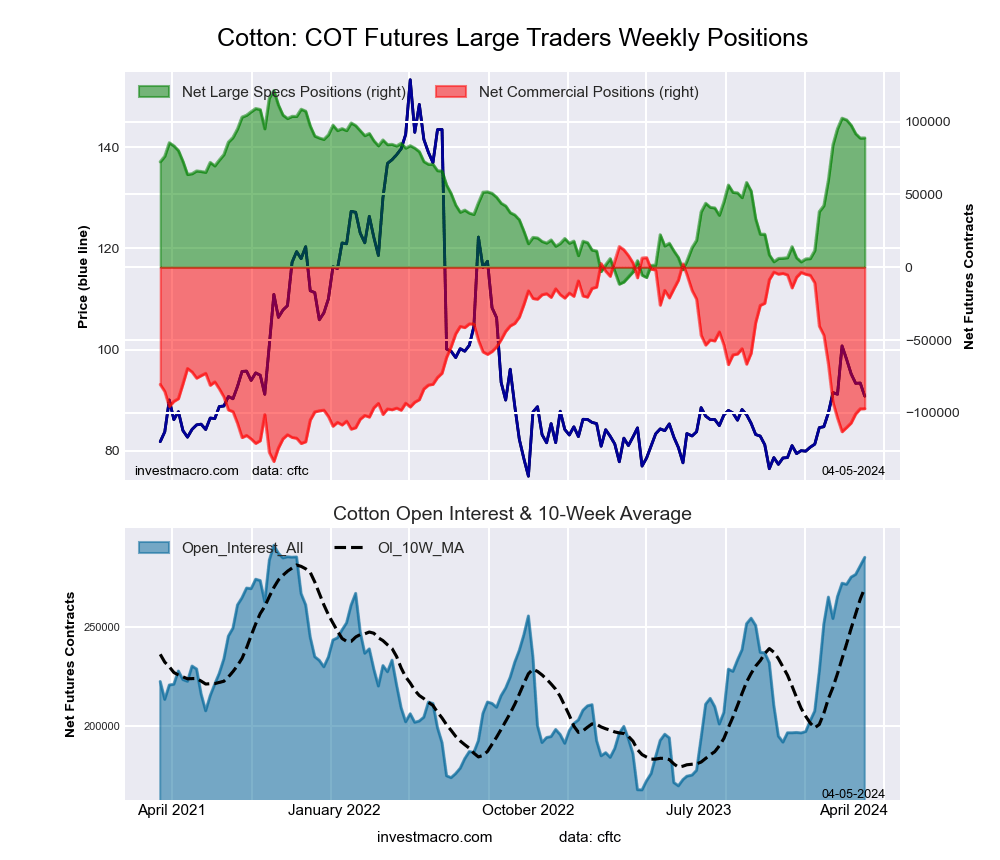
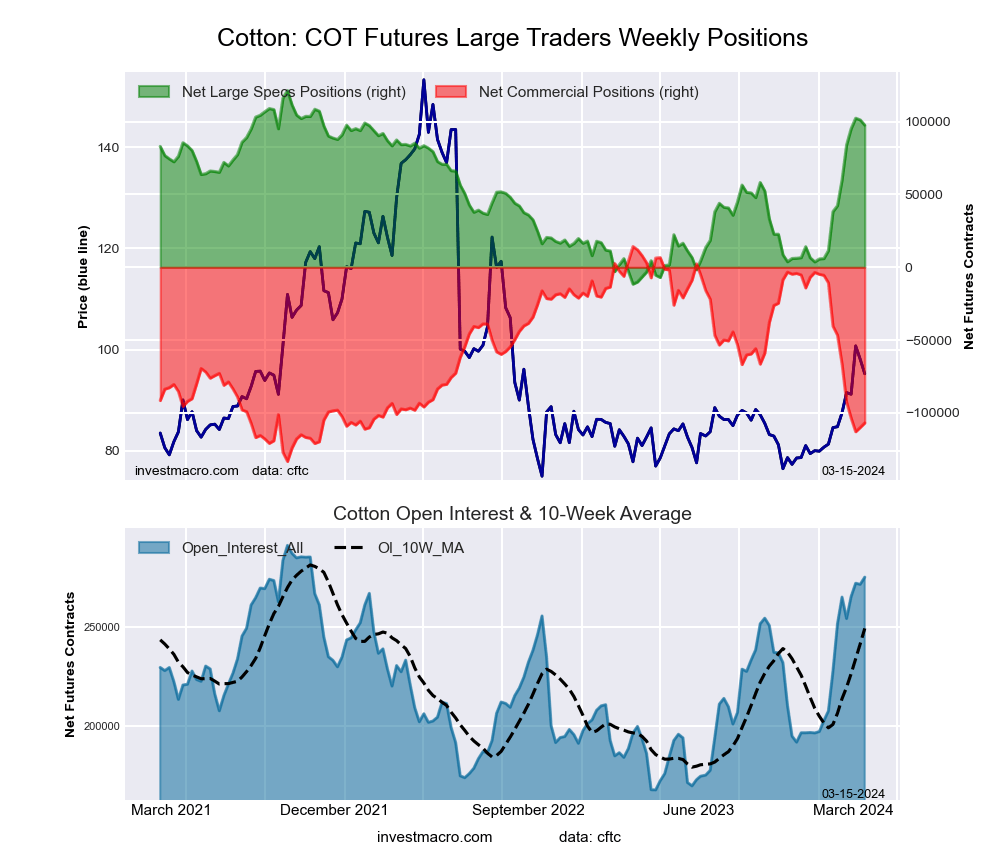
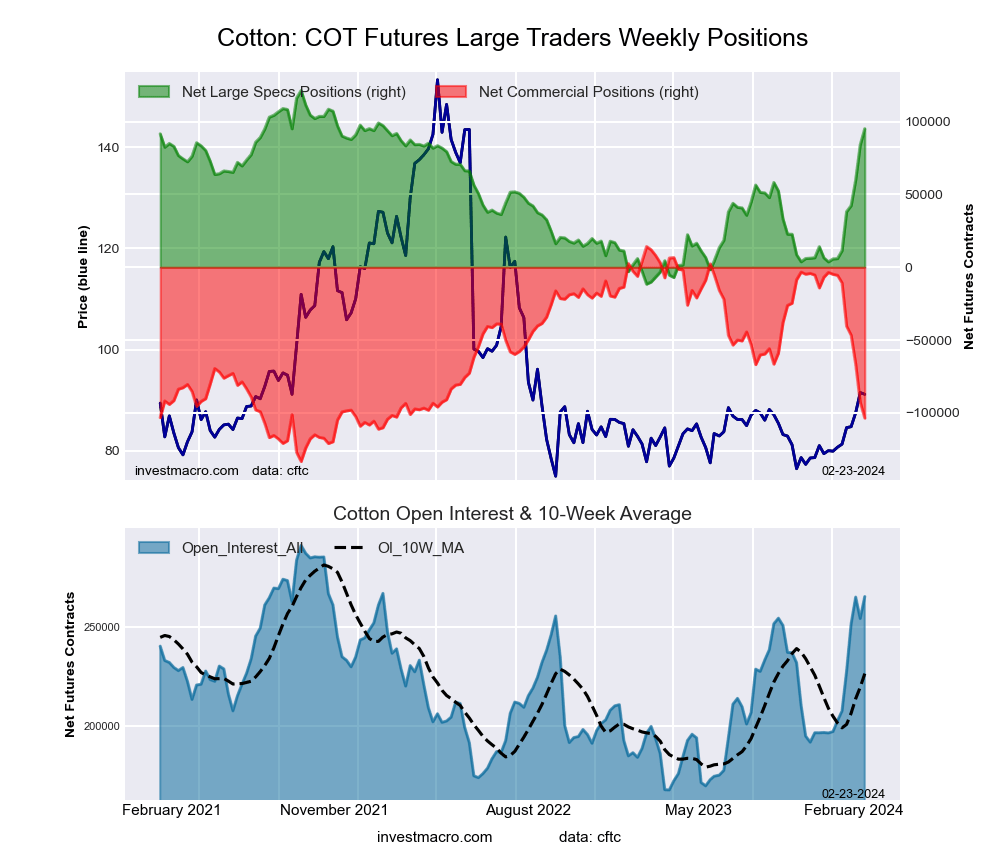
COTTON Futures:
 The COTTON large speculator standing this week recorded a net position of 102,305 contracts in the data reported through Tuesday. This was a weekly boost of 7,212 contracts from the previous week which had a total of 95,093 net contracts.
This week’s current strength score (the trader positioning range over the past three years, measured from 0 to 100) shows the speculators are currently Bullish-Extreme with a score of 85.7 percent. The commercials are Bearish-Extreme with a score of 13.8 percent and the small traders (not shown in chart) are Bullish-Extreme with a score of 80.2 percent.
Price Trend-Following Model: Strong Uptrend
Our weekly trend-following model classifies the current market price position as: Strong Uptrend. The current action for the model is considered to be: Hold – Maintain Long Position.
| COTTON Futures Statistics | SPECULATORS | COMMERCIALS | SMALL TRADERS |
| – Percent of Open Interest Longs: | 47.7 | 30.3 | 6.7 |
| – Percent of Open Interest Shorts: | 10.1 | 71.8 | 2.8 |
| – Net Position: | 102,305 | -112,881 | 10,576 |
| – Gross Longs: | 129,750 | 82,407 | 18,183 |
| – Gross Shorts: | 27,445 | 195,288 | 7,607 |
| – Long to Short Ratio: | 4.7 to 1 | 0.4 to 1 | 2.4 to 1 |
| NET POSITION TREND: | | | |
| – Strength Index Score (3 Year Range Pct): | 85.7 | 13.8 | 80.2 |
| – Strength Index Reading (3 Year Range): | Bullish-Extreme | Bearish-Extreme | Bullish-Extreme |
| NET POSITION MOVEMENT INDEX: | | | |
| – 6-Week Change in Strength Index: | 68.4 | -69.3 | 68.5 |
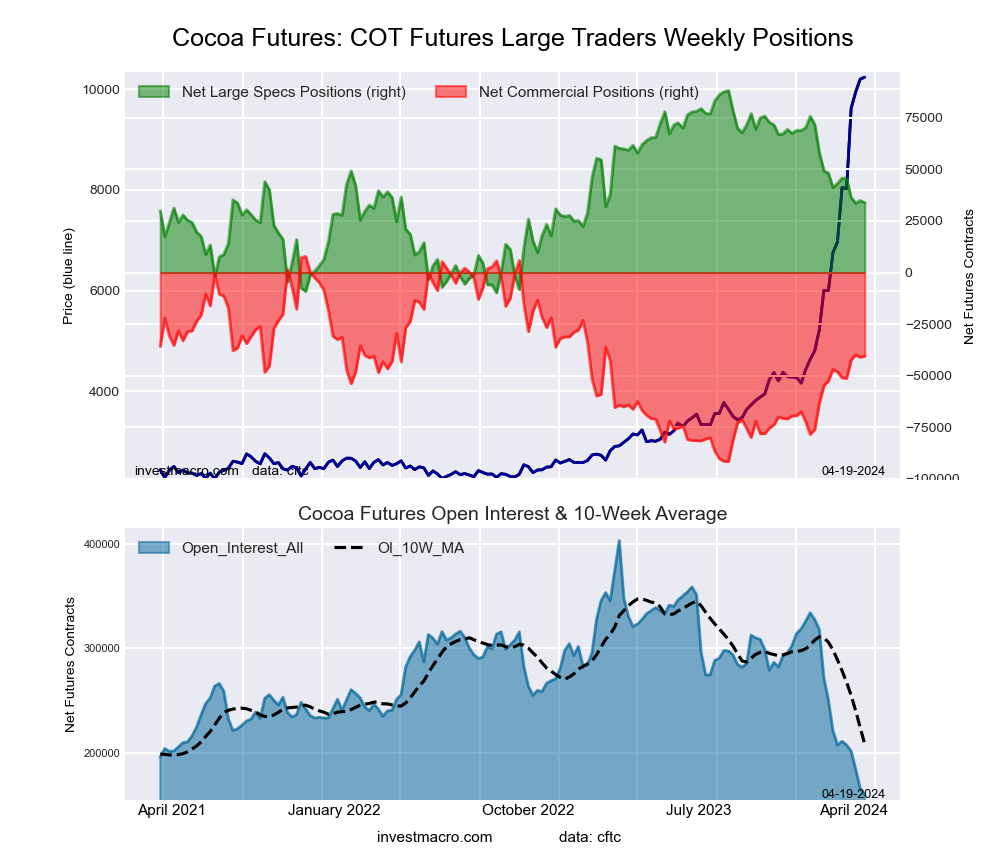
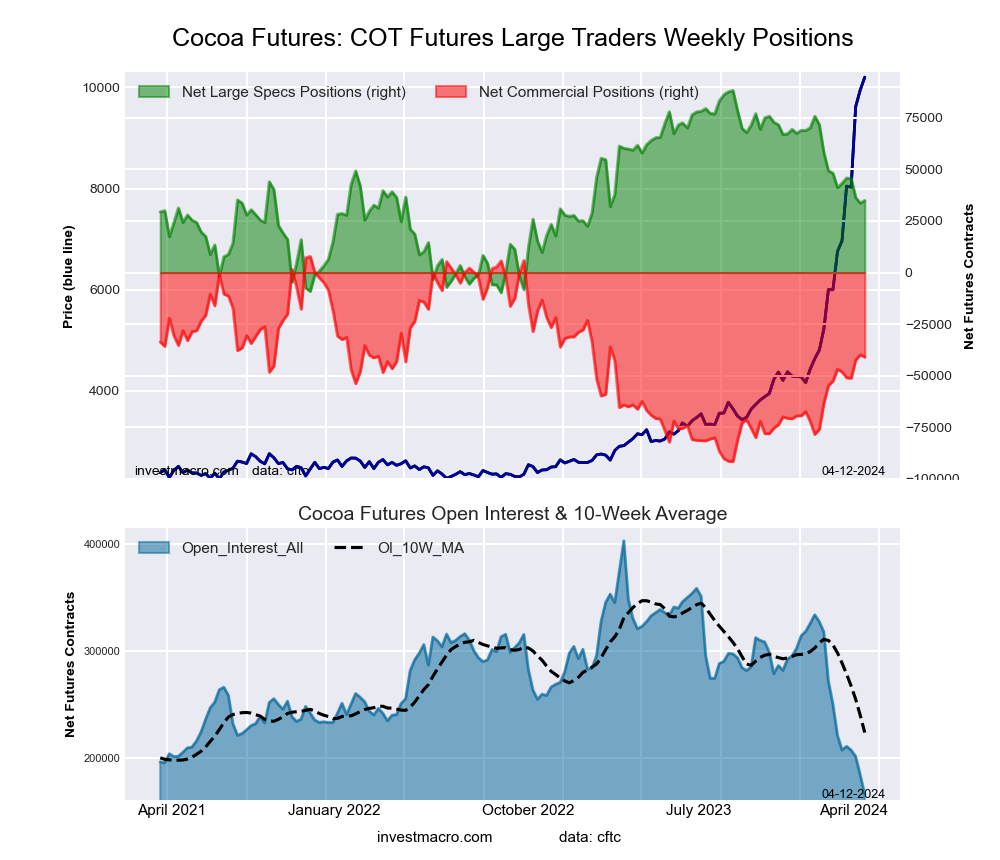
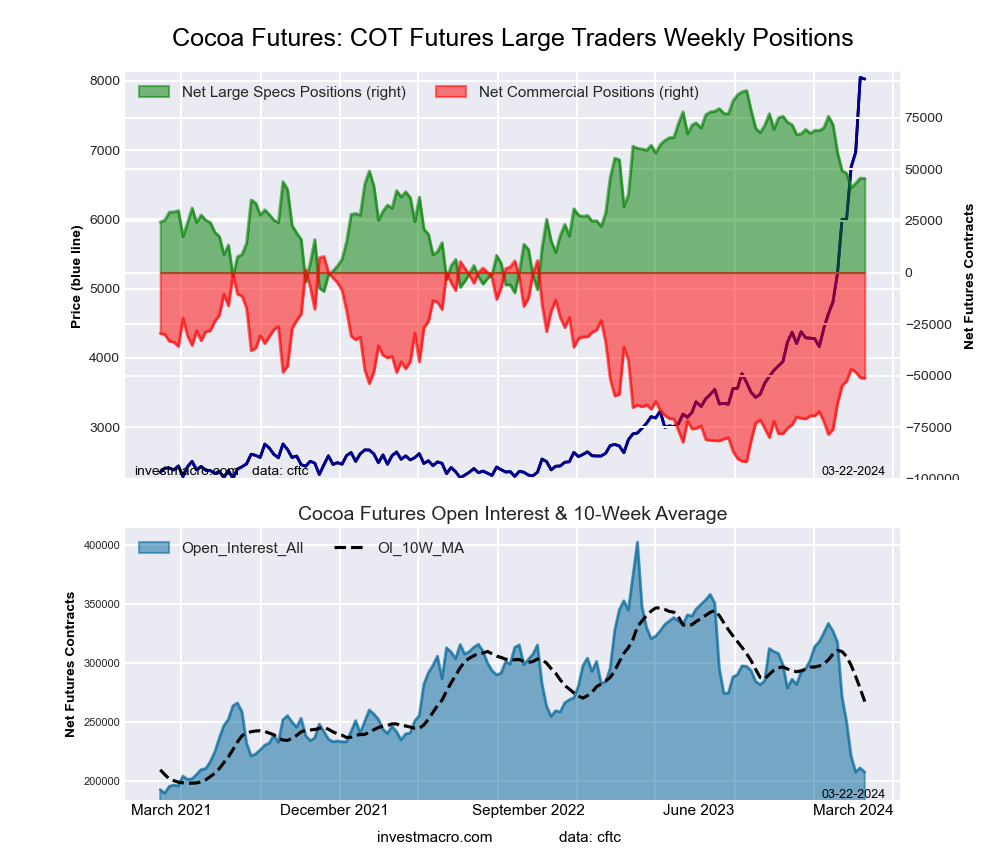
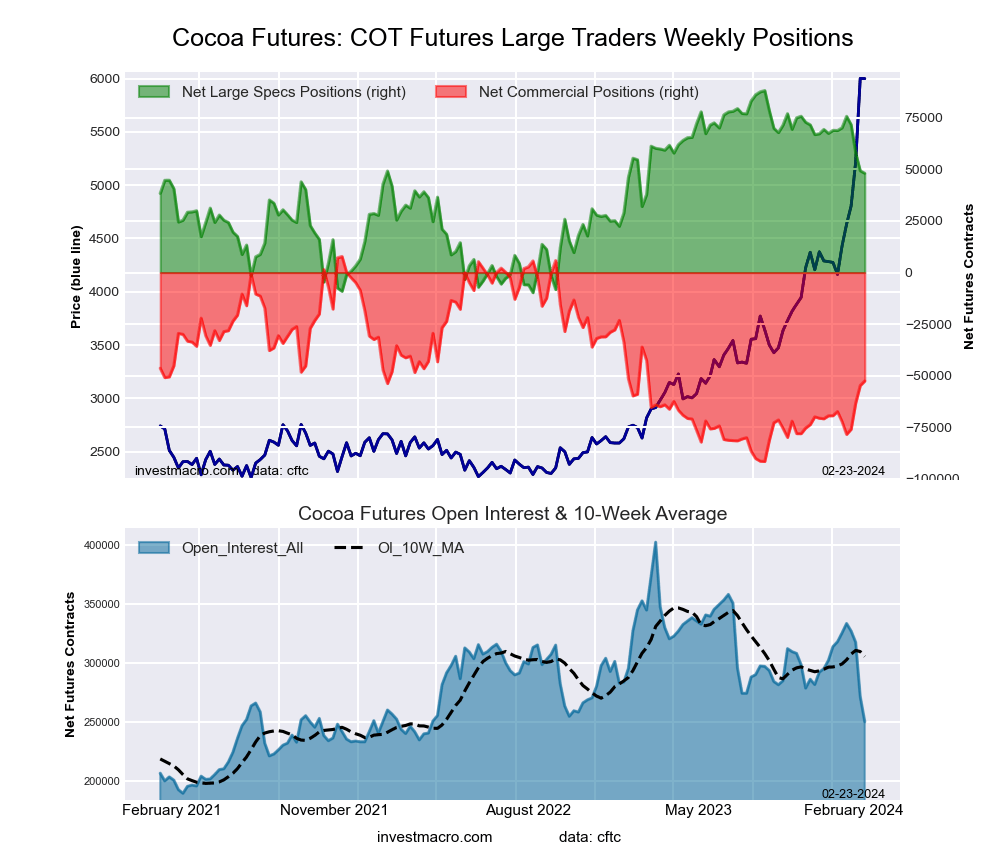
COCOA Futures:
 The COCOA large speculator standing this week recorded a net position of 41,188 contracts in the data reported through Tuesday. This was a weekly reduction of -6,938 contracts from the previous week which had a total of 48,126 net contracts.
This week’s current strength score (the trader positioning range over the past three years, measured from 0 to 100) shows the speculators are currently Bullish with a score of 52.0 percent. The commercials are Bearish with a score of 45.0 percent and the small traders (not shown in chart) are Bullish with a score of 60.6 percent.
Price Trend-Following Model: Strong Uptrend
Our weekly trend-following model classifies the current market price position as: Strong Uptrend. The current action for the model is considered to be: Hold – Maintain Long Position.
| COCOA Futures Statistics | SPECULATORS | COMMERCIALS | SMALL TRADERS |
| – Percent of Open Interest Longs: | 36.9 | 31.0 | 6.5 |
| – Percent of Open Interest Shorts: | 18.3 | 52.3 | 3.9 |
| – Net Position: | 41,188 | -46,871 | 5,683 |
| – Gross Longs: | 81,552 | 68,544 | 14,358 |
| – Gross Shorts: | 40,364 | 115,415 | 8,675 |
| – Long to Short Ratio: | 2.0 to 1 | 0.6 to 1 | 1.7 to 1 |
| NET POSITION TREND: | | | |
| – Strength Index Score (3 Year Range Pct): | 52.0 | 45.0 | 60.6 |
| – Strength Index Reading (3 Year Range): | Bullish | Bearish | Bullish |
| NET POSITION MOVEMENT INDEX: | | | |
| – 6-Week Change in Strength Index: | -29.6 | 25.6 | 30.3 |
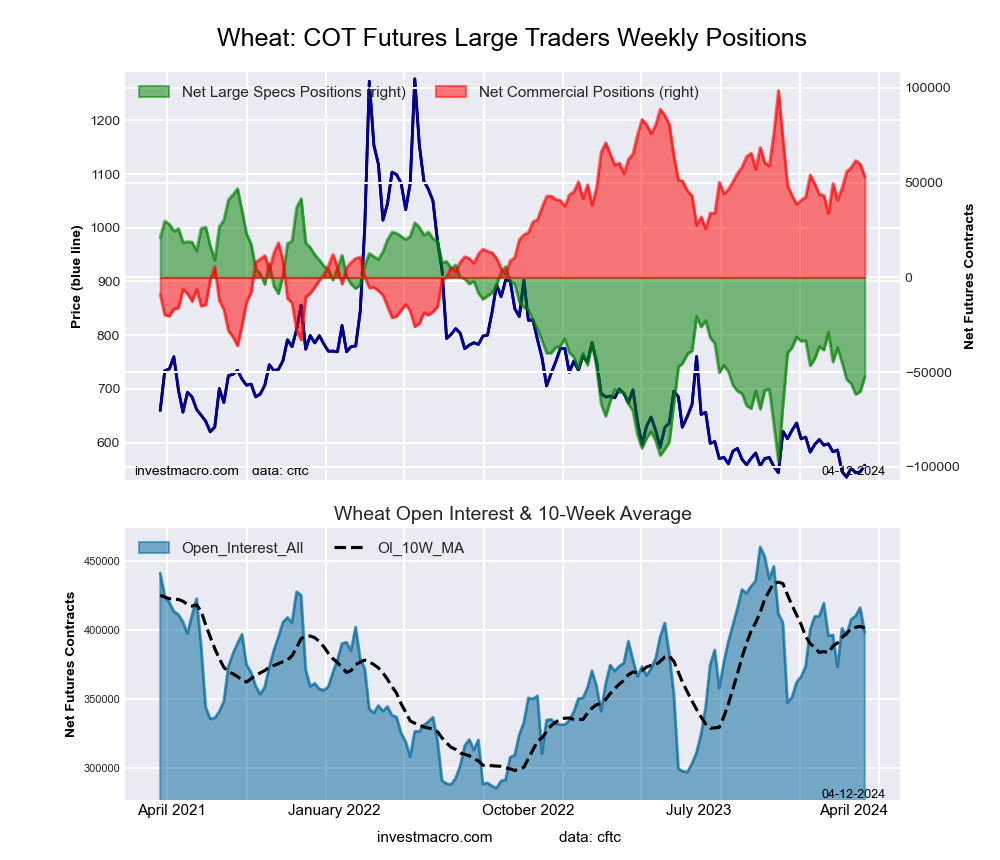
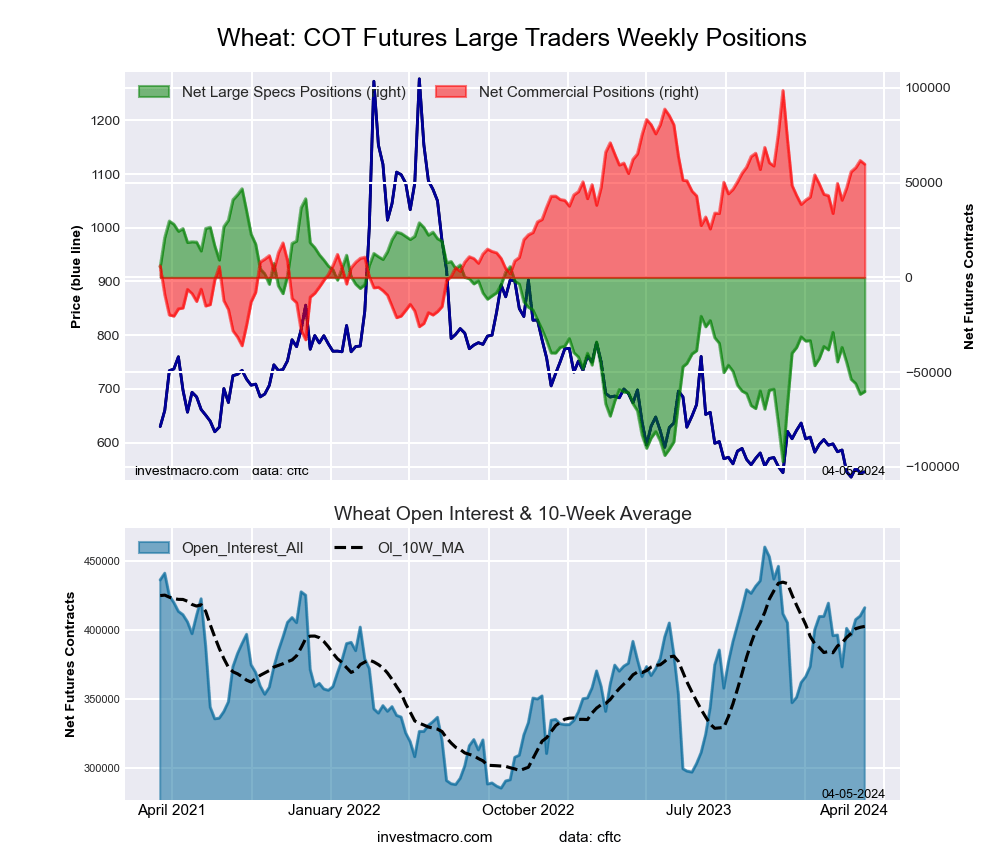
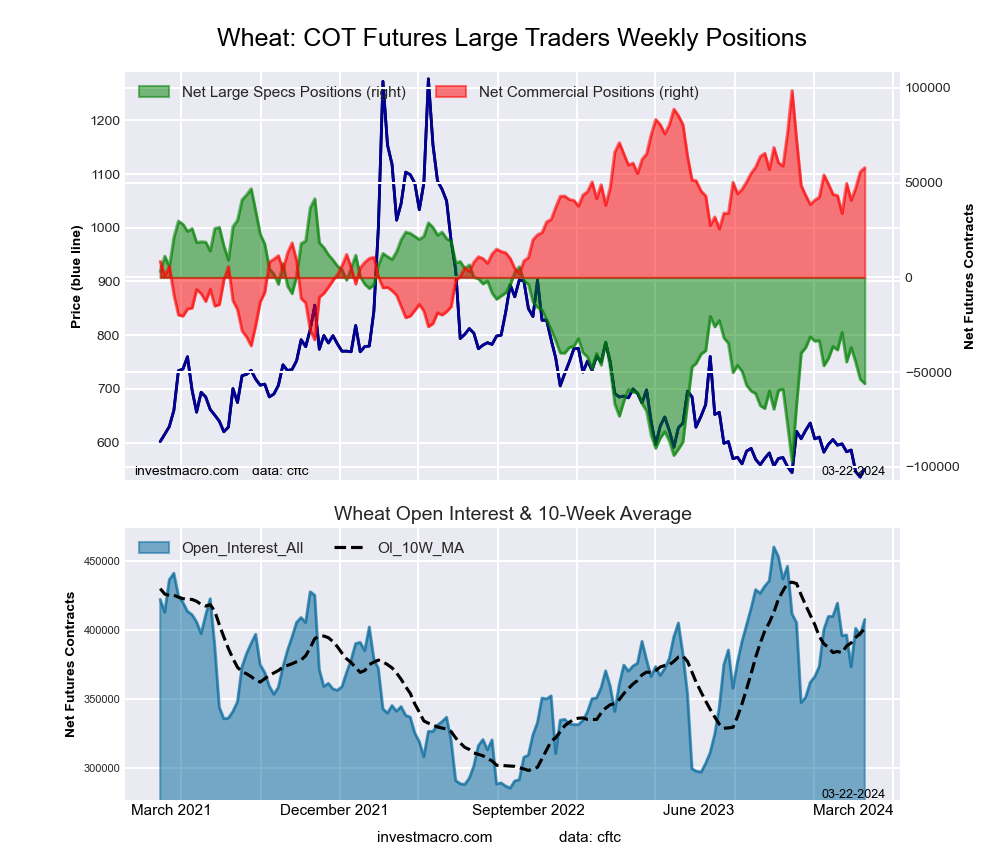
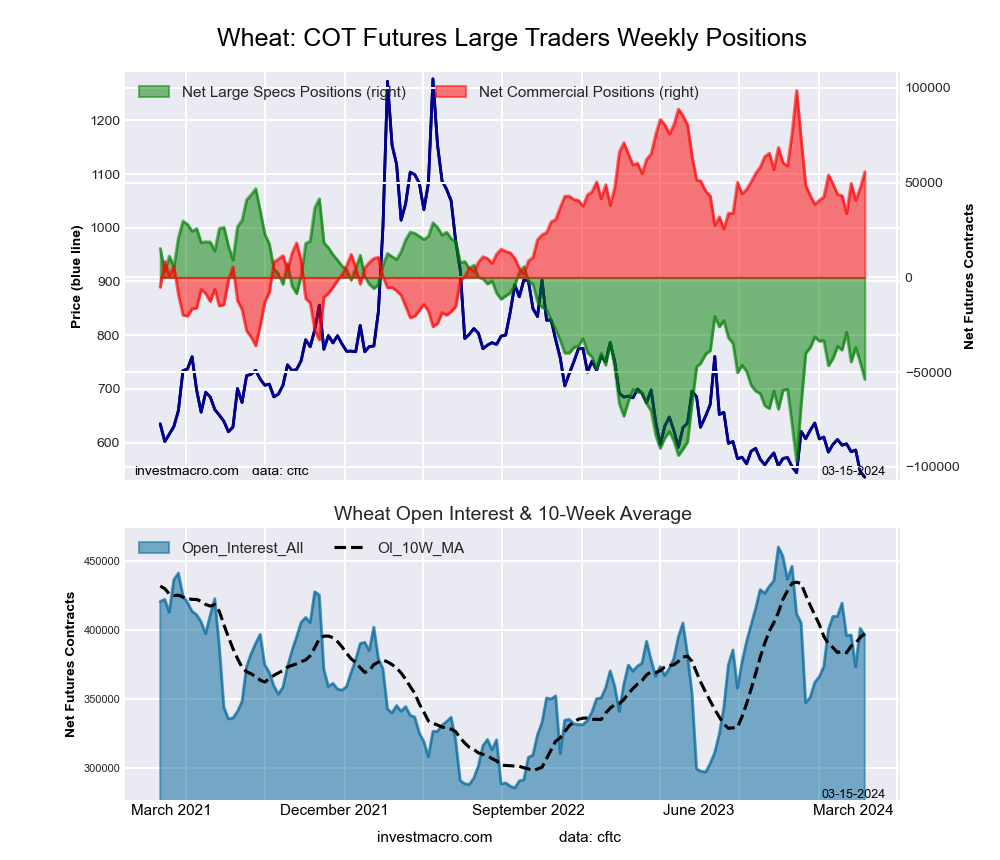
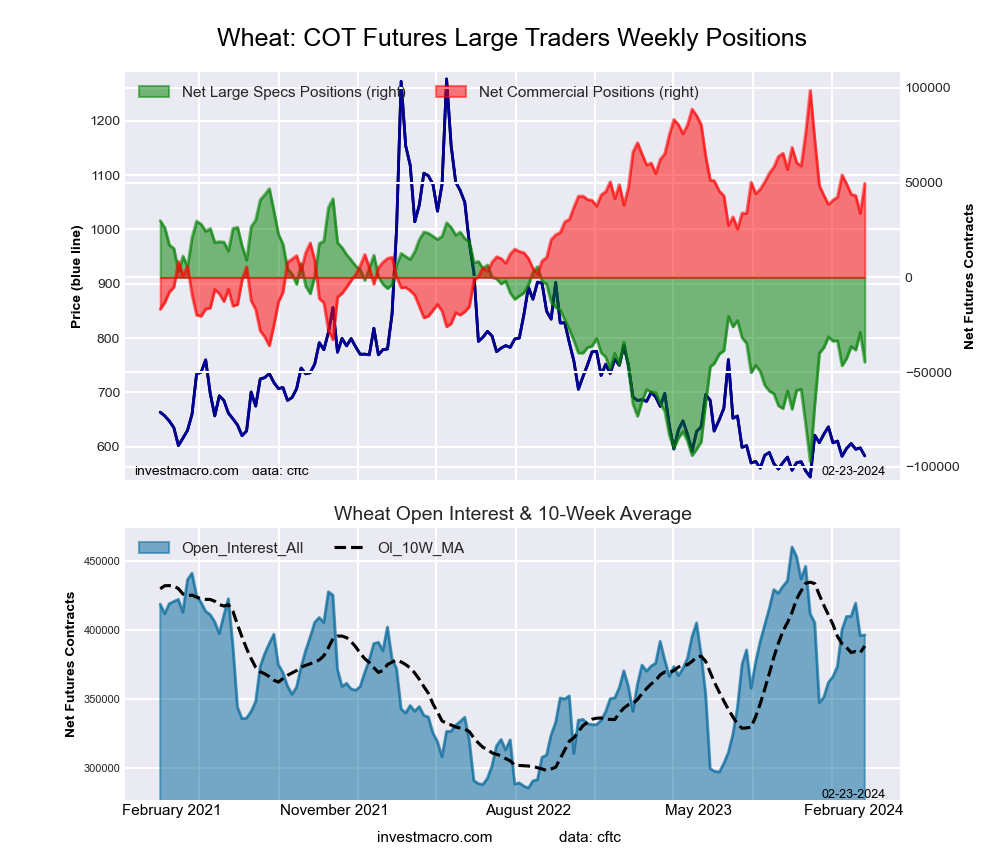
WHEAT Futures:
 The WHEAT large speculator standing this week recorded a net position of -36,981 contracts in the data reported through Tuesday. This was a weekly rise of 7,658 contracts from the previous week which had a total of -44,639 net contracts.
This week’s current strength score (the trader positioning range over the past three years, measured from 0 to 100) shows the speculators are currently Bearish with a score of 41.8 percent. The commercials are Bullish with a score of 57.0 percent and the small traders (not shown in chart) are Bearish with a score of 49.7 percent.
Price Trend-Following Model: Weak Uptrend
Our weekly trend-following model classifies the current market price position as: Weak Uptrend. The current action for the model is considered to be: Hold – Maintain Long Position.
| WHEAT Futures Statistics | SPECULATORS | COMMERCIALS | SMALL TRADERS |
| – Percent of Open Interest Longs: | 33.0 | 36.8 | 7.8 |
| – Percent of Open Interest Shorts: | 42.9 | 25.9 | 8.8 |
| – Net Position: | -36,981 | 40,756 | -3,775 |
| – Gross Longs: | 123,166 | 137,340 | 28,974 |
| – Gross Shorts: | 160,147 | 96,584 | 32,749 |
| – Long to Short Ratio: | 0.8 to 1 | 1.4 to 1 | 0.9 to 1 |
| NET POSITION TREND: | | | |
| – Strength Index Score (3 Year Range Pct): | 41.8 | 57.0 | 49.7 |
| – Strength Index Reading (3 Year Range): | Bearish | Bullish | Bearish |
| NET POSITION MOVEMENT INDEX: | | | |
| – 6-Week Change in Strength Index: | 6.7 | -9.9 | 16.0 |
Article By InvestMacro – Receive our weekly COT Newsletter
*COT Report: The COT data, released weekly to the public each Friday, is updated through the most recent Tuesday (data is 3 days old) and shows a quick view of how large speculators or non-commercials (for-profit traders) were positioned in the futures markets.
The CFTC categorizes trader positions according to commercial hedgers (traders who use futures contracts for hedging as part of the business), non-commercials (large traders who speculate to realize trading profits) and nonreportable traders (usually small traders/speculators) as well as their open interest (contracts open in the market at time of reporting). See CFTC criteria here.