
By InvestMacro | COT | Data Tables | COT Leaders | Downloads | COT Newsletter

Here are the latest charts and statistics for the Commitment of Traders (COT) data published by the Commodities Futures Trading Commission (CFTC).
The latest COT data is updated through Tuesday July 19th and shows a quick view of how large traders (for-profit speculators and commercial entities) were positioned in the futures markets. All currency positions are in direct relation to the US dollar where, for example, a bet for the euro is a bet that the euro will rise versus the dollar while a bet against the euro will be a bet that the euro will decline versus the dollar.
Weekly Speculator Changes
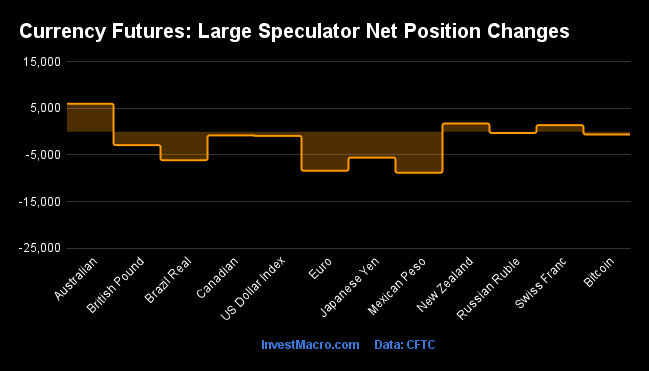
COT currency market speculator bets were mostly higher this week as six out of the eleven currency markets we cover had higher positioning while the other five markets had lower speculator contracts.
Leading the gains for the currency markets was the Canadian dollar (3,162 contracts) and the British pound sterling (1,839 contracts) while the New Zealand dollar (1,612 contracts), the Japanese yen (773 contracts), the US Dollar Index (715 contracts) and the Brazilian real (270 contracts) also had higher speculator bets for the week.
The currencies leading the declines in speculator bets this week were the Euro (-17,501 contracts) and Mexican peso (-7,522 contracts) with the Swiss franc (-2,188 contracts), the Australian dollar (-1,548 contracts) and Bitcoin (-335 contracts) also registering lower bets on the week.
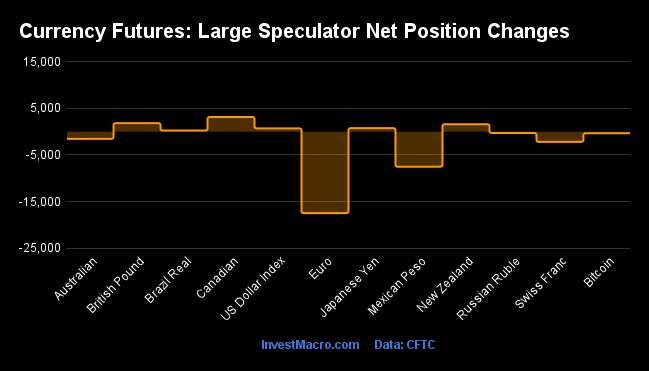
Highlighting the currencies data is the Euro’s continued decline in speculator bets. The Euro’s speculator positioning declined for the third straight week and for the sixth time in the past seven weeks which has taken off a total of -95,017 contracts from the speculator standing in that seven-week period. This decline has quickly taken the Euro speculator contracts from +52,272 contracts on May 31st to a total of -42,745 contracts this week. The EURUSD’s spot price this week had a modest bounce-back following a three-week decline and a dip below parity with the US Dollar last week. The EURUSD currency pair closed the week near the 1.0215 spot exchange rate after gaining by approximately 1.25 percent for the week.
The US Dollar Index speculator bets, meanwhile, rose this week for the first time in the past four weeks and remain near the top of their speculative range. Dollar speculators had taken a total of -6,656 contracts off the bullish position in the previous three weeks and pulled the net bullish position below +40,000 contracts for the first time since June 28th before this week’s small rebound. Speculators have been uber-bullish recently on the dollar and the past four months has seen a strong surge to the upside. Since April, the US Dollar Index price has been higher in twelve out of fifteen weeks and culminated with the highest DXY price in approximately twenty years above 109.00. The dollar strength has been punishing the other major currencies as the Euro and Yen have hit multi-decade lows (versus the USD) with the US Federal Reserve sharply raising interest rates to combat inflation. The Dollar Index spot price cooled off this week by approximately 1.30 percent and closed around the 106.50 exchange rate.
| Jul-19-2022 | OI | OI-Index | Spec-Net | Spec-Index | Com-Net | COM-Index | Smalls-Net | Smalls-Index |
|---|---|---|---|---|---|---|---|---|
| USD Index | 59,214 | 87 | 39,069 | 90 | -41,500 | 10 | 2,431 | 43 |
| EUR | 694,106 | 80 | -42,745 | 22 | 17,430 | 81 | 25,315 | 16 |
| GBP | 228,051 | 56 | -57,250 | 33 | 70,299 | 71 | -13,049 | 29 |
| JPY | 229,449 | 75 | -59,225 | 32 | 73,082 | 71 | -13,857 | 25 |
| CHF | 41,855 | 25 | -10,912 | 29 | 19,205 | 74 | -8,293 | 29 |
| CAD | 142,216 | 25 | 6,667 | 47 | -8,746 | 61 | 2,079 | 34 |
| AUD | 155,246 | 49 | -43,148 | 45 | 49,276 | 56 | -6,128 | 37 |
| NZD | 45,467 | 35 | -3,671 | 65 | 7,227 | 42 | -3,556 | 11 |
| MXN | 196,123 | 47 | -30,760 | 14 | 27,890 | 84 | 2,870 | 55 |
| RUB | 20,930 | 4 | 7,543 | 31 | -7,150 | 69 | -393 | 24 |
| BRL | 42,452 | 30 | 10,475 | 61 | -11,580 | 40 | 1,105 | 78 |
| Bitcoin | 14,512 | 84 | -506 | 71 | -66 | 0 | 572 | 26 |
Strength Scores
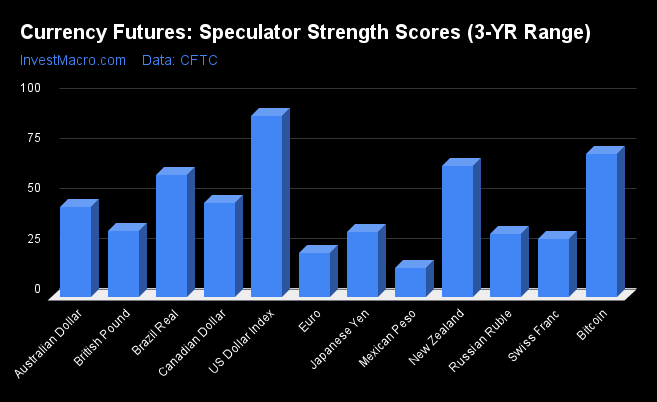
Strength Scores (a normalized measure of Speculator positions over a 3-Year range, from 0 to 100 where above 80 is extreme bullish and below 20 is extreme bearish) show that the US Dollar Index (90.1 percent) leads the currency markets once again and remains in a bullish extreme position. Bitcoin (71.1 percent), the New Zealand Dollar (65.1 percent) and the Brazilian Real (60.7 percent) come in as the next highest in strength scores – also for a second straight week. On the downside, the Mexican Peso (14.2 percent) remains the currency with the lowest strength level currently and is followed by the EuroFX (21.9 percent) which is quickly getting more bearish by the week.
Strength Statistics:
US Dollar Index (90.1 percent) vs US Dollar Index previous week (88.9 percent)
EuroFX (21.9 percent) vs EuroFX previous week (27.3 percent)
British Pound Sterling (32.8 percent) vs British Pound Sterling previous week (31.4 percent)
Japanese Yen (32.4 percent) vs Japanese Yen previous week (31.9 percent)
Swiss Franc (28.8 percent) vs Swiss Franc previous week (34.4 percent)
Canadian Dollar (46.8 percent) vs Canadian Dollar previous week (43.3 percent)
Australian Dollar (44.8 percent) vs Australian Dollar previous week (46.3 percent)
New Zealand Dollar (65.1 percent) vs New Zealand Dollar previous week (62.4 percent)
Mexican Peso (14.2 percent) vs Mexican Peso previous week (17.4 percent)
Brazil Real (60.7 percent) vs Brazil Real previous week (60.4 percent)
Russian Ruble (31.2 percent) vs Russian Ruble previous week (31.9 percent)
Bitcoin (71.1 percent) vs Bitcoin previous week (77.2 percent)
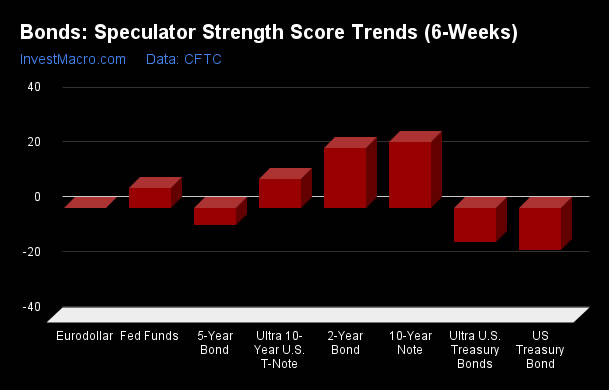
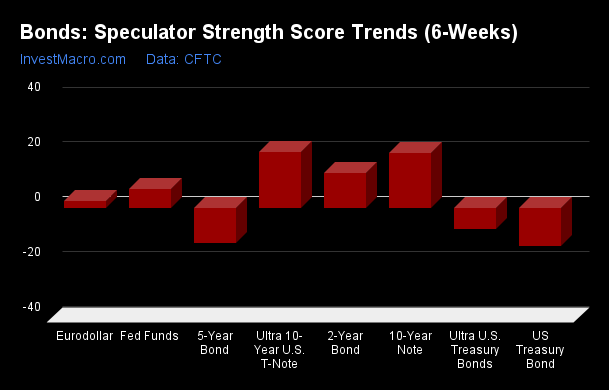
Strength Trends
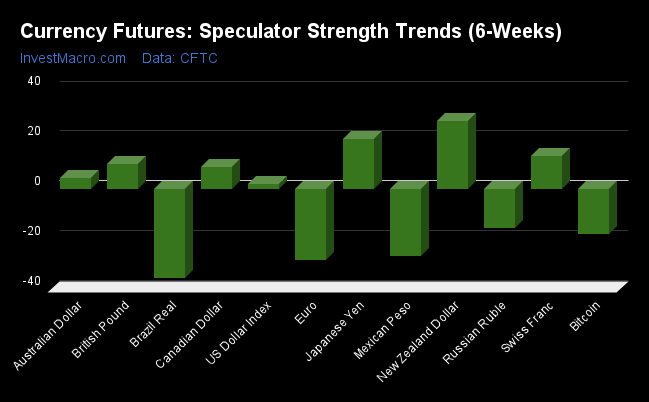
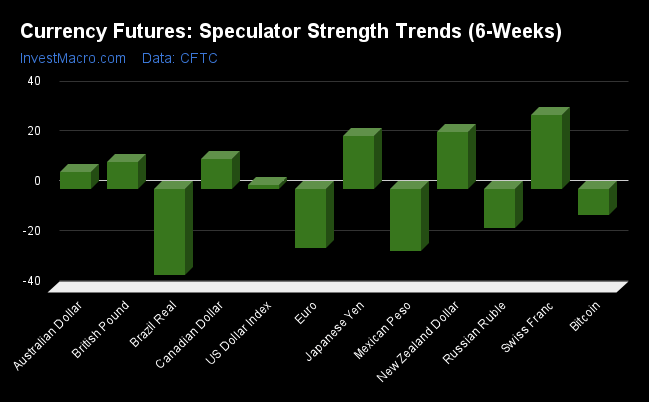
Strength Score Trends (or move index, calculates the 6-week changes in strength scores) show that the New Zealand Dollar (27.0 percent) leads the past six weeks trends for the currency markets this week. The Japanese Yen (20.0 percent) and the Swiss Franc (13.2 percent) fill out the top movers in the trends data. The Brazilian Real (-35.6 percent) leads the downside trend scores currently while the next markets with lower trend scores were the EuroFX (-28.6 percent) followed by the Mexican Peso (-27.1 percent).
Strength Trend Statistics:
US Dollar Index (1.9 percent) vs US Dollar Index previous week (1.4 percent)
EuroFX (-28.6 percent) vs EuroFX previous week (-23.8 percent)
British Pound Sterling (9.8 percent) vs British Pound Sterling previous week (10.8 percent)
Japanese Yen (20.0 percent) vs Japanese Yen previous week (21.2 percent)
Swiss Franc (13.2 percent) vs Swiss Franc previous week (29.7 percent)
Canadian Dollar (8.7 percent) vs Canadian Dollar previous week (11.8 percent)
Australian Dollar (4.4 percent) vs Australian Dollar previous week (6.6 percent)
New Zealand Dollar (27.0 percent) vs New Zealand Dollar previous week (22.6 percent)
Mexican Peso (-27.1 percent) vs Mexican Peso previous week (-25.0 percent)
Brazil Real (-35.6 percent) vs Brazil Real previous week (-34.5 percent)
Russian Ruble (-15.6 percent) vs Russian Ruble previous week (9.1 percent)
Bitcoin (-18.1 percent) vs Bitcoin previous week (-10.4 percent)
Individual Market Charts:
US Dollar Index Futures:
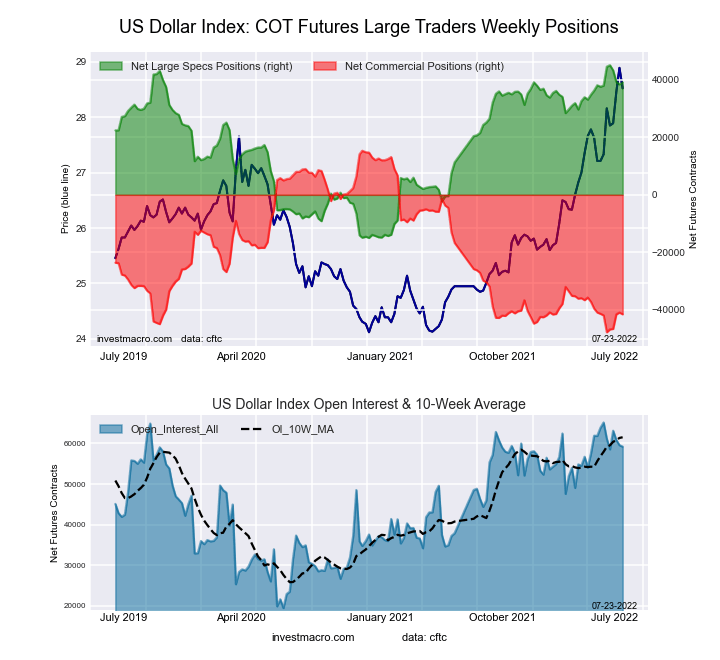 The US Dollar Index large speculator standing this week rose to a net position of 39,069 contracts in the data reported through Tuesday. This was a weekly advance by 715 contracts from the previous week which had a total of 38,354 net contracts.
This week’s current strength score (the trader positioning range over the past three years, measured from 0 to 100) shows the speculators are currently Bullish-Extreme with a score of 90.1 percent. The commercials are Bearish-Extreme with a score of 9.9 percent and the small traders (not shown in chart) are Bearish with a score of 43.1 percent.
| US DOLLAR INDEX Statistics | SPECULATORS | COMMERCIALS | SMALL TRADERS |
| – Percent of Open Interest Longs: | 84.8 | 4.9 | 8.6 |
| – Percent of Open Interest Shorts: | 18.9 | 74.9 | 4.5 |
| – Net Position: | 39,069 | -41,500 | 2,431 |
| – Gross Longs: | 50,234 | 2,873 | 5,069 |
| – Gross Shorts: | 11,165 | 44,373 | 2,638 |
| – Long to Short Ratio: | 4.5 to 1 | 0.1 to 1 | 1.9 to 1 |
| NET POSITION TREND: | |||
| – Strength Index Score (3 Year Range Pct): | 90.1 | 9.9 | 43.1 |
| – Strength Index Reading (3 Year Range): | Bullish-Extreme | Bearish-Extreme | Bearish |
| NET POSITION MOVEMENT INDEX: | |||
| – 6-Week Change in Strength Index: | 1.9 | 0.6 | -16.3 |
Euro Currency Futures:
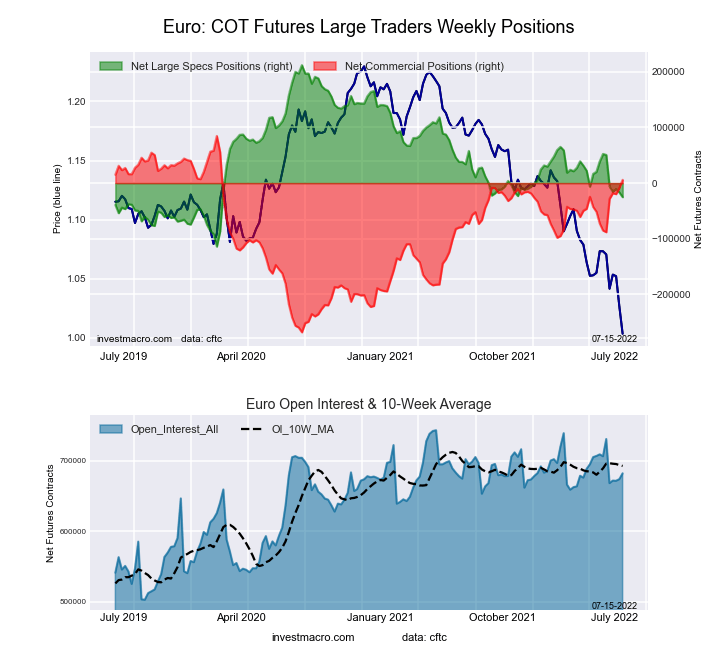
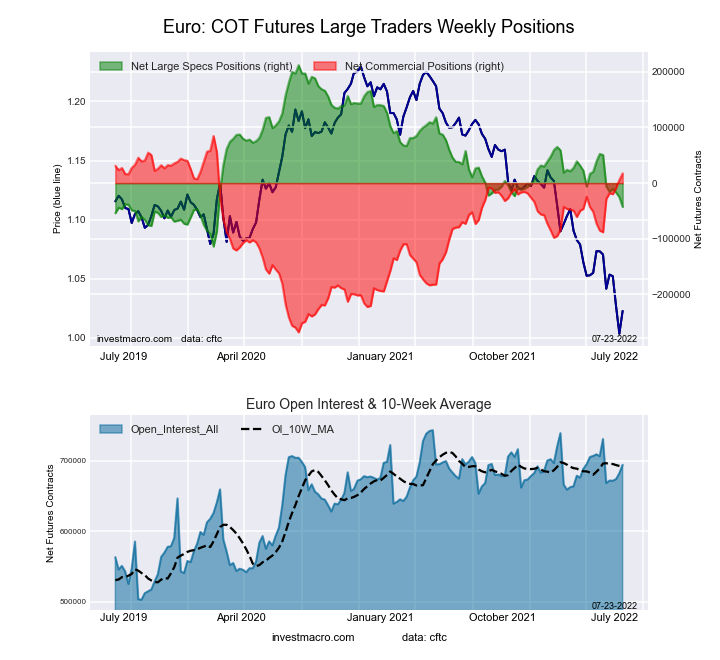 The Euro Currency large speculator standing this week was a net position of -42,745 contracts in the data reported through Tuesday. This was a sharp weekly drop of -17,501 contracts from the previous week which had a total of -25,244 net contracts.
The current strength score (the trader positioning range over the past three years, measured from 0 to 100) shows the speculators are currently Bearish with a score of 21.9 percent. The commercials are Bullish-Extreme with a score of 81.0 percent and the small traders (not shown in chart) are Bearish-Extreme with a score of 16.3 percent.
| EURO Currency Statistics | SPECULATORS | COMMERCIALS | SMALL TRADERS |
| – Percent of Open Interest Longs: | 28.2 | 57.3 | 11.9 |
| – Percent of Open Interest Shorts: | 34.4 | 54.8 | 8.3 |
| – Net Position: | -42,745 | 17,430 | 25,315 |
| – Gross Longs: | 195,875 | 397,991 | 82,676 |
| – Gross Shorts: | 238,620 | 380,561 | 57,361 |
| – Long to Short Ratio: | 0.8 to 1 | 1.0 to 1 | 1.4 to 1 |
| NET POSITION TREND: | |||
| – Strength Index Score (3 Year Range Pct): | 21.9 | 81.0 | 16.3 |
| – Strength Index Reading (3 Year Range): | Bearish | Bullish-Extreme | Bearish-Extreme |
| NET POSITION MOVEMENT INDEX: | |||
| – 6-Week Change in Strength Index: | -28.6 | 30.0 | -20.4 |
British Pound Sterling Futures:
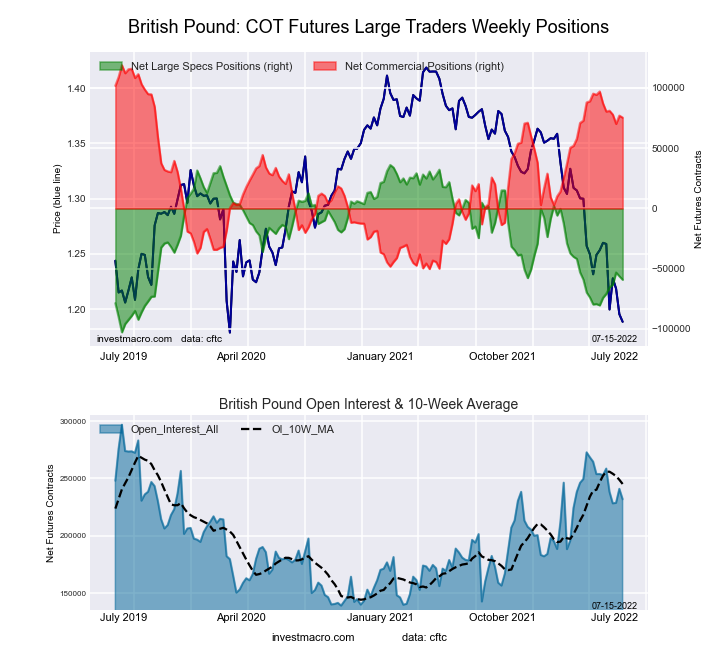
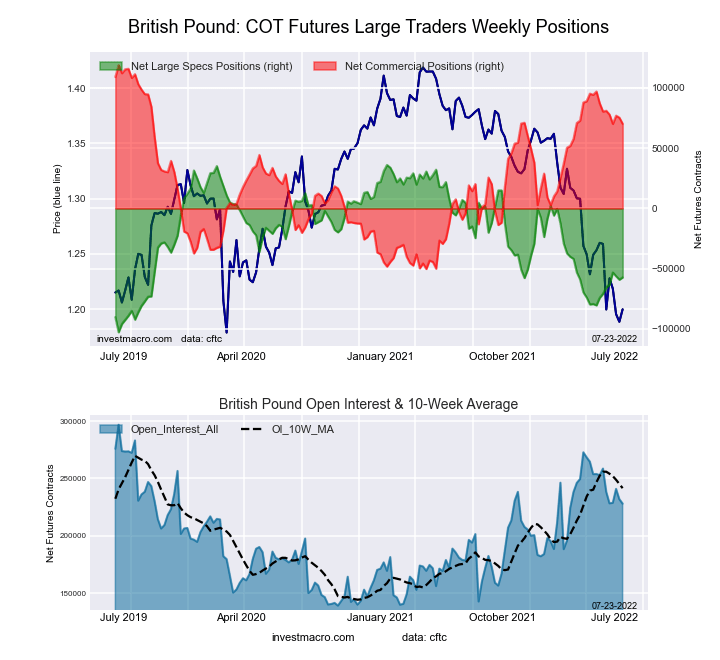 The British Pound Sterling large speculator standing this week totaled a net position of -57,250 contracts in the data reported through Tuesday. This was a weekly gain of 1,839 contracts from last week’s total of -59,089 net contracts.
This week’s current strength score (the trader positioning range over the past three years, measured from 0 to 100) shows the speculators are currently Bearish with a score of 32.8 percent. The commercials are Bullish with a score of 71.3 percent and the small traders (not shown in chart) are Bearish with a score of 28.6 percent.
| BRITISH POUND Statistics | SPECULATORS | COMMERCIALS | SMALL TRADERS |
| – Percent of Open Interest Longs: | 14.0 | 74.6 | 8.7 |
| – Percent of Open Interest Shorts: | 39.1 | 43.7 | 14.4 |
| – Net Position: | -57,250 | 70,299 | -13,049 |
| – Gross Longs: | 31,943 | 170,053 | 19,882 |
| – Gross Shorts: | 89,193 | 99,754 | 32,931 |
| – Long to Short Ratio: | 0.4 to 1 | 1.7 to 1 | 0.6 to 1 |
| NET POSITION TREND: | |||
| – Strength Index Score (3 Year Range Pct): | 32.8 | 71.3 | 28.6 |
| – Strength Index Reading (3 Year Range): | Bearish | Bullish | Bearish |
| NET POSITION MOVEMENT INDEX: | |||
| – 6-Week Change in Strength Index: | 9.8 | -6.0 | -7.0 |
Japanese Yen Futures:
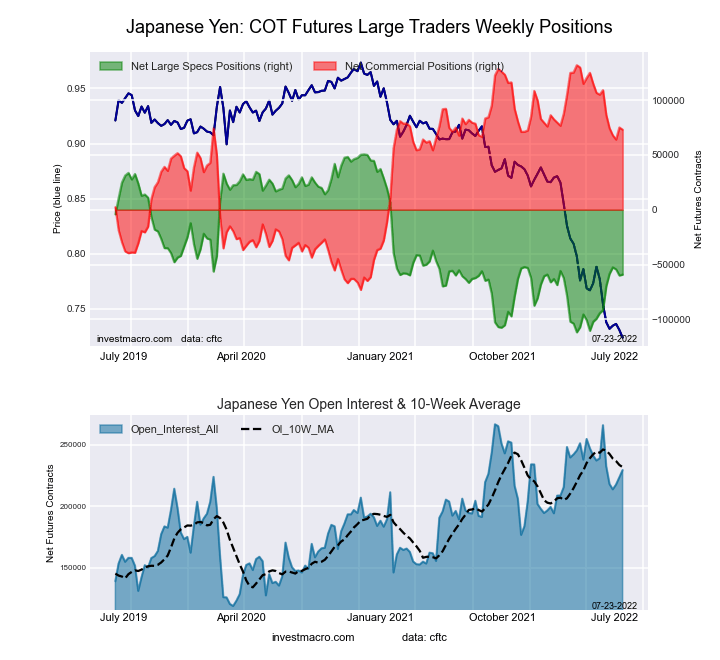 The Japanese Yen large speculator standing this week was a net position of -59,225 contracts in the data reported through Tuesday. This was a weekly rise of 773 contracts from the previous week which had a total of -59,998 net contracts.
The current strength score (the trader positioning range over the past three years, measured from 0 to 100) shows the speculators are currently Bearish with a score of 32.4 percent. The commercials are Bullish with a score of 71.3 percent and the small traders (not shown in chart) are Bearish with a score of 25.3 percent.
| JAPANESE YEN Statistics | SPECULATORS | COMMERCIALS | SMALL TRADERS |
| – Percent of Open Interest Longs: | 18.7 | 69.0 | 10.7 |
| – Percent of Open Interest Shorts: | 44.5 | 37.2 | 16.7 |
| – Net Position: | -59,225 | 73,082 | -13,857 |
| – Gross Longs: | 42,880 | 158,427 | 24,496 |
| – Gross Shorts: | 102,105 | 85,345 | 38,353 |
| – Long to Short Ratio: | 0.4 to 1 | 1.9 to 1 | 0.6 to 1 |
| NET POSITION TREND: | |||
| – Strength Index Score (3 Year Range Pct): | 32.4 | 71.3 | 25.3 |
| – Strength Index Reading (3 Year Range): | Bearish | Bullish | Bearish |
| NET POSITION MOVEMENT INDEX: | |||
| – 6-Week Change in Strength Index: | 20.0 | -17.6 | 7.3 |
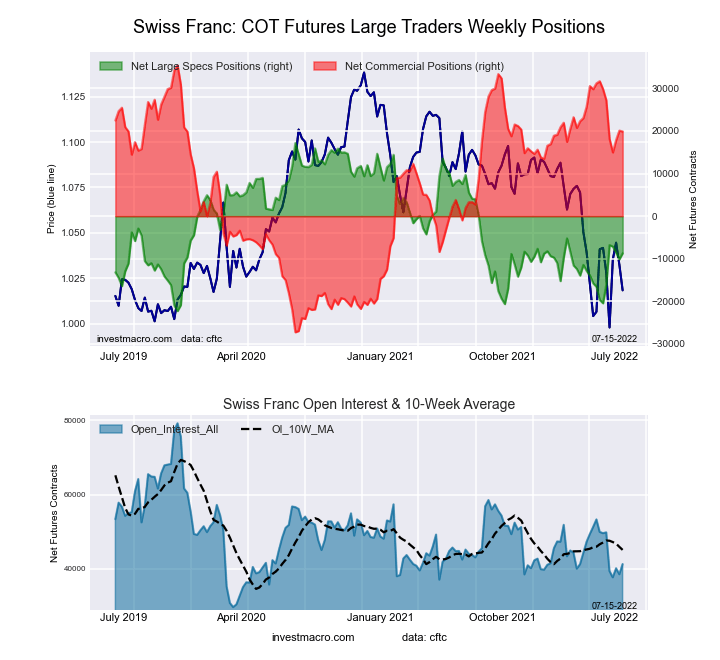
Swiss Franc Futures:

The Swiss Franc large speculator standing this week totaled a net position of -10,912 contracts in the data reported through Tuesday. This was a weekly decline of -2,188 contracts from the previous week which had a total of -8,724 net contracts.
This week’s current strength score (the trader positioning range over the past three years, measured from 0 to 100) shows the speculators are currently Bearish with a score of 28.8 percent. The commercials are Bullish with a score of 74.1 percent and the small traders (not shown in chart) are Bearish with a score of 29.5 percent.
| SWISS FRANC Statistics | SPECULATORS | COMMERCIALS | SMALL TRADERS |
| – Percent of Open Interest Longs: | 16.6 | 59.7 | 23.5 |
| – Percent of Open Interest Shorts: | 42.7 | 13.9 | 43.3 |
| – Net Position: | -10,912 | 19,205 | -8,293 |
| – Gross Longs: | 6,948 | 25,008 | 9,819 |
| – Gross Shorts: | 17,860 | 5,803 | 18,112 |
| – Long to Short Ratio: | 0.4 to 1 | 4.3 to 1 | 0.5 to 1 |
| NET POSITION TREND: | |||
| – Strength Index Score (3 Year Range Pct): | 28.8 | 74.1 | 29.5 |
| – Strength Index Reading (3 Year Range): | Bearish | Bullish | Bearish |
| NET POSITION MOVEMENT INDEX: | |||
| – 6-Week Change in Strength Index: | 13.2 | -12.8 | 9.5 |
Canadian Dollar Futures:
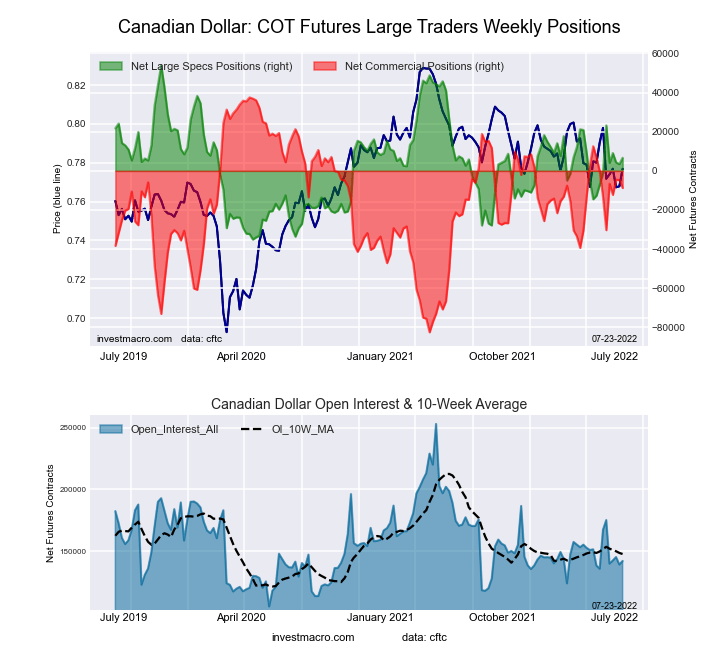 The Canadian Dollar large speculator standing this week was a net position of 6,667 contracts in the data reported through Tuesday. This was a weekly gain of 3,162 contracts from the previous week which had a total of 3,505 net contracts.
This week’s current strength score (the trader positioning range over the past three years, measured from 0 to 100) shows the speculators are currently Bearish with a score of 46.8 percent. The commercials are Bullish with a score of 61.4 percent and the small traders (not shown in chart) are Bearish with a score of 34.3 percent.
| CANADIAN DOLLAR Statistics | SPECULATORS | COMMERCIALS | SMALL TRADERS |
| – Percent of Open Interest Longs: | 29.6 | 47.1 | 22.1 |
| – Percent of Open Interest Shorts: | 24.9 | 53.3 | 20.6 |
| – Net Position: | 6,667 | -8,746 | 2,079 |
| – Gross Longs: | 42,040 | 67,038 | 31,391 |
| – Gross Shorts: | 35,373 | 75,784 | 29,312 |
| – Long to Short Ratio: | 1.2 to 1 | 0.9 to 1 | 1.1 to 1 |
| NET POSITION TREND: | |||
| – Strength Index Score (3 Year Range Pct): | 46.8 | 61.4 | 34.3 |
| – Strength Index Reading (3 Year Range): | Bearish | Bullish | Bearish |
| NET POSITION MOVEMENT INDEX: | |||
| – 6-Week Change in Strength Index: | 8.7 | 3.9 | -24.9 |
Australian Dollar Futures:
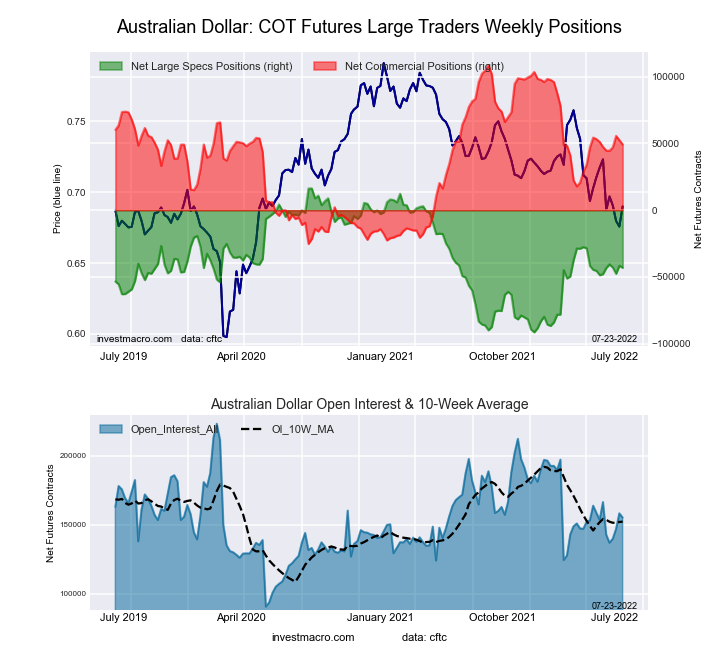 The Australian Dollar large speculator standing this week was a net position of -43,148 contracts in the data reported through Tuesday. This was a weekly lowering of -1,548 contracts from the previous week which had a total of -41,600 net contracts.
This week’s current strength score (the trader positioning range over the past three years, measured from 0 to 100) shows the speculators are currently Bearish with a score of 44.8 percent. The commercials are Bullish with a score of 55.6 percent and the small traders (not shown in chart) are Bearish with a score of 37.5 percent.
| AUSTRALIAN DOLLAR Statistics | SPECULATORS | COMMERCIALS | SMALL TRADERS |
| – Percent of Open Interest Longs: | 19.7 | 66.0 | 11.2 |
| – Percent of Open Interest Shorts: | 47.5 | 34.3 | 15.2 |
| – Net Position: | -43,148 | 49,276 | -6,128 |
| – Gross Longs: | 30,578 | 102,518 | 17,420 |
| – Gross Shorts: | 73,726 | 53,242 | 23,548 |
| – Long to Short Ratio: | 0.4 to 1 | 1.9 to 1 | 0.7 to 1 |
| NET POSITION TREND: | |||
| – Strength Index Score (3 Year Range Pct): | 44.8 | 55.6 | 37.5 |
| – Strength Index Reading (3 Year Range): | Bearish | Bullish | Bearish |
| NET POSITION MOVEMENT INDEX: | |||
| – 6-Week Change in Strength Index: | 4.4 | 1.4 | -16.1 |
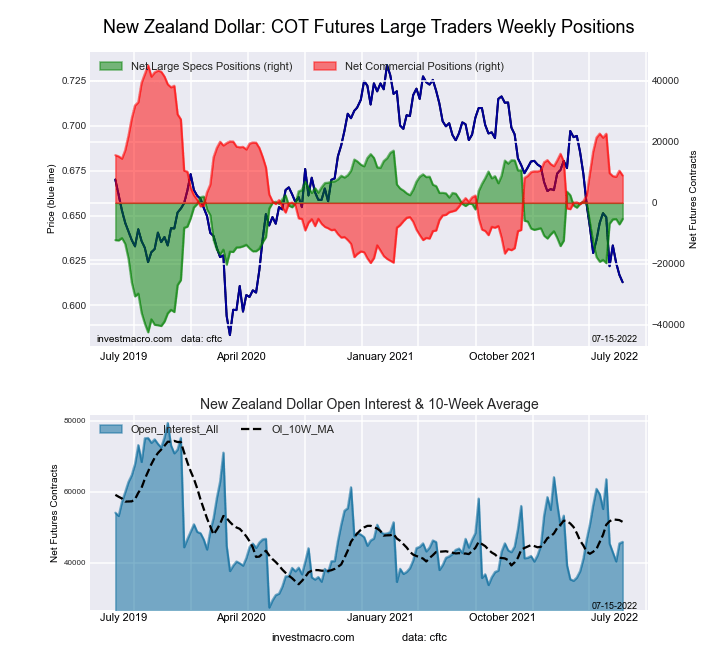
New Zealand Dollar Futures:
 The New Zealand Dollar large speculator standing this week was a net position of -3,671 contracts in the data reported through Tuesday. This was a weekly increase of 1,612 contracts from the previous week which had a total of -5,283 net contracts.
This week’s current strength score (the trader positioning range over the past three years, measured from 0 to 100) shows the speculators are currently Bullish with a score of 65.1 percent. The commercials are Bearish with a score of 41.5 percent and the small traders (not shown in chart) are Bearish-Extreme with a score of 10.8 percent.
| NEW ZEALAND DOLLAR Statistics | SPECULATORS | COMMERCIALS | SMALL TRADERS |
| – Percent of Open Interest Longs: | 34.7 | 59.2 | 5.4 |
| – Percent of Open Interest Shorts: | 42.8 | 43.3 | 13.2 |
| – Net Position: | -3,671 | 7,227 | -3,556 |
| – Gross Longs: | 15,791 | 26,905 | 2,444 |
| – Gross Shorts: | 19,462 | 19,678 | 6,000 |
| – Long to Short Ratio: | 0.8 to 1 | 1.4 to 1 | 0.4 to 1 |
| NET POSITION TREND: | |||
| – Strength Index Score (3 Year Range Pct): | 65.1 | 41.5 | 10.8 |
| – Strength Index Reading (3 Year Range): | Bullish | Bearish | Bearish-Extreme |
| NET POSITION MOVEMENT INDEX: | |||
| – 6-Week Change in Strength Index: | 27.0 | -23.8 | -7.4 |
Mexican Peso Futures:
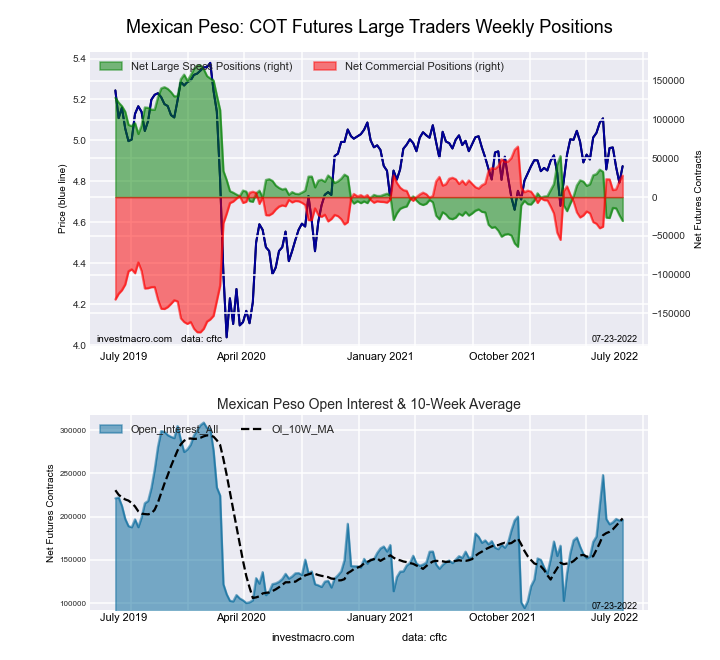 The Mexican Peso large speculator standing this week was a net position of -30,760 contracts in the data reported through Tuesday. This was a weekly decrease of -7,522 contracts from the previous week which had a total of -23,238 net contracts.
The current strength score (the trader positioning range over the past three years, measured from 0 to 100) shows the speculators are currently Bearish-Extreme with a score of 14.2 percent. The commercials are Bullish-Extreme with a score of 84.4 percent and the small traders (not shown in chart) are Bullish with a score of 55.2 percent.
| MEXICAN PESO Statistics | SPECULATORS | COMMERCIALS | SMALL TRADERS |
| – Percent of Open Interest Longs: | 50.0 | 46.6 | 3.0 |
| – Percent of Open Interest Shorts: | 65.6 | 32.4 | 1.6 |
| – Net Position: | -30,760 | 27,890 | 2,870 |
| – Gross Longs: | 97,965 | 91,458 | 5,972 |
| – Gross Shorts: | 128,725 | 63,568 | 3,102 |
| – Long to Short Ratio: | 0.8 to 1 | 1.4 to 1 | 1.9 to 1 |
| NET POSITION TREND: | |||
| – Strength Index Score (3 Year Range Pct): | 14.2 | 84.4 | 55.2 |
| – Strength Index Reading (3 Year Range): | Bearish-Extreme | Bullish-Extreme | Bullish |
| NET POSITION MOVEMENT INDEX: | |||
| – 6-Week Change in Strength Index: | -27.1 | 27.5 | -10.7 |
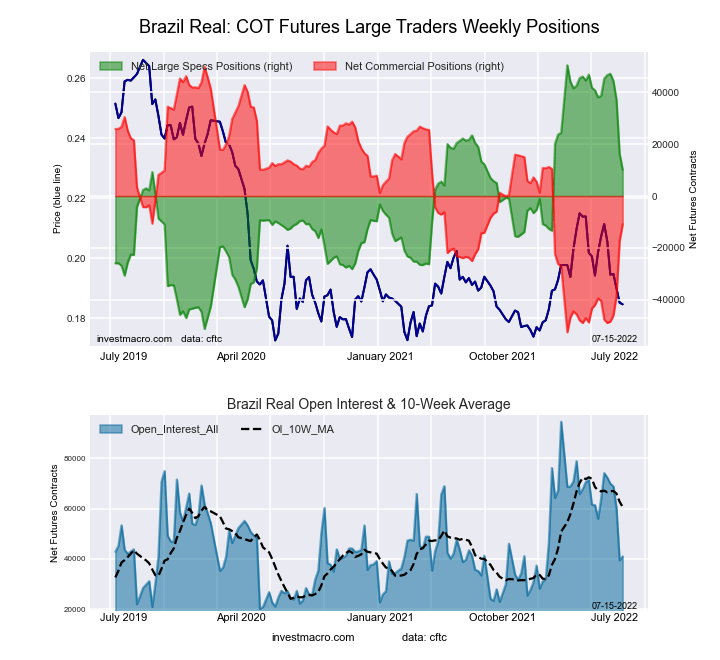
Brazilian Real Futures:
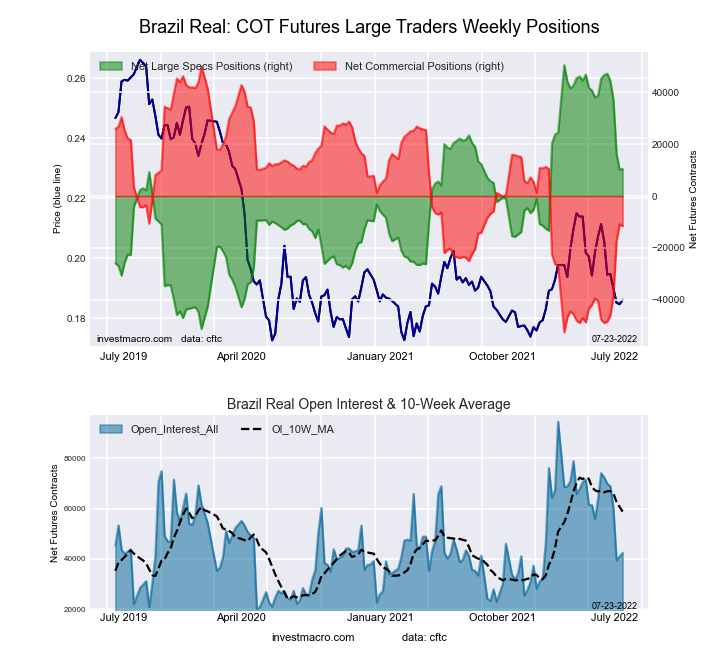 The Brazilian Real large speculator standing this week reached a net position of 10,475 contracts in the data reported through Tuesday. This was a weekly advance of 270 contracts from the previous week which had a total of 10,205 net contracts.
The current strength score (the trader positioning range over the past three years, measured from 0 to 100) shows the speculators are currently Bullish with a score of 60.7 percent. The commercials are Bearish with a score of 40.0 percent and the small traders (not shown in chart) are Bullish with a score of 77.7 percent.
| BRAZIL REAL Statistics | SPECULATORS | COMMERCIALS | SMALL TRADERS |
| – Percent of Open Interest Longs: | 48.5 | 43.7 | 7.3 |
| – Percent of Open Interest Shorts: | 23.9 | 71.0 | 4.7 |
| – Net Position: | 10,475 | -11,580 | 1,105 |
| – Gross Longs: | 20,600 | 18,569 | 3,092 |
| – Gross Shorts: | 10,125 | 30,149 | 1,987 |
| – Long to Short Ratio: | 2.0 to 1 | 0.6 to 1 | 1.6 to 1 |
| NET POSITION TREND: | |||
| – Strength Index Score (3 Year Range Pct): | 60.7 | 40.0 | 77.7 |
| – Strength Index Reading (3 Year Range): | Bullish | Bearish | Bullish |
| NET POSITION MOVEMENT INDEX: | |||
| – 6-Week Change in Strength Index: | -35.6 | 36.5 | -13.4 |
Bitcoin Futures:
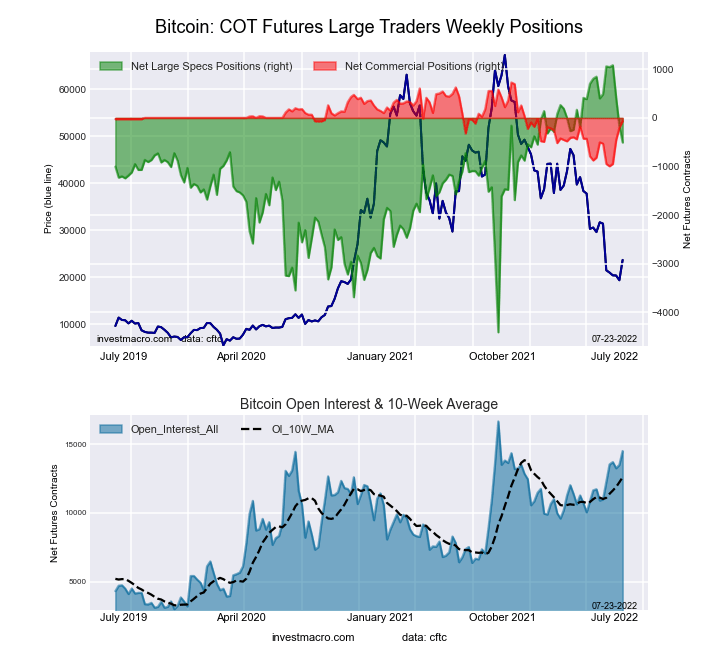 The Bitcoin large speculator standing this week was a net position of -506 contracts in the data reported through Tuesday. This was a weekly decline of -335 contracts from the previous week which had a total of -171 net contracts.
The current strength score (the trader positioning range over the past three years, measured from 0 to 100) shows the speculators are currently Bullish with a score of 71.1 percent. The commercials are Bullish with a score of 53.9 percent and the small traders (not shown in chart) are Bearish with a score of 25.9 percent.
| BITCOIN Statistics | SPECULATORS | COMMERCIALS | SMALL TRADERS |
| – Percent of Open Interest Longs: | 75.2 | 3.5 | 9.4 |
| – Percent of Open Interest Shorts: | 78.7 | 4.0 | 5.4 |
| – Net Position: | -506 | -66 | 572 |
| – Gross Longs: | 10,909 | 514 | 1,360 |
| – Gross Shorts: | 11,415 | 580 | 788 |
| – Long to Short Ratio: | 1.0 to 1 | 0.9 to 1 | 1.7 to 1 |
| NET POSITION TREND: | |||
| – Strength Index Score (3 Year Range Pct): | 71.1 | 53.9 | 25.9 |
| – Strength Index Reading (3 Year Range): | Bullish | Bullish | Bearish |
| NET POSITION MOVEMENT INDEX: | |||
| – 6-Week Change in Strength Index: | -18.1 | 26.9 | 12.1 |
Article By InvestMacro – Receive our weekly COT Reports by Email
*COT Report: The COT data, released weekly to the public each Friday, is updated through the most recent Tuesday (data is 3 days old) and shows a quick view of how large speculators or non-commercials (for-profit traders) were positioned in the futures markets.
The CFTC categorizes trader positions according to commercial hedgers (traders who use futures contracts for hedging as part of the business), non-commercials (large traders who speculate to realize trading profits) and nonreportable traders (usually small traders/speculators) as well as their open interest (contracts open in the market at time of reporting).See CFTC criteria here.


