
By InvestMacro | COT | Data Tables | COT Leaders | Downloads | COT Newsletter
Here are the latest charts and statistics for the Commitment of Traders (COT) data published by the Commodities Futures Trading Commission (CFTC).
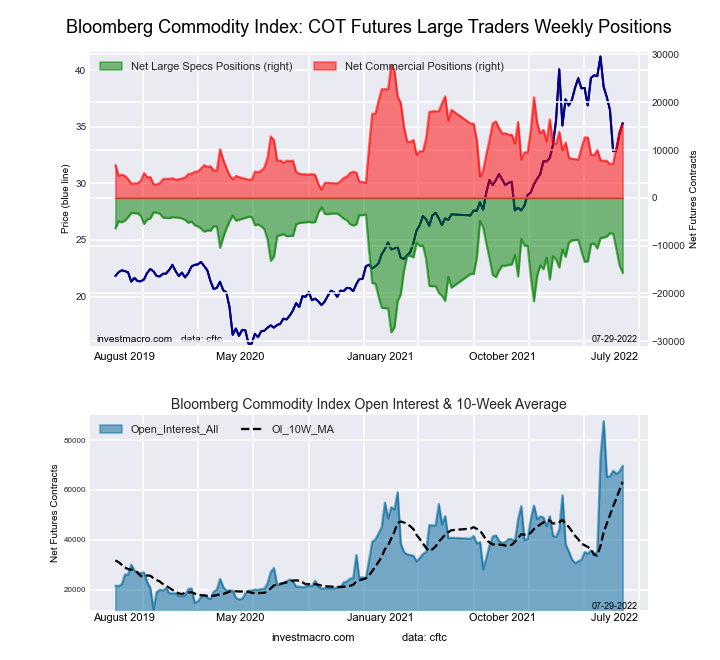
The latest COT data is updated through Tuesday August 2nd and shows a quick view of how large traders (for-profit speculators and commercial entities) were positioned in the futures markets.
Weekly Speculator Changes: COT Week 31
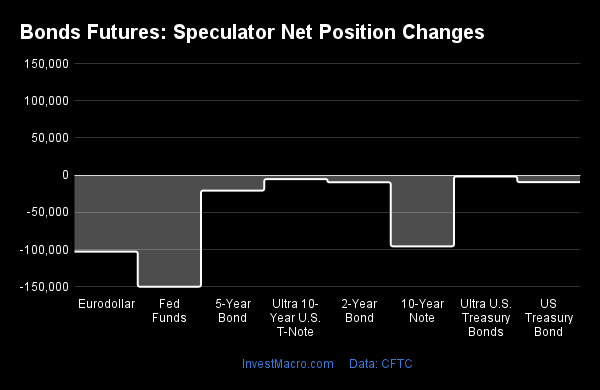
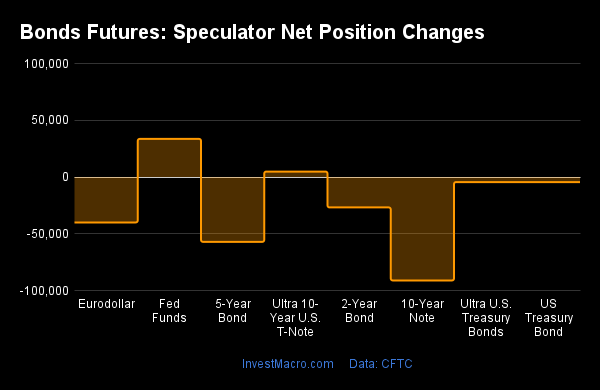
COT bond market speculator bets were overall lower this week as all eight of the bond markets we cover recorded declining speculative bets on the week.
The bond markets leading the declines in speculator positions were the Fed Funds (-149,893 contracts) and the Eurodollar (-102,744 contracts) with the 10-Year Bond (-95,630 contracts), the 5-Year Bond (-20,772 contracts), the 2-Year Bond (-9,604 contracts), the Long US Bond (-9,408 contracts), the Ultra 10-Year (-5,365 contracts) and the Ultra US Bond (-1,854 contracts) also registering lower bets on the week.
| Aug-02-2022 | OI | OI-Index | Spec-Net | Spec-Index | Com-Net | COM-Index | Smalls-Net | Smalls-Index |
|---|---|---|---|---|---|---|---|---|
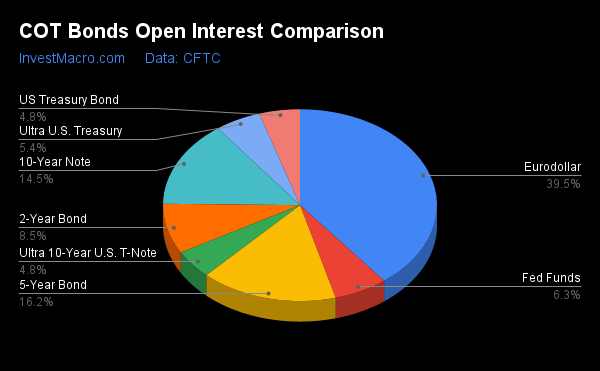
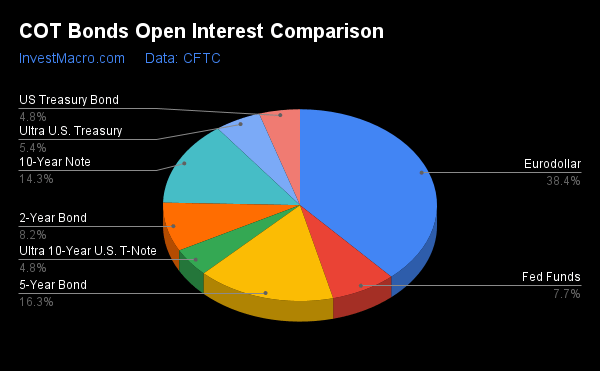
| Eurodollar | 9,609,609 | 15 | -2,786,683 | 2 | 3,137,692 | 97 | -351,009 | 27 |
| FedFunds | 1,540,437 | 44 | -2,725 | 39 | 14,197 | 62 | -11,472 | 31 |
| 2-Year | 2,058,442 | 12 | -99,468 | 62 | 182,725 | 60 | -83,257 | 14 |
| Long T-Bond | 1,172,815 | 40 | -56,053 | 66 | 43,323 | 26 | 12,730 | 63 |
| 10-Year | 3,540,076 | 32 | -295,490 | 28 | 382,617 | 67 | -87,127 | 59 |
| 5-Year | 3,935,263 | 48 | -335,945 | 24 | 430,656 | 66 | -94,711 | 55 |
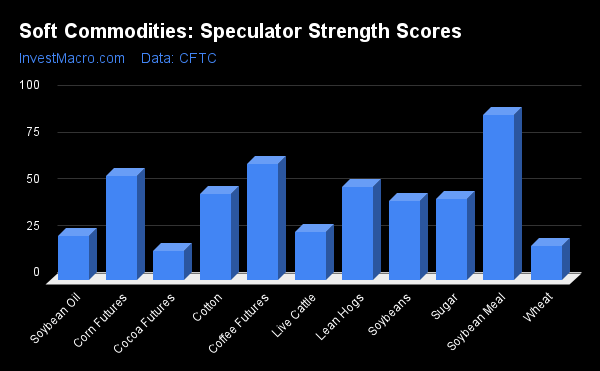
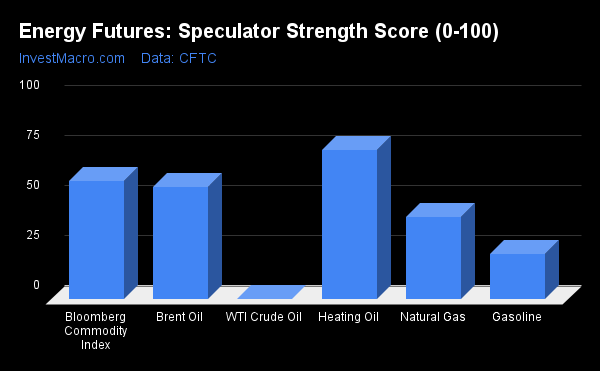
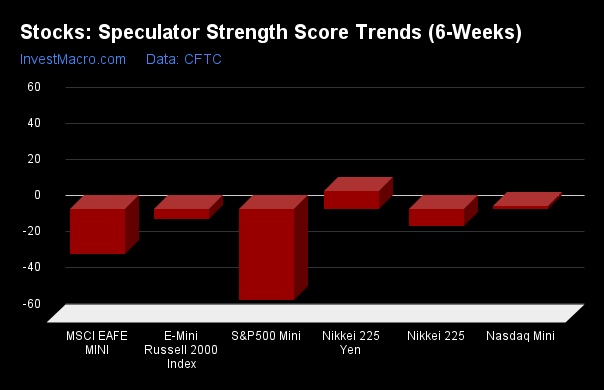
Strength Scores
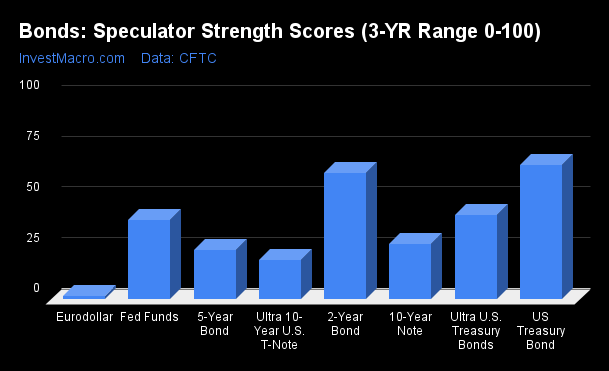
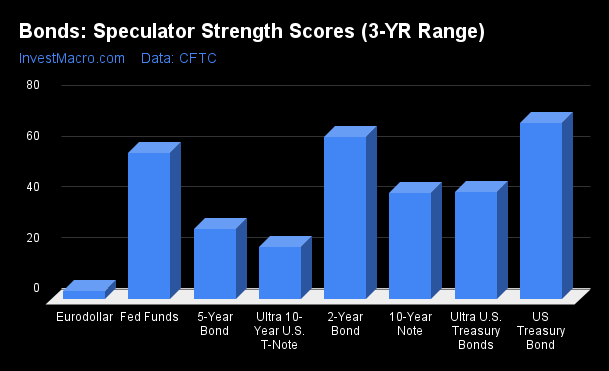
Strength Scores (a normalized measure of Speculator positions over a 3-Year range, from 0 to 100 where above 80 is extreme bullish and below 20 is extreme bearish) showed that the US Treasury Bond (66.3 percent) and the 2-Year Bond (62.2 percent) lead the bonds markets strength positions and are the only two markets above their midpoint positions (above 50 percent) over the past three-year range.
On the downside, the Eurodollar (1.6 percent) comes in at the lowest strength level currently and is joined in an extreme bearish level (below 20 percent) by the Ultra 10-Year Bond (19.4 percent). The 5-Year Bond (24.3 percent), the 10-Year Bond (27.5 percent) and the Fed Funds (39.3 percent) come in as the next lowest strength scores this week.
Strength Statistics:
Fed Funds (39.3 percent) vs Fed Funds previous week (57.8 percent)
2-Year Bond (62.2 percent) vs 2-Year Bond previous week (64.1 percent)
5-Year Bond (24.3 percent) vs 5-Year Bond previous week (27.9 percent)
10-Year Bond (27.5 percent) vs 10-Year Bond previous week (42.1 percent)
Ultra 10-Year Bond (19.4 percent) vs Ultra 10-Year Bond previous week (20.8 percent)
US Treasury Bond (66.3 percent) vs US Treasury Bond previous week (69.4 percent)
Ultra US Treasury Bond (41.6 percent) vs Ultra US Treasury Bond previous week (42.3 percent)
Eurodollar (1.6 percent) vs Eurodollar previous week (3.5 percent)
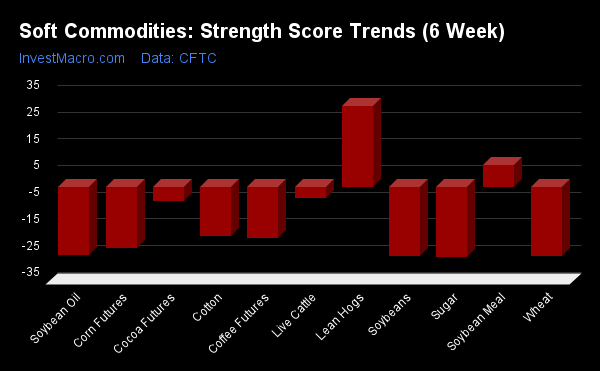
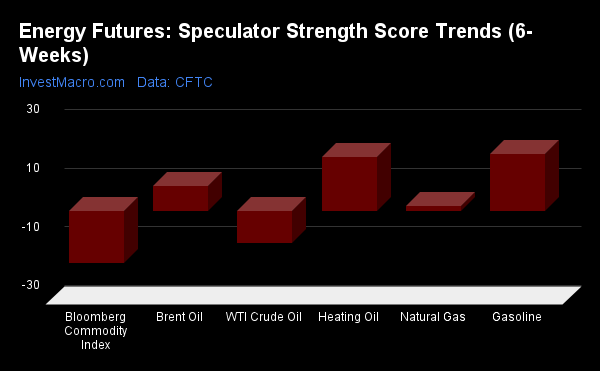
Strength Trends
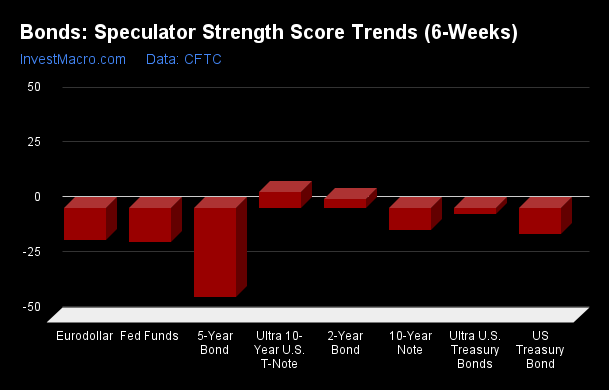
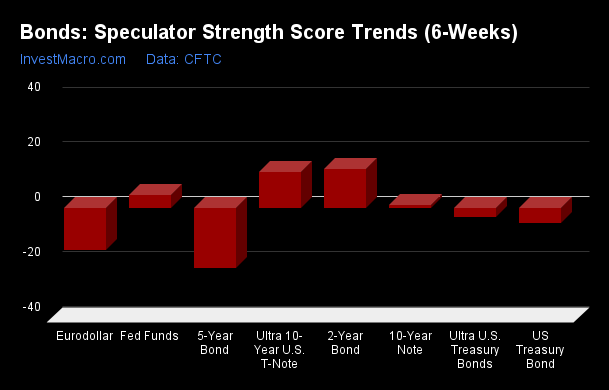
Strength Score Trends (or move index, calculates the 6-week changes in strength scores) showed that the Ultra 10-Year Bond (7.1 percent) leads the past six weeks trends for bonds this week. The 2-Year Bond (4.0 percent) is the only other positive mover in the latest trends data. The 5-Year Bond (-40.7 percent) leads the downside trend scores currently while the next markets with lower trend scores were the Fed Funds (-15.7 percent), the Eurodollar (-14.6 percent) and the US Treasury Bond (-12.0 percent).
Strength Trend Statistics:
Fed Funds (-15.7 percent) vs Fed Funds previous week (4.5 percent)
2-Year Bond (4.0 percent) vs 2-Year Bond previous week (14.2 percent)
5-Year Bond (-40.7 percent) vs 5-Year Bond previous week (-21.8 percent)
10-Year Bond (-10.2 percent) vs 10-Year Bond previous week (0.9 percent)
Ultra 10-Year Bond (7.1 percent) vs Ultra 10-Year Bond previous week (13.1 percent)
US Treasury Bond (-12.0 percent) vs US Treasury Bond previous week (-5.6 percent)
Ultra US Treasury Bond (-2.9 percent) vs Ultra US Treasury Bond previous week (-3.5 percent)
Eurodollar (-14.6 percent) vs Eurodollar (-15.3 percent)
Individual Markets:
3-Month Eurodollars Futures:
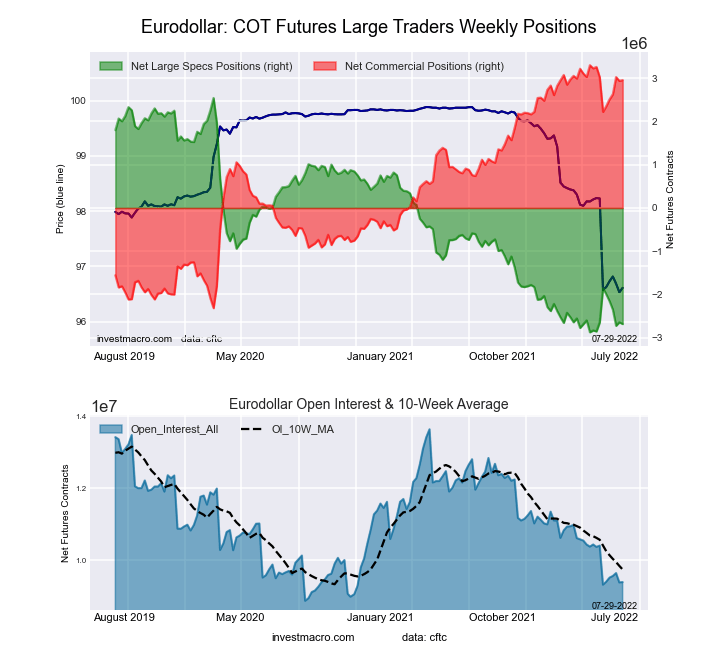
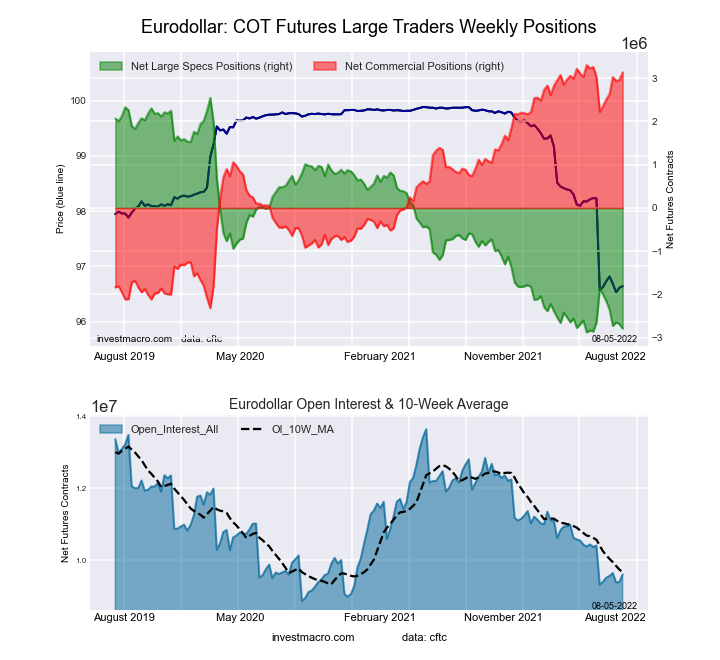 The 3-Month Eurodollars large speculator standing this week totaled a net position of -2,786,683 contracts in the data reported through Tuesday. This was a weekly lowering of -102,744 contracts from the previous week which had a total of -2,683,939 net contracts.
This week’s current strength score (the trader positioning range over the past three years, measured from 0 to 100) shows the speculators are currently Bearish-Extreme with a score of 1.6 percent. The commercials are Bullish-Extreme with a score of 97.1 percent and the small traders (not shown in chart) are Bearish with a score of 27.2 percent.
| 3-Month Eurodollars Statistics | SPECULATORS | COMMERCIALS | SMALL TRADERS |
| – Percent of Open Interest Longs: | 4.1 | 72.0 | 4.1 |
| – Percent of Open Interest Shorts: | 33.1 | 39.3 | 7.7 |
| – Net Position: | -2,786,683 | 3,137,692 | -351,009 |
| – Gross Longs: | 391,755 | 6,915,941 | 392,620 |
| – Gross Shorts: | 3,178,438 | 3,778,249 | 743,629 |
| – Long to Short Ratio: | 0.1 to 1 | 1.8 to 1 | 0.5 to 1 |
| NET POSITION TREND: | |||
| – Strength Index Score (3 Year Range Pct): | 1.6 | 97.1 | 27.2 |
| – Strength Index Reading (3 Year Range): | Bearish-Extreme | Bullish-Extreme | Bearish |
| NET POSITION MOVEMENT INDEX: | |||
| – 6-Week Change in Strength Index: | -14.6 | 13.9 | 1.4 |
30-Day Federal Funds Futures:
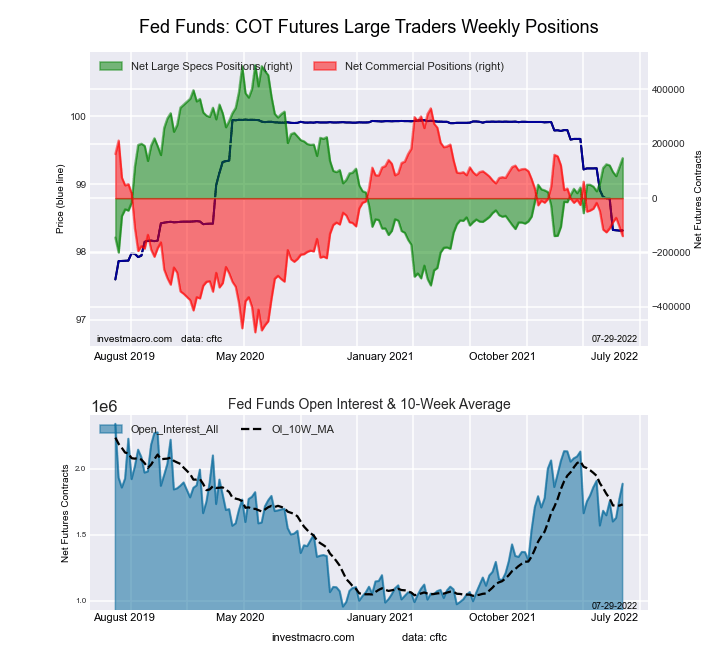
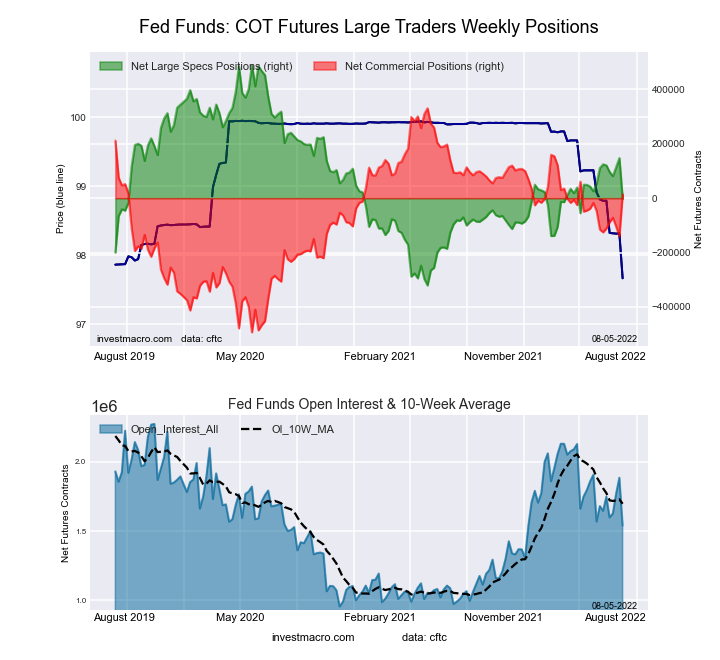 The 30-Day Federal Funds large speculator standing this week totaled a net position of -2,725 contracts in the data reported through Tuesday. This was a weekly fall of -149,893 contracts from the previous week which had a total of 147,168 net contracts.
This week’s current strength score (the trader positioning range over the past three years, measured from 0 to 100) shows the speculators are currently Bearish with a score of 39.3 percent. The commercials are Bullish with a score of 61.6 percent and the small traders (not shown in chart) are Bearish with a score of 30.5 percent.
| 30-Day Federal Funds Statistics | SPECULATORS | COMMERCIALS | SMALL TRADERS |
| – Percent of Open Interest Longs: | 10.0 | 75.3 | 2.2 |
| – Percent of Open Interest Shorts: | 10.2 | 74.3 | 2.9 |
| – Net Position: | -2,725 | 14,197 | -11,472 |
| – Gross Longs: | 153,948 | 1,159,508 | 33,605 |
| – Gross Shorts: | 156,673 | 1,145,311 | 45,077 |
| – Long to Short Ratio: | 1.0 to 1 | 1.0 to 1 | 0.7 to 1 |
| NET POSITION TREND: | |||
| – Strength Index Score (3 Year Range Pct): | 39.3 | 61.6 | 30.5 |
| – Strength Index Reading (3 Year Range): | Bearish | Bullish | Bearish |
| NET POSITION MOVEMENT INDEX: | |||
| – 6-Week Change in Strength Index: | -15.7 | 17.0 | -31.8 |
2-Year Treasury Note Futures:
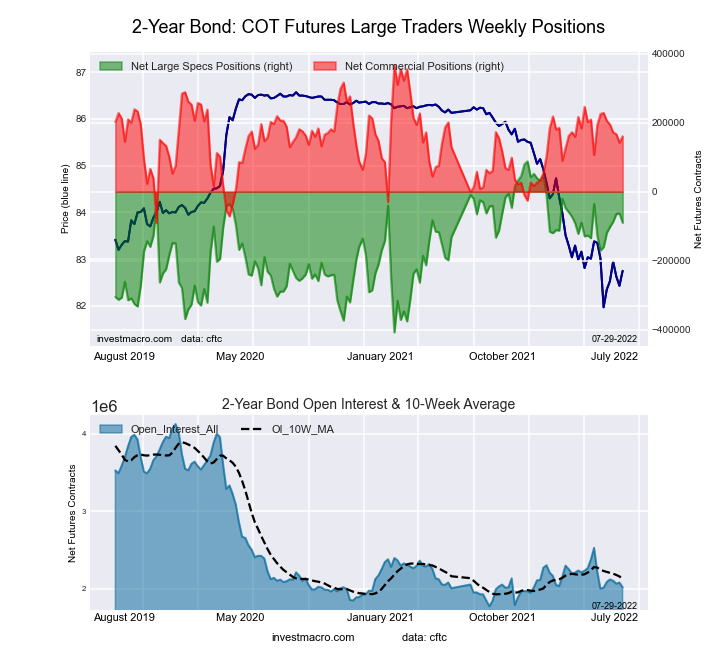
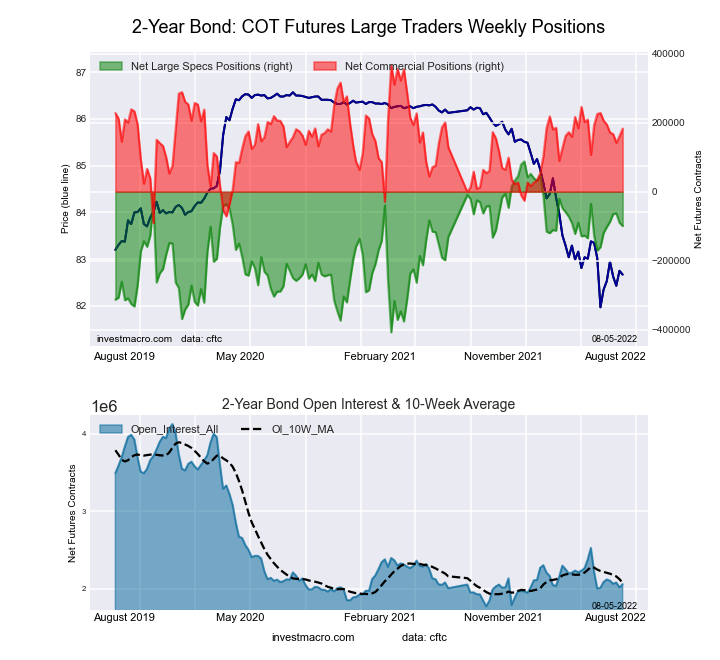 The 2-Year Treasury Note large speculator standing this week totaled a net position of -99,468 contracts in the data reported through Tuesday. This was a weekly lowering of -9,604 contracts from the previous week which had a total of -89,864 net contracts.
This week’s current strength score (the trader positioning range over the past three years, measured from 0 to 100) shows the speculators are currently Bullish with a score of 62.2 percent. The commercials are Bullish with a score of 59.8 percent and the small traders (not shown in chart) are Bearish-Extreme with a score of 13.9 percent.
| 2-Year Treasury Note Statistics | SPECULATORS | COMMERCIALS | SMALL TRADERS |
| – Percent of Open Interest Longs: | 11.5 | 79.9 | 7.0 |
| – Percent of Open Interest Shorts: | 16.3 | 71.0 | 11.1 |
| – Net Position: | -99,468 | 182,725 | -83,257 |
| – Gross Longs: | 236,803 | 1,644,805 | 144,664 |
| – Gross Shorts: | 336,271 | 1,462,080 | 227,921 |
| – Long to Short Ratio: | 0.7 to 1 | 1.1 to 1 | 0.6 to 1 |
| NET POSITION TREND: | |||
| – Strength Index Score (3 Year Range Pct): | 62.2 | 59.8 | 13.9 |
| – Strength Index Reading (3 Year Range): | Bullish | Bullish | Bearish-Extreme |
| NET POSITION MOVEMENT INDEX: | |||
| – 6-Week Change in Strength Index: | 4.0 | -5.0 | 1.3 |
5-Year Treasury Note Futures:
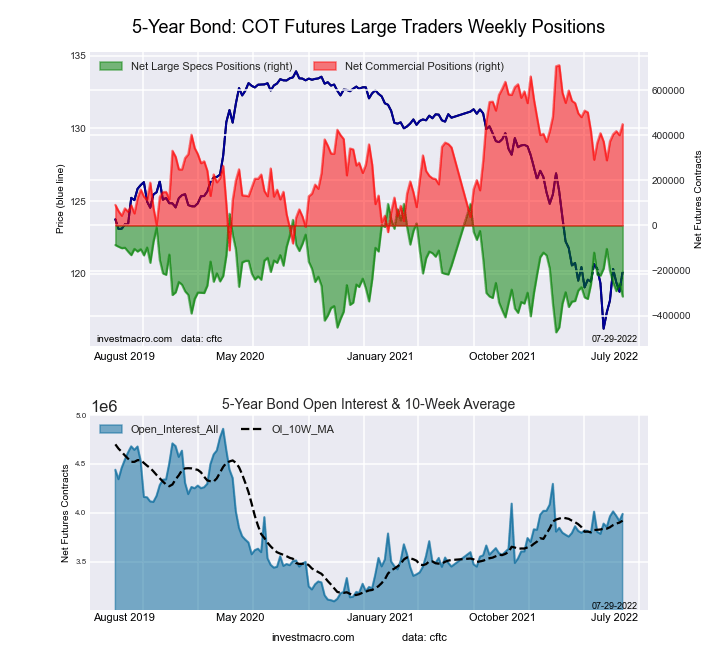
 The 5-Year Treasury Note large speculator standing this week totaled a net position of -335,945 contracts in the data reported through Tuesday. This was a weekly lowering of -20,772 contracts from the previous week which had a total of -315,173 net contracts.
This week’s current strength score (the trader positioning range over the past three years, measured from 0 to 100) shows the speculators are currently Bearish with a score of 24.3 percent. The commercials are Bullish with a score of 65.8 percent and the small traders (not shown in chart) are Bullish with a score of 54.9 percent.
| 5-Year Treasury Note Statistics | SPECULATORS | COMMERCIALS | SMALL TRADERS |
| – Percent of Open Interest Longs: | 8.3 | 82.1 | 8.1 |
| – Percent of Open Interest Shorts: | 16.9 | 71.2 | 10.5 |
| – Net Position: | -335,945 | 430,656 | -94,711 |
| – Gross Longs: | 327,896 | 3,232,238 | 317,840 |
| – Gross Shorts: | 663,841 | 2,801,582 | 412,551 |
| – Long to Short Ratio: | 0.5 to 1 | 1.2 to 1 | 0.8 to 1 |
| NET POSITION TREND: | |||
| – Strength Index Score (3 Year Range Pct): | 24.3 | 65.8 | 54.9 |
| – Strength Index Reading (3 Year Range): | Bearish | Bullish | Bullish |
| NET POSITION MOVEMENT INDEX: | |||
| – 6-Week Change in Strength Index: | -40.7 | 17.2 | 24.8 |
10-Year Treasury Note Futures:
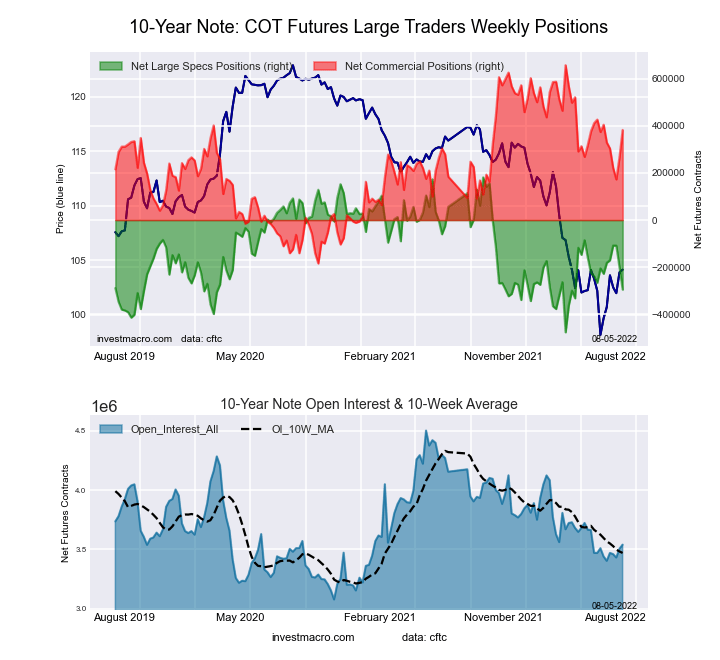 The 10-Year Treasury Note large speculator standing this week totaled a net position of -295,490 contracts in the data reported through Tuesday. This was a weekly decrease of -95,630 contracts from the previous week which had a total of -199,860 net contracts.
This week’s current strength score (the trader positioning range over the past three years, measured from 0 to 100) shows the speculators are currently Bearish with a score of 27.5 percent. The commercials are Bullish with a score of 67.3 percent and the small traders (not shown in chart) are Bullish with a score of 58.9 percent.
| 10-Year Treasury Note Statistics | SPECULATORS | COMMERCIALS | SMALL TRADERS |
| – Percent of Open Interest Longs: | 6.8 | 80.5 | 9.9 |
| – Percent of Open Interest Shorts: | 15.1 | 69.6 | 12.4 |
| – Net Position: | -295,490 | 382,617 | -87,127 |
| – Gross Longs: | 239,438 | 2,848,101 | 351,703 |
| – Gross Shorts: | 534,928 | 2,465,484 | 438,830 |
| – Long to Short Ratio: | 0.4 to 1 | 1.2 to 1 | 0.8 to 1 |
| NET POSITION TREND: | |||
| – Strength Index Score (3 Year Range Pct): | 27.5 | 67.3 | 58.9 |
| – Strength Index Reading (3 Year Range): | Bearish | Bullish | Bullish |
| NET POSITION MOVEMENT INDEX: | |||
| – 6-Week Change in Strength Index: | -10.2 | -2.6 | 21.0 |
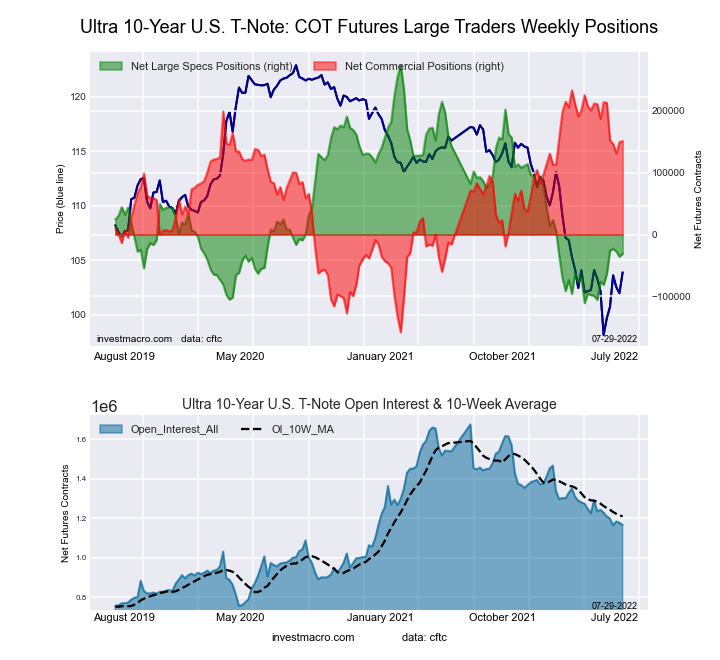
Ultra 10-Year Notes Futures:
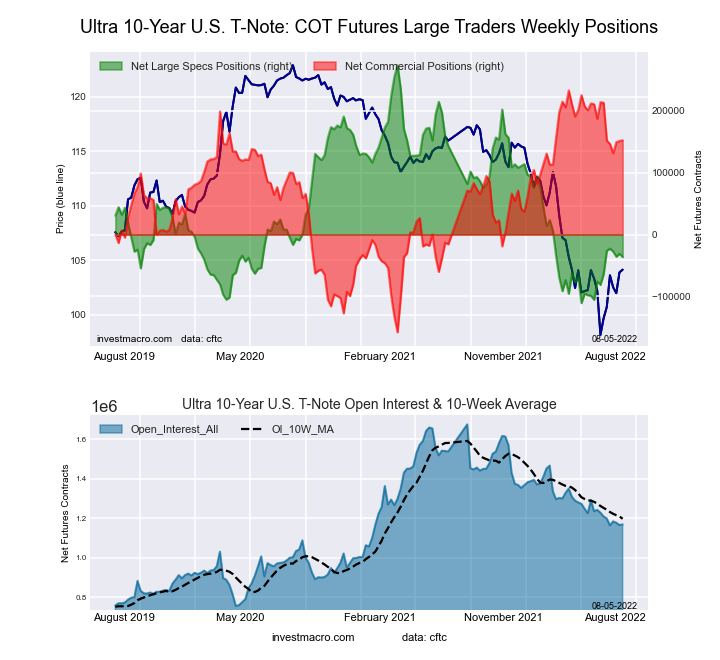 The Ultra 10-Year Notes large speculator standing this week totaled a net position of -36,291 contracts in the data reported through Tuesday. This was a weekly reduction of -5,365 contracts from the previous week which had a total of -30,926 net contracts.
This week’s current strength score (the trader positioning range over the past three years, measured from 0 to 100) shows the speculators are currently Bearish-Extreme with a score of 19.4 percent. The commercials are Bullish with a score of 79.4 percent and the small traders (not shown in chart) are Bearish with a score of 49.7 percent.
| Ultra 10-Year Notes Statistics | SPECULATORS | COMMERCIALS | SMALL TRADERS |
| – Percent of Open Interest Longs: | 4.7 | 82.7 | 11.7 |
| – Percent of Open Interest Shorts: | 7.8 | 69.6 | 21.6 |
| – Net Position: | -36,291 | 152,427 | -116,136 |
| – Gross Longs: | 54,793 | 966,321 | 136,755 |
| – Gross Shorts: | 91,084 | 813,894 | 252,891 |
| – Long to Short Ratio: | 0.6 to 1 | 1.2 to 1 | 0.5 to 1 |
| NET POSITION TREND: | |||
| – Strength Index Score (3 Year Range Pct): | 19.4 | 79.4 | 49.7 |
| – Strength Index Reading (3 Year Range): | Bearish-Extreme | Bullish | Bearish |
| NET POSITION MOVEMENT INDEX: | |||
| – 6-Week Change in Strength Index: | 7.1 | -15.5 | 21.7 |
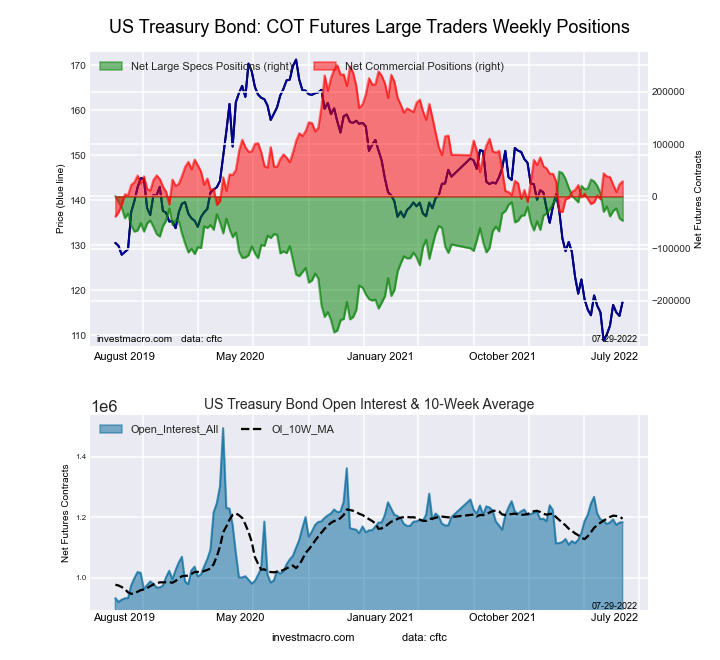
US Treasury Bonds Futures:
 The US Treasury Bonds large speculator standing this week totaled a net position of -56,053 contracts in the data reported through Tuesday. This was a weekly decrease of -9,408 contracts from the previous week which had a total of -46,645 net contracts.
This week’s current strength score (the trader positioning range over the past three years, measured from 0 to 100) shows the speculators are currently Bullish with a score of 66.3 percent. The commercials are Bearish with a score of 26.1 percent and the small traders (not shown in chart) are Bullish with a score of 62.7 percent.
| US Treasury Bonds Statistics | SPECULATORS | COMMERCIALS | SMALL TRADERS |
| – Percent of Open Interest Longs: | 7.1 | 78.0 | 14.0 |
| – Percent of Open Interest Shorts: | 11.9 | 74.3 | 13.0 |
| – Net Position: | -56,053 | 43,323 | 12,730 |
| – Gross Longs: | 83,261 | 915,066 | 164,718 |
| – Gross Shorts: | 139,314 | 871,743 | 151,988 |
| – Long to Short Ratio: | 0.6 to 1 | 1.0 to 1 | 1.1 to 1 |
| NET POSITION TREND: | |||
| – Strength Index Score (3 Year Range Pct): | 66.3 | 26.1 | 62.7 |
| – Strength Index Reading (3 Year Range): | Bullish | Bearish | Bullish |
| NET POSITION MOVEMENT INDEX: | |||
| – 6-Week Change in Strength Index: | -12.0 | 1.9 | 24.9 |
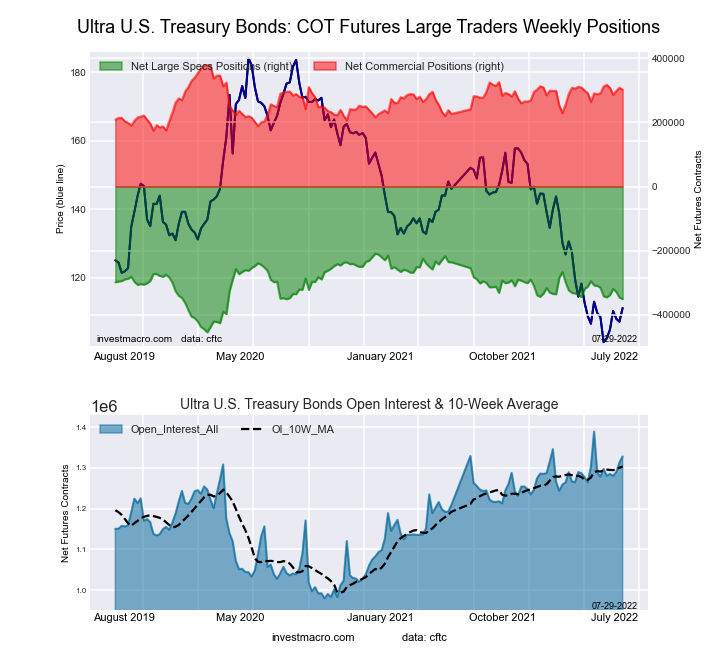
Ultra US Treasury Bonds Futures:
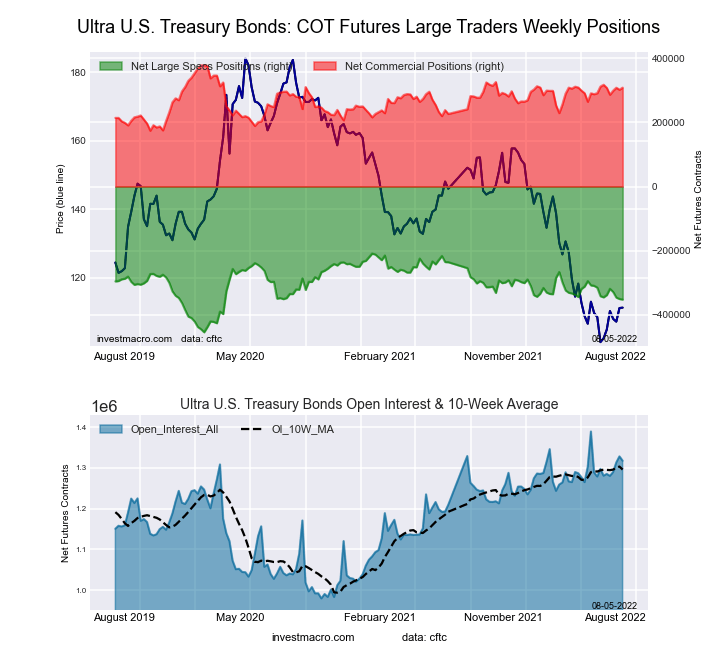 The Ultra US Treasury Bonds large speculator standing this week totaled a net position of -352,115 contracts in the data reported through Tuesday. This was a weekly decrease of -1,854 contracts from the previous week which had a total of -350,261 net contracts.
This week’s current strength score (the trader positioning range over the past three years, measured from 0 to 100) shows the speculators are currently Bearish with a score of 41.6 percent. The commercials are Bullish with a score of 65.6 percent and the small traders (not shown in chart) are Bullish with a score of 60.0 percent.
| Ultra US Treasury Bonds Statistics | SPECULATORS | COMMERCIALS | SMALL TRADERS |
| – Percent of Open Interest Longs: | 3.7 | 84.6 | 11.5 |
| – Percent of Open Interest Shorts: | 30.4 | 61.2 | 8.1 |
| – Net Position: | -352,115 | 307,877 | 44,238 |
| – Gross Longs: | 48,880 | 1,114,434 | 150,939 |
| – Gross Shorts: | 400,995 | 806,557 | 106,701 |
| – Long to Short Ratio: | 0.1 to 1 | 1.4 to 1 | 1.4 to 1 |
| NET POSITION TREND: | |||
| – Strength Index Score (3 Year Range Pct): | 41.6 | 65.6 | 60.0 |
| – Strength Index Reading (3 Year Range): | Bearish | Bullish | Bullish |
| NET POSITION MOVEMENT INDEX: | |||
| – 6-Week Change in Strength Index: | -2.9 | -4.4 | 11.5 |
Article By InvestMacro – Receive our weekly COT Reports by Email
*COT Report: The COT data, released weekly to the public each Friday, is updated through the most recent Tuesday (data is 3 days old) and shows a quick view of how large speculators or non-commercials (for-profit traders) were positioned in the futures markets.
The CFTC categorizes trader positions according to commercial hedgers (traders who use futures contracts for hedging as part of the business), non-commercials (large traders who speculate to realize trading profits) and nonreportable traders (usually small traders/speculators) as well as their open interest (contracts open in the market at time of reporting).See CFTC criteria here.


