
By InvestMacro
Here are the latest charts and statistics for the Commitment of Traders (COT) reports data published by the Commodities Futures Trading Commission (CFTC).
The latest COT data is updated through Tuesday October 4th and shows a quick view of how large traders (for-profit speculators and commercial entities) were positioned in the futures markets.
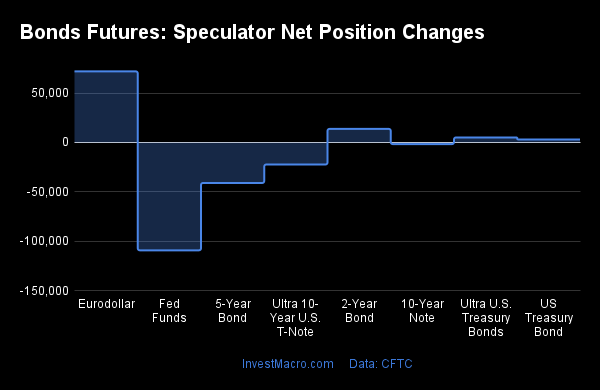
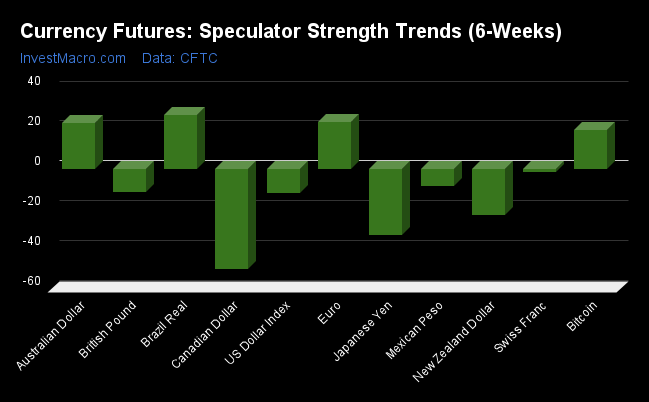
Weekly Speculator Changes
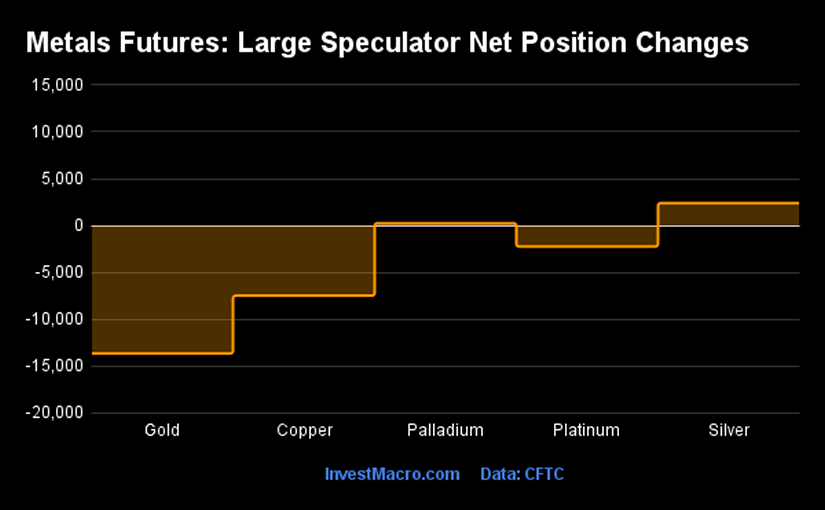
The COT precious metals speculator bets were higher this week all across the board as all five of the metals markets we cover saw stronger sentiment and increased positioning.
Leading the gains for the precious metals markets was Gold (36,304 contracts) with Copper (9,505 contracts), Silver (7,950 contracts), Platinum (3,120 contracts) and Palladium (235 contracts) also showing a positive week.
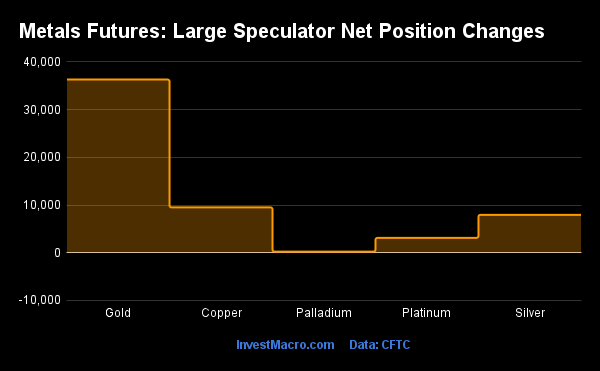
Highlighting the COT Metals this week is the gains in the Silver speculator positions. Silver speculators boosted their bets this week for a fourth straight week and have now pushed their bets higher by +21,492 contracts over that time-frame. This recent turnaround in sentiment brought the overall net position back out of bearish territory after spending five straight weeks there from August 23rd to September 20th. This week’s total net position of +8,708 contracts is the best level for Silver since June 28th. The Silver price closed this week above the $20.25 level and managed to touch its highest level since June above $21 before closing lower.
| Oct-04-2022 | OI | OI-Index | Spec-Net | Spec-Index | Com-Net | COM-Index | Smalls-Net | Smalls-Index |
|---|---|---|---|---|---|---|---|---|
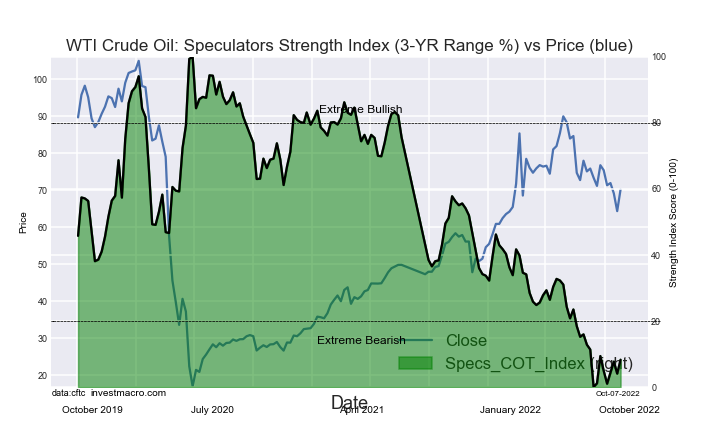
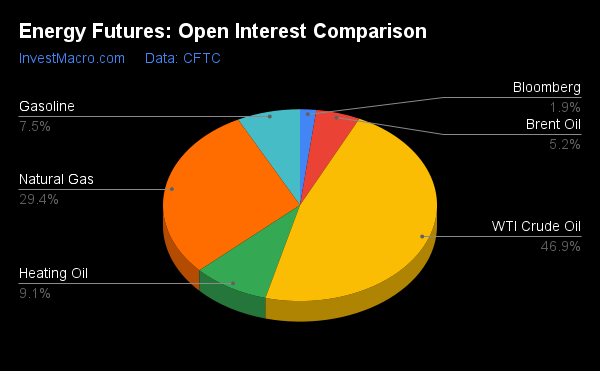
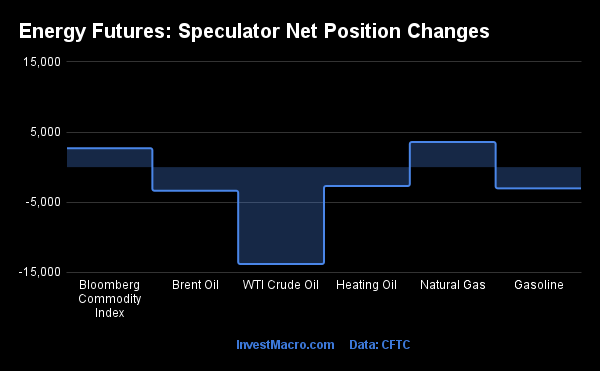
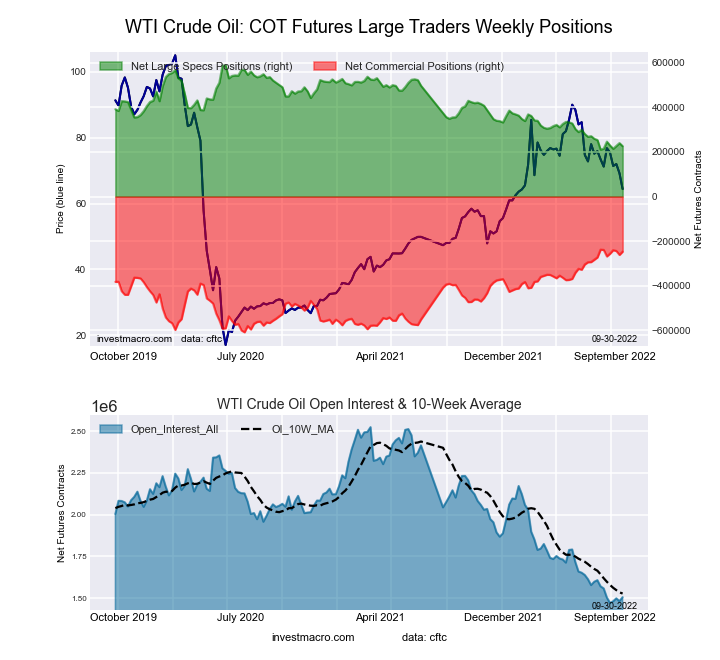
| WTI Crude | 1,495,538 | 2 | 241,999 | 8 | -260,854 | 94 | 18,855 | 31 |
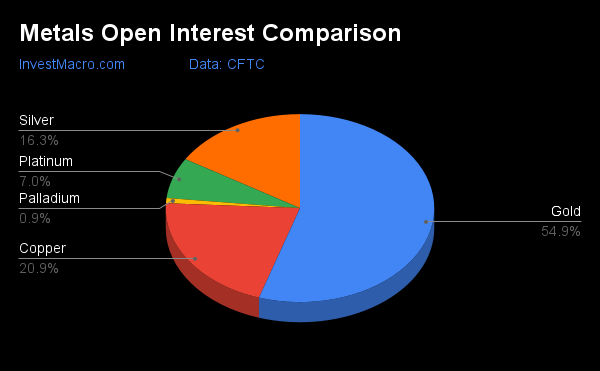
| Gold | 437,065 | 0 | 88,385 | 12 | -96,548 | 89 | 8,163 | 0 |
| Silver | 129,524 | 0 | 8,708 | 24 | -17,617 | 79 | 8,909 | 13 |
| Copper | 166,161 | 7 | -18,251 | 23 | 18,023 | 79 | 228 | 27 |
| Palladium | 7,080 | 5 | -596 | 20 | 364 | 77 | 232 | 57 |
| Platinum | 55,682 | 14 | 3,281 | 13 | -7,137 | 87 | 3,856 | 20 |
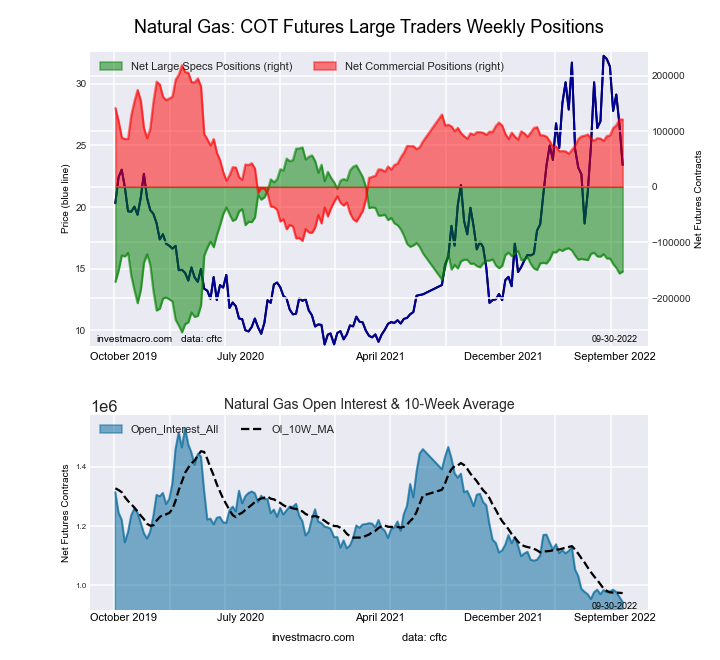
| Natural Gas | 967,126 | 4 | -159,096 | 31 | 126,046 | 71 | 33,050 | 58 |
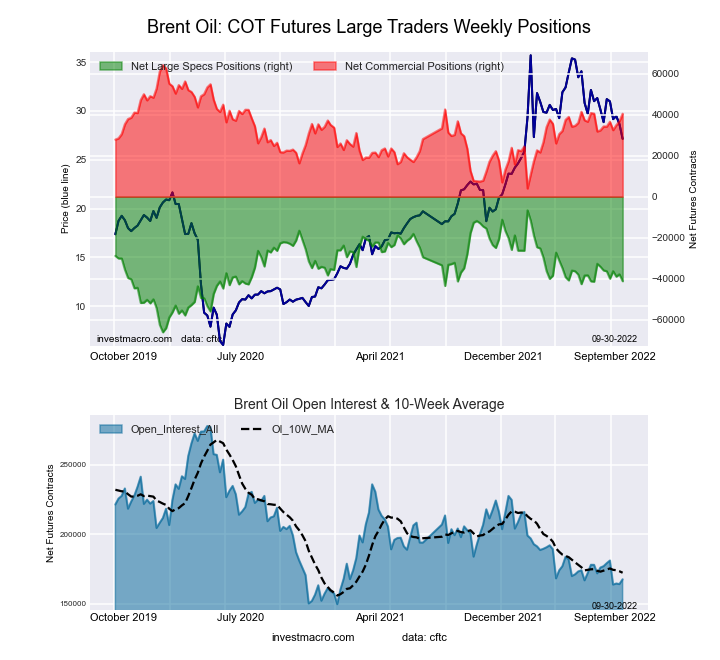
| Brent | 162,762 | 10 | -39,820 | 44 | 38,106 | 57 | 1,714 | 32 |
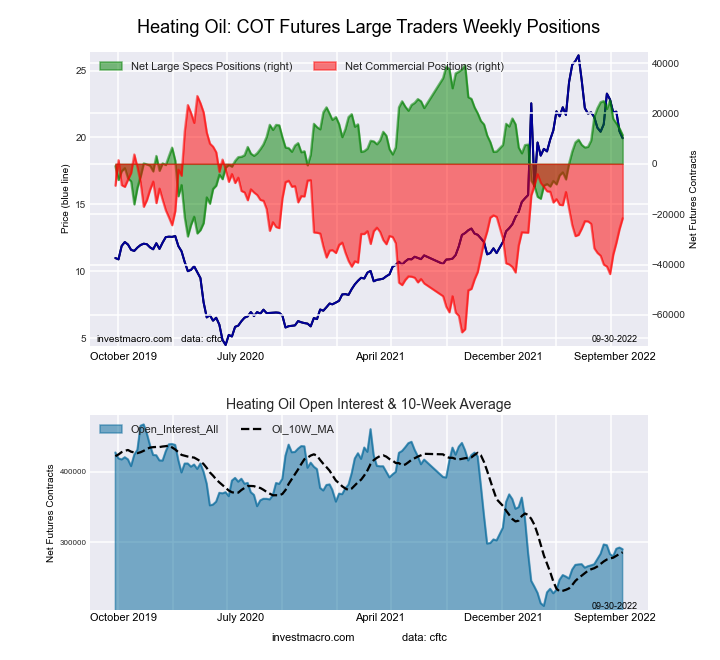
| Heating Oil | 282,988 | 28 | 15,755 | 66 | -32,103 | 37 | 16,348 | 55 |
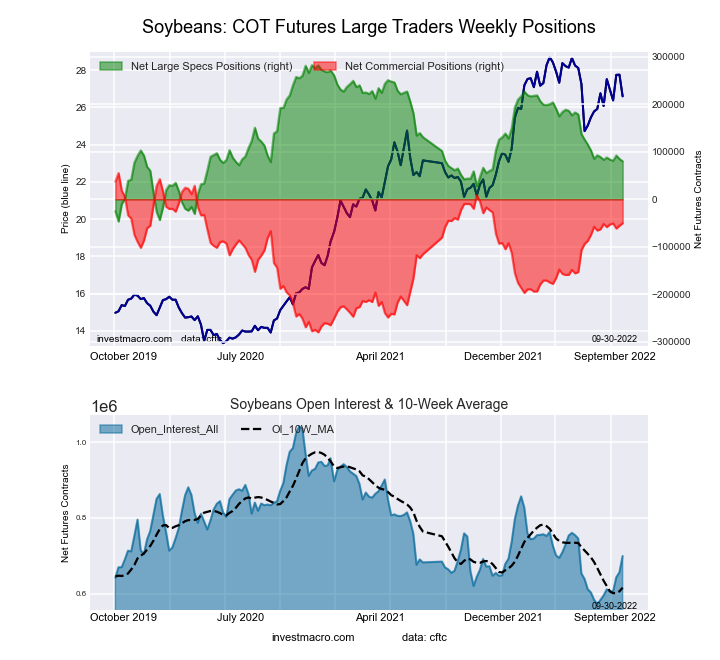
| Soybeans | 677,178 | 22 | 66,757 | 34 | -40,083 | 74 | -26,674 | 26 |
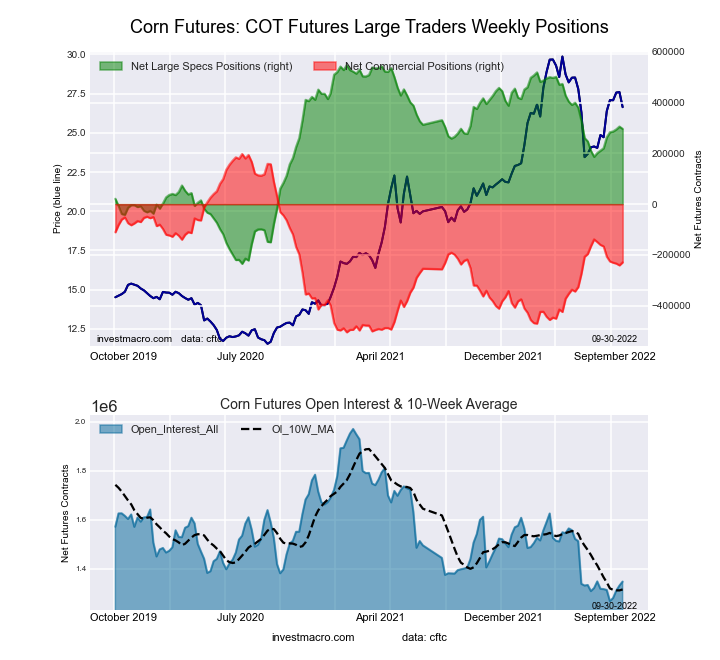
| Corn | 1,365,622 | 14 | 304,962 | 69 | -239,959 | 38 | -65,003 | 6 |
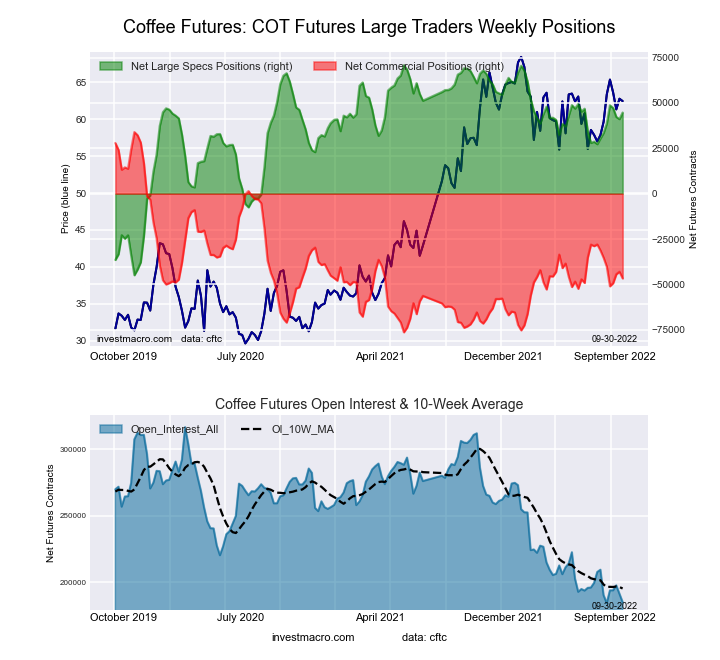
| Coffee | 184,698 | 0 | 42,151 | 75 | -44,264 | 29 | 2,113 | 19 |
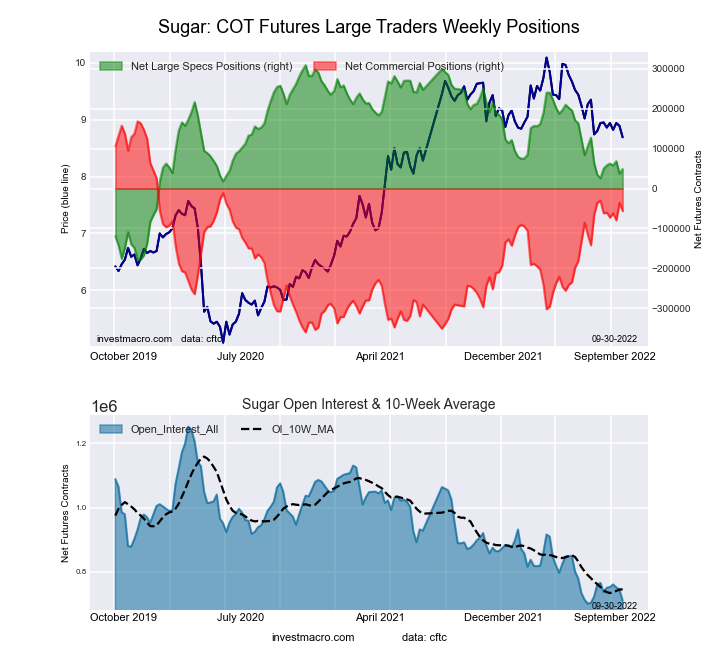
| Sugar | 687,018 | 0 | 47,087 | 46 | -63,354 | 56 | 16,267 | 28 |
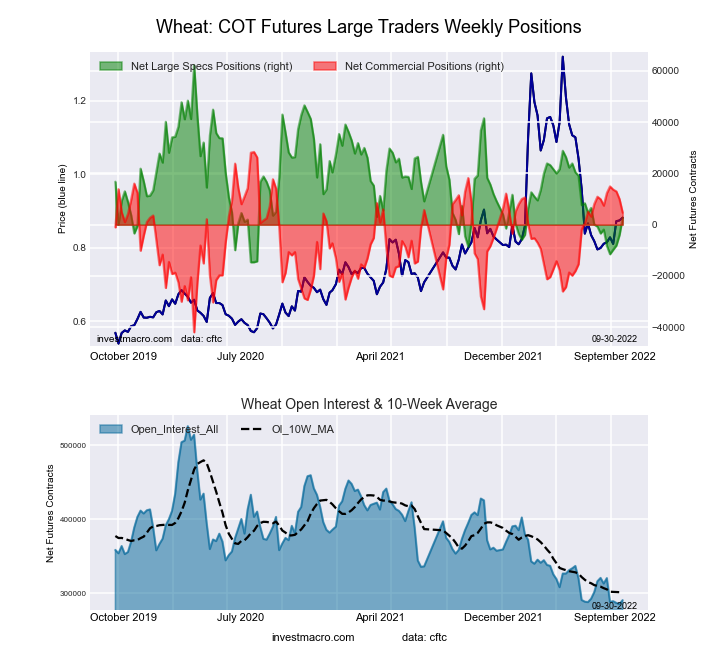
| Wheat | 291,614 | 3 | 5,624 | 26 | 1,901 | 62 | -7,525 | 71 |
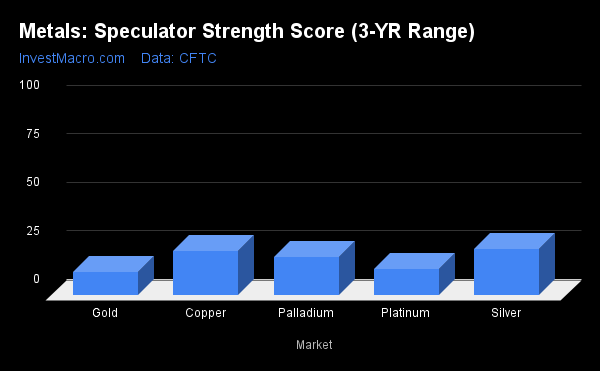
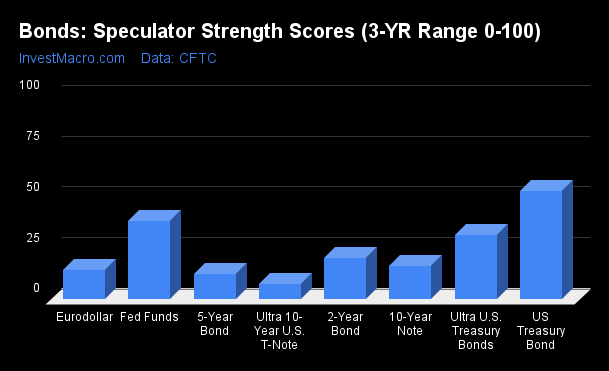
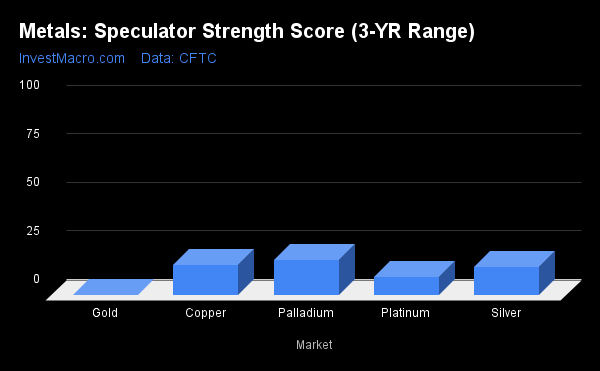
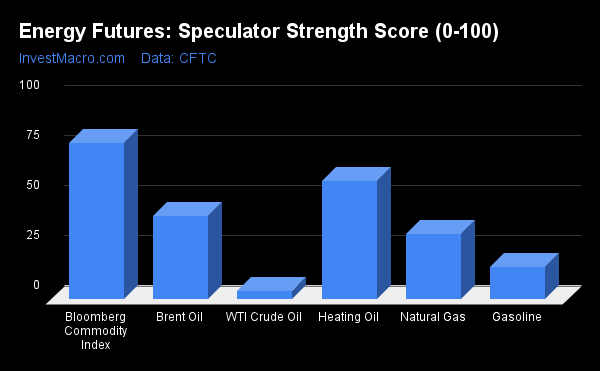
Strength Scores show Silver and Copper rise
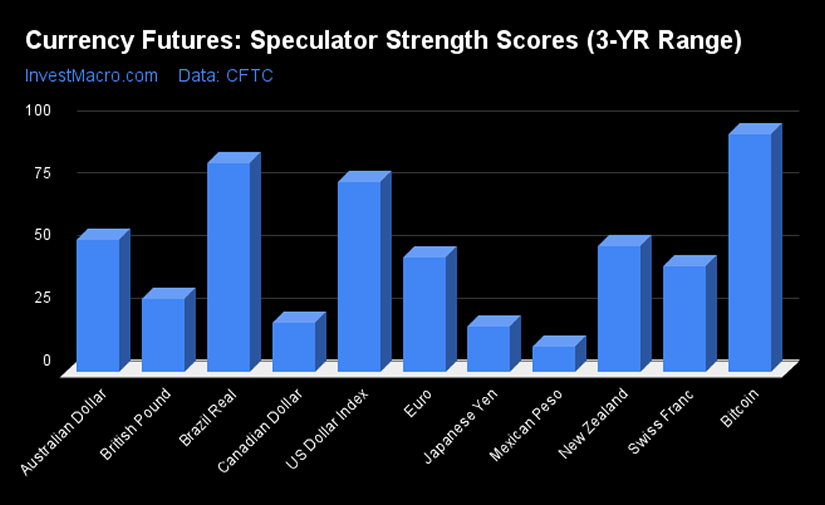
Strength scores (a measure of the 3-Year range of Speculator positions, from 0 to 100 where above 80 is extreme bullish and below 20 is extreme bearish) showed that the Silver (23.7 percent) and Copper (22.8 percent) are leading the metals category currently. Both of these markets have now seen there strength scores improve and are above the 20 percent level and out of a bearish extreme position.
On the downside, Gold (12.0 percent), Platinum (13.5 percent) and Palladium (19.9 percent) continue to be at the lowest strength levels currently and in bearish extreme positions (below 20 percent).
Strength Statistics:
Gold (12.0 percent) vs Gold previous week (0.0 percent)
Silver (23.7 percent) vs Silver previous week (14.9 percent)
Copper (22.8 percent) vs Copper previous week (15.3 percent)
Platinum (13.5 percent) vs Platinum previous week (9.3 percent)
Palladium (19.9 percent) vs Palladium previous week (18.6 percent)
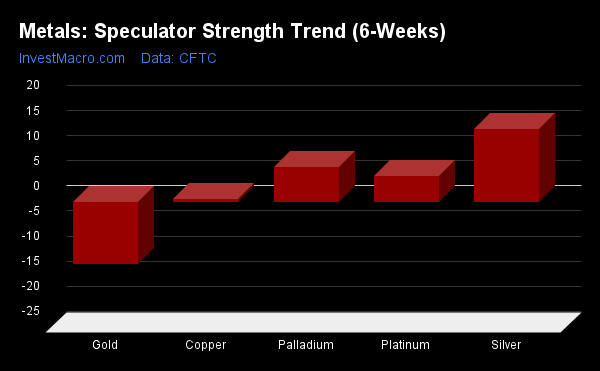
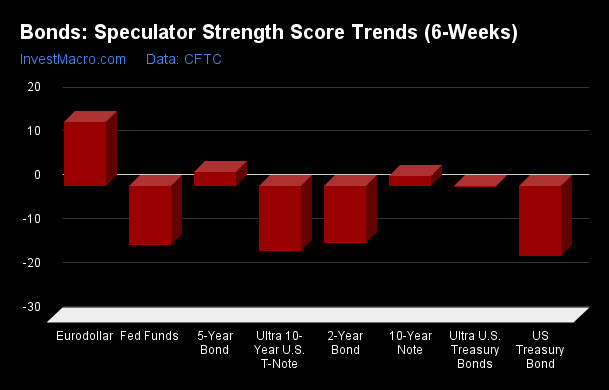
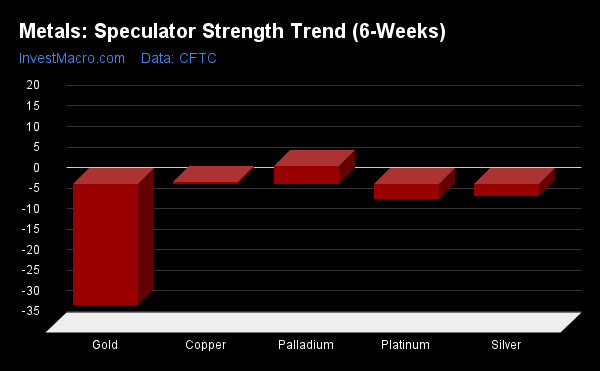
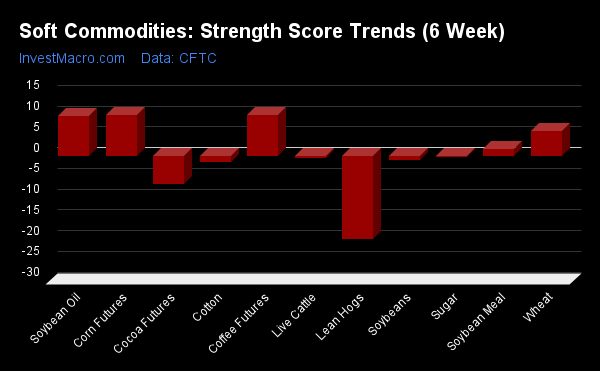
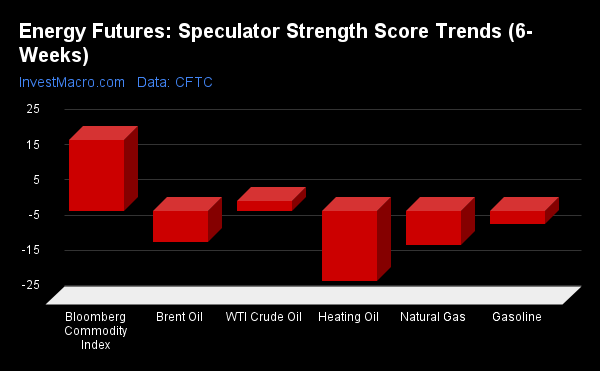
Silver leads the Strength Trends
Strength Score Trends (or move index, calculates the 6-week changes in strength scores) show that Silver (14.6 percent) leads the past six weeks trends for metals this week. Palladium (6.9 percent), Platinum (5.2 percent) and Copper (0.6 percent) are all seeing positive moves for the past 6-weeks in the latest trends data.
Gold (-12.4 percent) is the only market this week with lower trend scores.
Move Statistics:
Gold (-12.4 percent) vs Gold previous week (-29.5 percent)
Silver (14.6 percent) vs Silver previous week (-3.0 percent)
Copper (0.6 percent) vs Copper previous week (0.4 percent)
Platinum (5.2 percent) vs Platinum previous week (-3.7 percent)
Palladium (6.9 percent) vs Palladium previous week (4.4 percent)
Individual Markets:
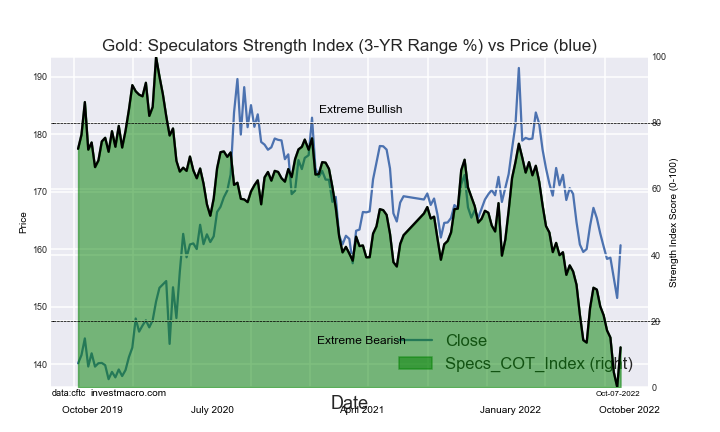
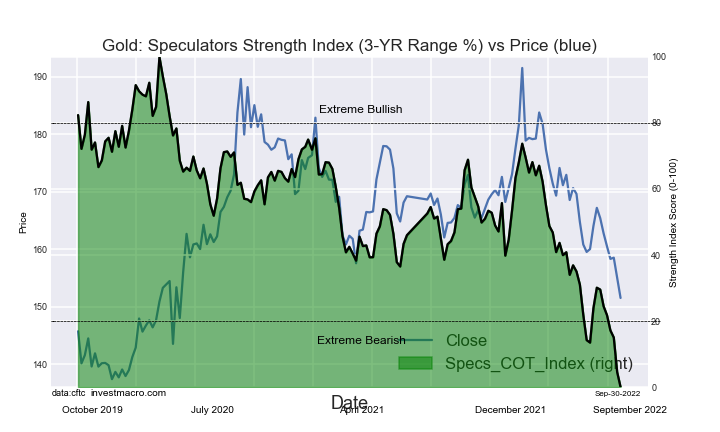
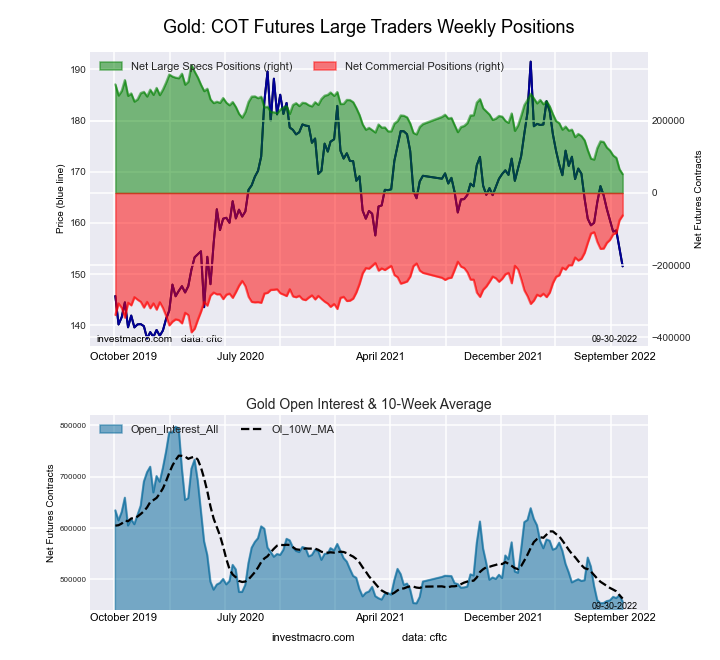
Gold Comex Futures:
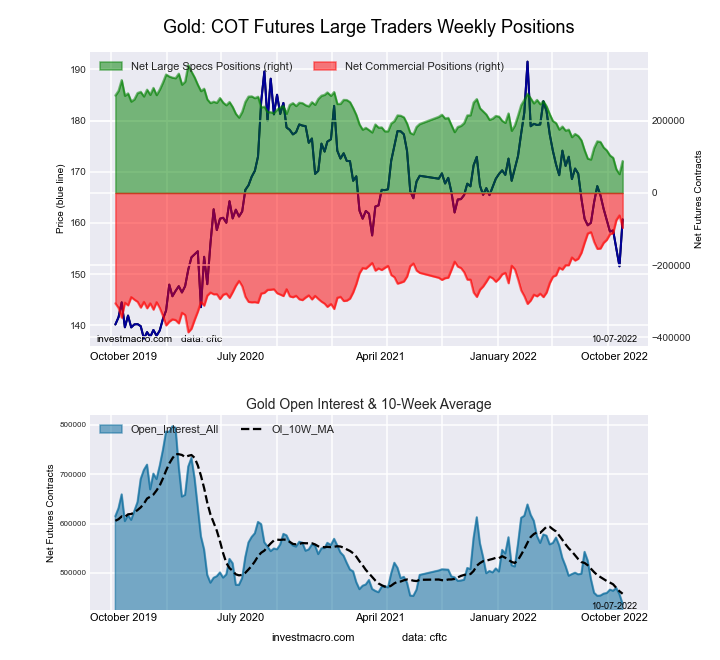 The Gold Comex Futures large speculator standing this week came in at a net position of 88,385 contracts in the data reported through Tuesday. This was a weekly boost of 36,304 contracts from the previous week which had a total of 52,081 net contracts.
This week’s current strength score (the trader positioning range over the past three years, measured from 0 to 100) shows the speculators are currently Bearish-Extreme with a score of 12.0 percent. The commercials are Bullish-Extreme with a score of 89.4 percent and the small traders (not shown in chart) are Bearish-Extreme with a score of 0.0 percent.
| Gold Futures Statistics | SPECULATORS | COMMERCIALS | SMALL TRADERS |
| – Percent of Open Interest Longs: | 49.4 | 26.6 | 8.4 |
| – Percent of Open Interest Shorts: | 29.2 | 48.7 | 6.5 |
| – Net Position: | 88,385 | -96,548 | 8,163 |
| – Gross Longs: | 215,964 | 116,451 | 36,704 |
| – Gross Shorts: | 127,579 | 212,999 | 28,541 |
| – Long to Short Ratio: | 1.7 to 1 | 0.5 to 1 | 1.3 to 1 |
| NET POSITION TREND: | |||
| – Strength Index Score (3 Year Range Pct): | 12.0 | 89.4 | 0.0 |
| – Strength Index Reading (3 Year Range): | Bearish-Extreme | Bullish-Extreme | Bearish-Extreme |
| NET POSITION MOVEMENT INDEX: | |||
| – 6-Week Change in Strength Index: | -12.4 | 12.8 | -10.2 |
Silver Comex Futures:
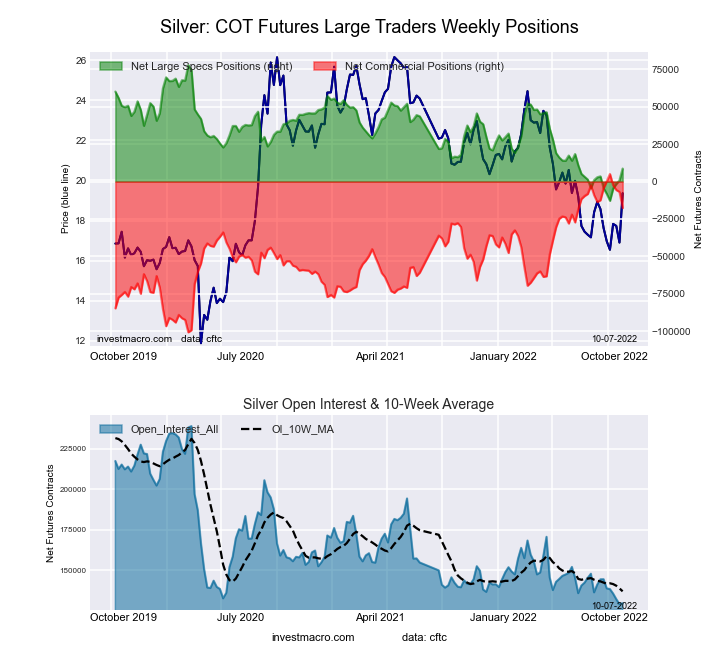 The Silver Comex Futures large speculator standing this week came in at a net position of 8,708 contracts in the data reported through Tuesday. This was a weekly boost of 7,950 contracts from the previous week which had a total of 758 net contracts.
This week’s current strength score (the trader positioning range over the past three years, measured from 0 to 100) shows the speculators are currently Bearish with a score of 23.7 percent. The commercials are Bullish with a score of 78.6 percent and the small traders (not shown in chart) are Bearish-Extreme with a score of 13.4 percent.
| Silver Futures Statistics | SPECULATORS | COMMERCIALS | SMALL TRADERS |
| – Percent of Open Interest Longs: | 40.1 | 36.9 | 17.0 |
| – Percent of Open Interest Shorts: | 33.4 | 50.5 | 10.1 |
| – Net Position: | 8,708 | -17,617 | 8,909 |
| – Gross Longs: | 51,926 | 47,755 | 22,040 |
| – Gross Shorts: | 43,218 | 65,372 | 13,131 |
| – Long to Short Ratio: | 1.2 to 1 | 0.7 to 1 | 1.7 to 1 |
| NET POSITION TREND: | |||
| – Strength Index Score (3 Year Range Pct): | 23.7 | 78.6 | 13.4 |
| – Strength Index Reading (3 Year Range): | Bearish | Bullish | Bearish-Extreme |
| NET POSITION MOVEMENT INDEX: | |||
| – 6-Week Change in Strength Index: | 14.6 | -12.6 | 0.4 |
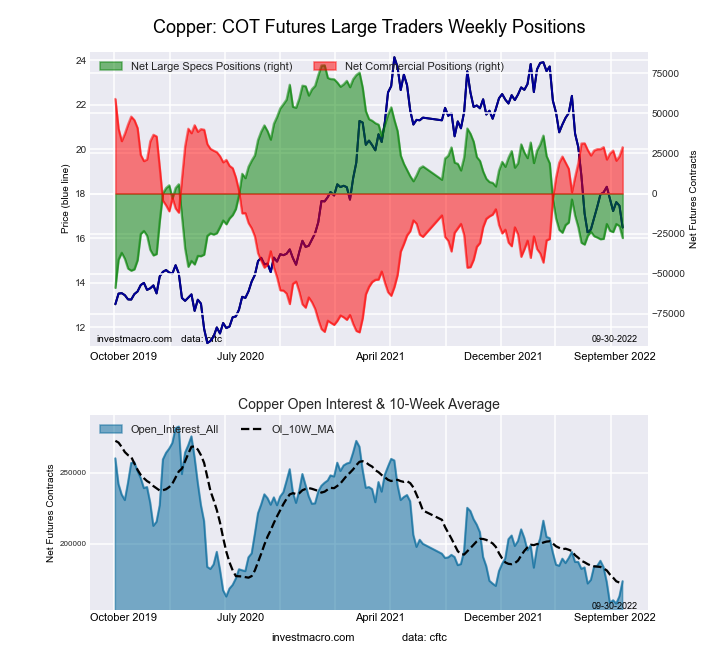
Copper Grade #1 Futures:
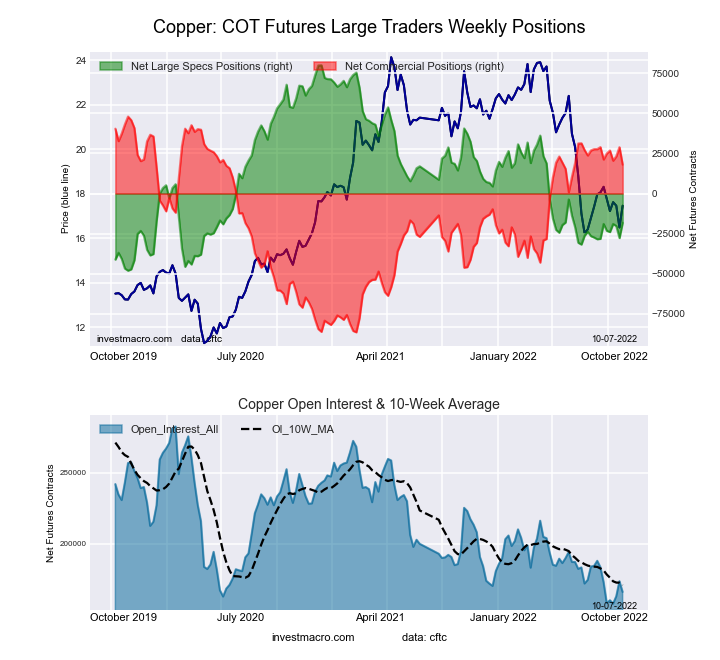 The Copper Grade #1 Futures large speculator standing this week came in at a net position of -18,251 contracts in the data reported through Tuesday. This was a weekly boost of 9,505 contracts from the previous week which had a total of -27,756 net contracts.
This week’s current strength score (the trader positioning range over the past three years, measured from 0 to 100) shows the speculators are currently Bearish with a score of 22.8 percent. The commercials are Bullish with a score of 79.0 percent and the small traders (not shown in chart) are Bearish with a score of 26.6 percent.
| Copper Futures Statistics | SPECULATORS | COMMERCIALS | SMALL TRADERS |
| – Percent of Open Interest Longs: | 30.4 | 47.4 | 8.7 |
| – Percent of Open Interest Shorts: | 41.4 | 36.6 | 8.6 |
| – Net Position: | -18,251 | 18,023 | 228 |
| – Gross Longs: | 50,470 | 78,817 | 14,537 |
| – Gross Shorts: | 68,721 | 60,794 | 14,309 |
| – Long to Short Ratio: | 0.7 to 1 | 1.3 to 1 | 1.0 to 1 |
| NET POSITION TREND: | |||
| – Strength Index Score (3 Year Range Pct): | 22.8 | 79.0 | 26.6 |
| – Strength Index Reading (3 Year Range): | Bearish | Bullish | Bearish |
| NET POSITION MOVEMENT INDEX: | |||
| – 6-Week Change in Strength Index: | 0.6 | -2.4 | 14.3 |
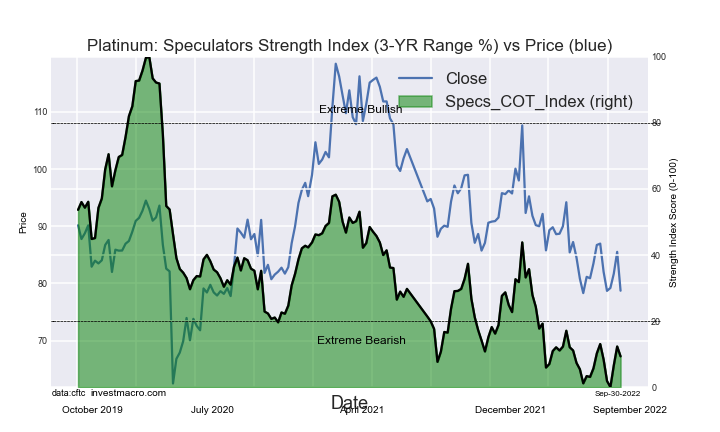
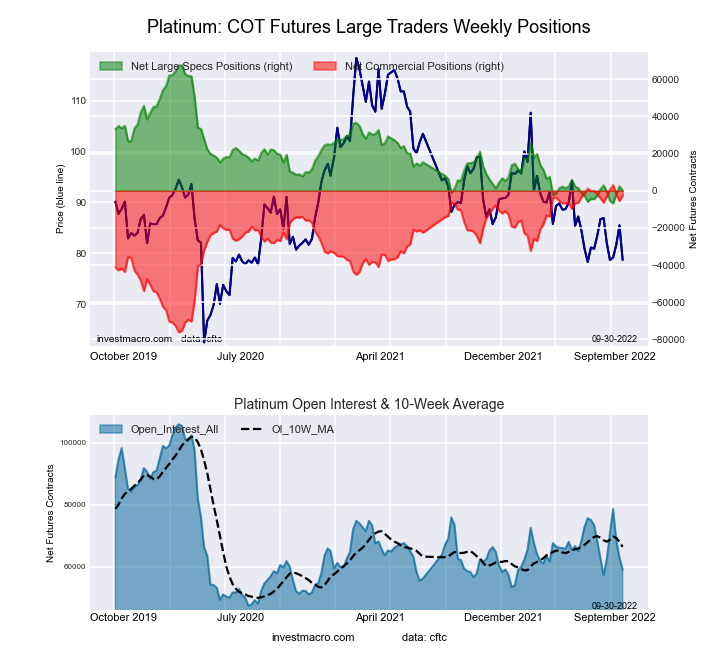
Platinum Futures:
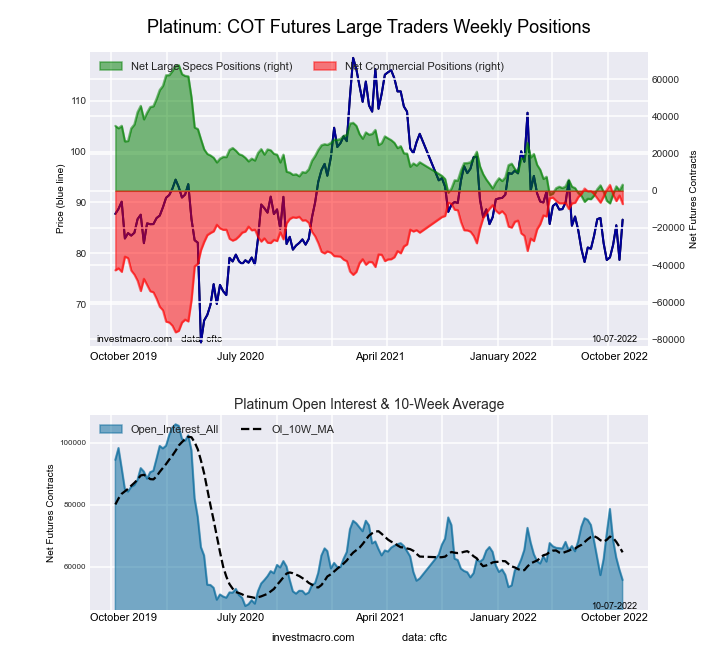 The Platinum Futures large speculator standing this week came in at a net position of 3,281 contracts in the data reported through Tuesday. This was a weekly advance of 3,120 contracts from the previous week which had a total of 161 net contracts.
This week’s current strength score (the trader positioning range over the past three years, measured from 0 to 100) shows the speculators are currently Bearish-Extreme with a score of 13.5 percent. The commercials are Bullish-Extreme with a score of 87.0 percent and the small traders (not shown in chart) are Bearish-Extreme with a score of 19.8 percent.
| Platinum Futures Statistics | SPECULATORS | COMMERCIALS | SMALL TRADERS |
| – Percent of Open Interest Longs: | 46.0 | 37.9 | 12.9 |
| – Percent of Open Interest Shorts: | 40.1 | 50.7 | 6.0 |
| – Net Position: | 3,281 | -7,137 | 3,856 |
| – Gross Longs: | 25,610 | 21,116 | 7,197 |
| – Gross Shorts: | 22,329 | 28,253 | 3,341 |
| – Long to Short Ratio: | 1.1 to 1 | 0.7 to 1 | 2.2 to 1 |
| NET POSITION TREND: | |||
| – Strength Index Score (3 Year Range Pct): | 13.5 | 87.0 | 19.8 |
| – Strength Index Reading (3 Year Range): | Bearish-Extreme | Bullish-Extreme | Bearish-Extreme |
| NET POSITION MOVEMENT INDEX: | |||
| – 6-Week Change in Strength Index: | 5.2 | -5.2 | 3.1 |
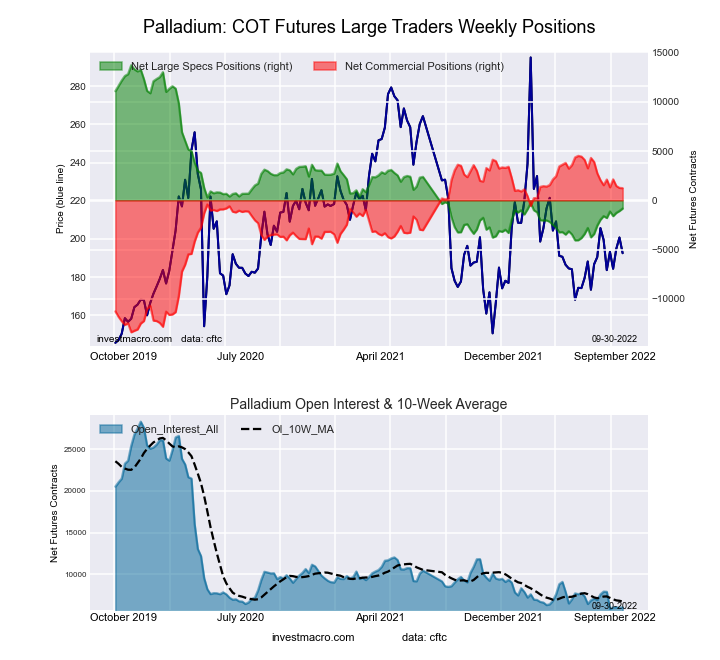
Palladium Futures:
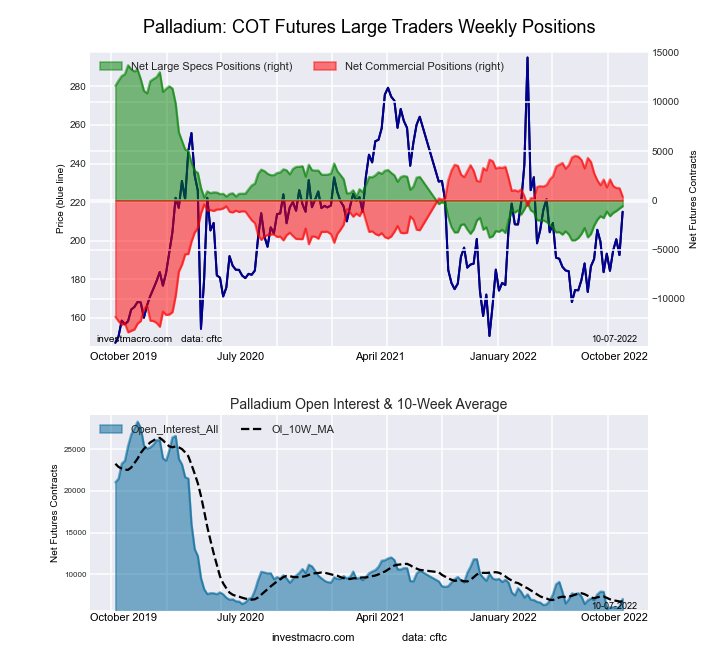 The Palladium Futures large speculator standing this week came in at a net position of -596 contracts in the data reported through Tuesday. This was a weekly lift of 235 contracts from the previous week which had a total of -831 net contracts.
This week’s current strength score (the trader positioning range over the past three years, measured from 0 to 100) shows the speculators are currently Bearish-Extreme with a score of 19.9 percent. The commercials are Bullish with a score of 76.6 percent and the small traders (not shown in chart) are Bullish with a score of 57.3 percent.
| Palladium Futures Statistics | SPECULATORS | COMMERCIALS | SMALL TRADERS |
| – Percent of Open Interest Longs: | 30.9 | 48.1 | 19.1 |
| – Percent of Open Interest Shorts: | 39.4 | 43.0 | 15.8 |
| – Net Position: | -596 | 364 | 232 |
| – Gross Longs: | 2,191 | 3,409 | 1,352 |
| – Gross Shorts: | 2,787 | 3,045 | 1,120 |
| – Long to Short Ratio: | 0.8 to 1 | 1.1 to 1 | 1.2 to 1 |
| NET POSITION TREND: | |||
| – Strength Index Score (3 Year Range Pct): | 19.9 | 76.6 | 57.3 |
| – Strength Index Reading (3 Year Range): | Bearish-Extreme | Bullish | Bullish |
| NET POSITION MOVEMENT INDEX: | |||
| – 6-Week Change in Strength Index: | 6.9 | -9.9 | 31.8 |
Article By InvestMacro – Receive our weekly COT Newsletter
*COT Report: The COT data, released weekly to the public each Friday, is updated through the most recent Tuesday (data is 3 days old) and shows a quick view of how large speculators or non-commercials (for-profit traders) were positioned in the futures markets.
The CFTC categorizes trader positions according to commercial hedgers (traders who use futures contracts for hedging as part of the business), non-commercials (large traders who speculate to realize trading profits) and nonreportable traders (usually small traders/speculators) as well as their open interest (contracts open in the market at time of reporting). See CFTC criteria here.


