By InvestMacro
Here are the latest charts and statistics for the Commitment of Traders (COT) data published by the Commodities Futures Trading Commission (CFTC).
The latest COT data is updated through Tuesday April 9th and shows a quick view of how large market participants (for-profit speculators and commercial traders) were positioned in the futures markets. All currency positions are in direct relation to the US dollar where, for example, a bet for the euro is a bet that the euro will rise versus the dollar while a bet against the euro will be a bet that the euro will decline versus the dollar.
Weekly Speculator Changes led by Euro & Australian Dollar
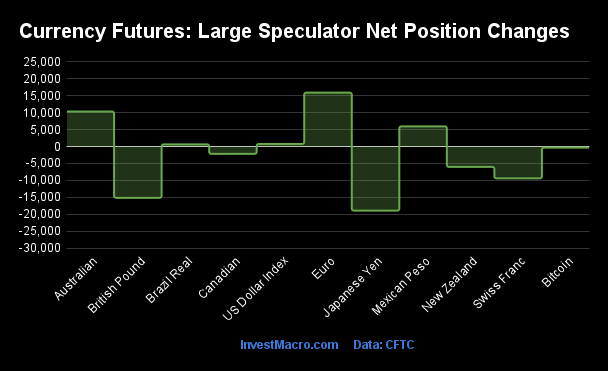
The COT currency market speculator bets were slightly lower this week as five out of the eleven currency markets we cover had higher positioning while the other six markets had lower speculator contracts.
Leading the gains for the currency markets was the EuroFX (15,929 contracts) with the Australian Dollar (10,344 contracts), the Mexican Peso (5,961 contracts), the US Dollar Index (754 contracts) and the Brazilian Real (645 contracts) also showing positive weeks.
The currencies seeing declines in speculator bets on the week were the Japanese Yen (-18,921 contracts), the British Pound (-15,162 contracts), the Swiss Franc (-9,394 contracts), the New Zealand Dollar (-6,019 contracts), the Canadian Dollar (-2,162 contracts) and Bitcoin (-313 contracts) also registering lower bets on the week.
Speculators push Japanese Yen bearish bets to highest since 2007
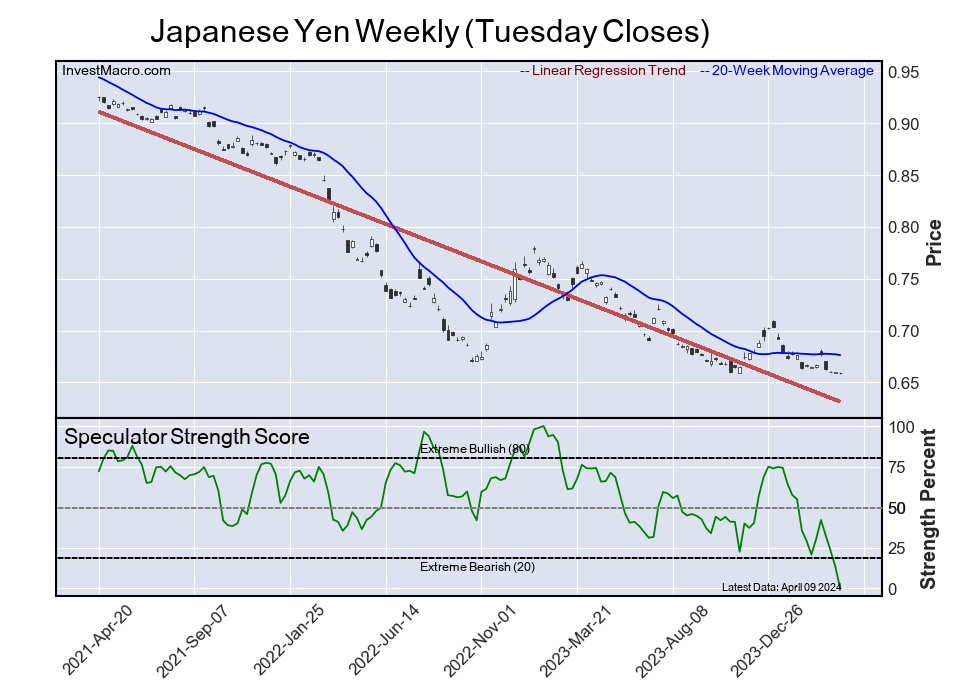
Highlighting the COT currency’s data this week is recent sharp increase in bearish bets for the Japanese yen speculators. Large speculative yen positions fell for a fourth straight week this week and have declined by a total of -59,829 contracts over these last four weeks.
This week’s yen net position of -162,151 contracts marks the most bearish level since July 26th of 2007 (near the beginning of the Global Financial Crisis) when the net positions were all the way down to -188,077 contracts. The yen speculative position has now been over the -100,000 contract level for nine straight weeks and, overall, the speculator standing has been in a continuous bearish level since March of 2021. This amounts to a total of 161 straight weeks of bearish positions.
The Bank of Japan (BOJ) recently ended its negative interest rate policy in March but that only provided a small, short-lived bump to the yen. Since then, the yen exchange rate has experienced very sharp weakness and has now hit a new 34-year low versus the US Dollar. The USD/JPY currency pair (higher USD/JPY is dollar strength/yen weakness) rose to the 153.20 exchange rate to close the week and is now at the highest level since June of 1990. The USD/JPY is up by almost 9 percent since the beginning of the year and has prompted warnings that the BOJ may look to intervene to halt their fast-sliding currency.
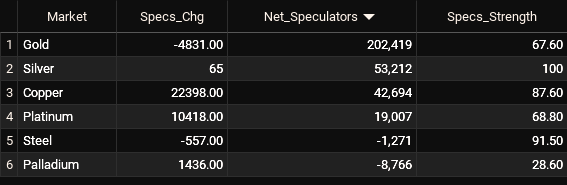
Currencies Net Speculators Leaderboard
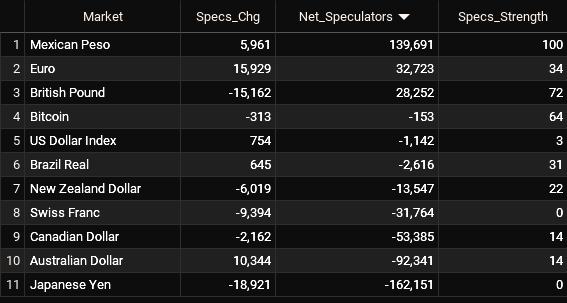
Legend: Weekly Speculators Change | Speculators Current Net Position | Speculators Strength Score compared to last 3-Years (0-100 range)
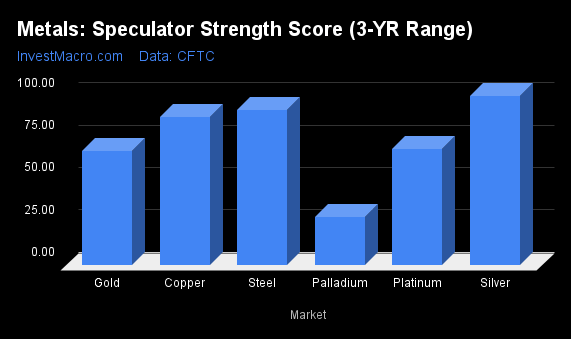
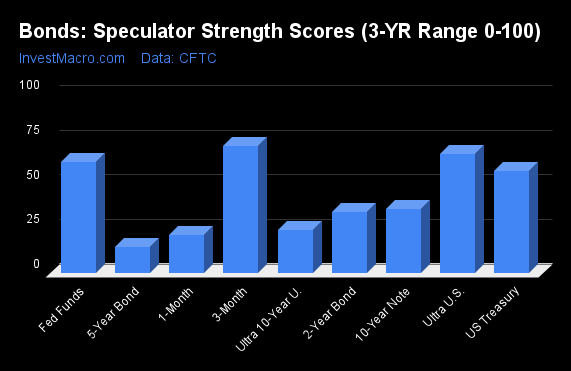
Strength Scores led by Mexican Peso & British Pound
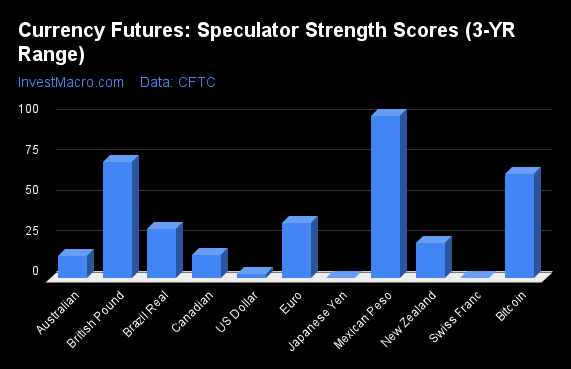
COT Strength Scores (a normalized measure of Speculator positions over a 3-Year range, from 0 to 100 where above 80 is Extreme-Bullish and below 20 is Extreme-Bearish) showed that the Mexican Peso (100 percent) and the British Pound (72 percent) lead the currency markets this week. Bitcoin (64 percent) comes in as the next highest in the weekly strength scores.
On the downside, the Swiss Franc (0 percent), the Japanese Yen (0 percent), the US Dollar Index (2 percent), the Australian Dollar (14 percent) and the Canadian Dollar (14 percent) come in at the lowest strength levels currently and are in Extreme-Bearish territory (below 20 percent).
Strength Statistics:
US Dollar Index (2.5 percent) vs US Dollar Index previous week (0.9 percent)
EuroFX (34.2 percent) vs EuroFX previous week (27.5 percent)
British Pound Sterling (72.0 percent) vs British Pound Sterling previous week (82.1 percent)
Japanese Yen (0.0 percent) vs Japanese Yen previous week (13.3 percent)
Swiss Franc (0.0 percent) vs Swiss Franc previous week (20.7 percent)
Canadian Dollar (14.3 percent) vs Canadian Dollar previous week (16.1 percent)
Australian Dollar (13.7 percent) vs Australian Dollar previous week (4.4 percent)
New Zealand Dollar (21.9 percent) vs New Zealand Dollar previous week (39.0 percent)
Mexican Peso (100.0 percent) vs Mexican Peso previous week (97.1 percent)
Brazilian Real (30.8 percent) vs Brazilian Real previous week (30.0 percent)
Bitcoin (64.1 percent) vs Bitcoin previous week (68.8 percent)
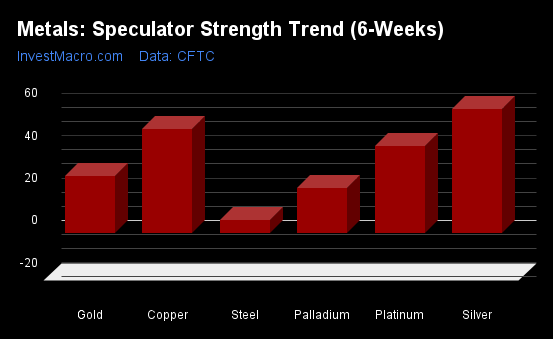
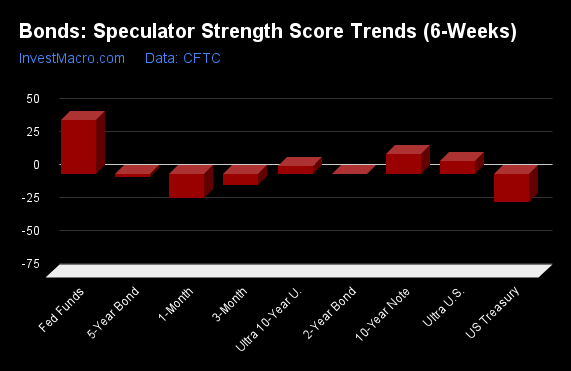
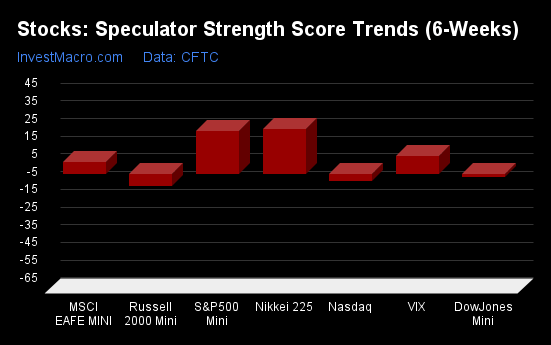
Bitcoin & Mexican Peso top the 6-Week Strength Trends
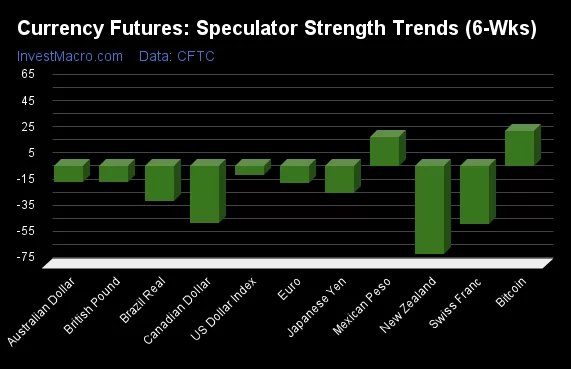
COT Strength Score Trends (or move index, calculates the 6-week changes in strength scores) showed that Bitcoin (27 percent) and the Mexican Peso (23 percent) lead the past six weeks trends for the currencies and are the only two markets with positive trends this week.
The New Zealand Dollar (-67 percent) leads the downside trend scores currently with the Canadian Dollar (-44 percent), Swiss Franc (-44 percent) and the Brazilian Real (-26 percent) following next with lower trend scores.
Strength Trend Statistics:
US Dollar Index (-6.8 percent) vs US Dollar Index previous week (-7.3 percent)
EuroFX (-12.8 percent) vs EuroFX previous week (-21.8 percent)
British Pound Sterling (-12.0 percent) vs British Pound Sterling previous week (-1.9 percent)
Japanese Yen (-20.7 percent) vs Japanese Yen previous week (-15.8 percent)
Swiss Franc (-43.7 percent) vs Swiss Franc previous week (-27.5 percent)
Canadian Dollar (-43.6 percent) vs Canadian Dollar previous week (-42.3 percent)
Australian Dollar (-11.9 percent) vs Australian Dollar previous week (-18.8 percent)
New Zealand Dollar (-67.0 percent) vs New Zealand Dollar previous week (-40.2 percent)
Mexican Peso (22.5 percent) vs Mexican Peso previous week (18.5 percent)
Brazilian Real (-26.2 percent) vs Brazilian Real previous week (-25.8 percent)
Bitcoin (27.3 percent) vs Bitcoin previous week (34.0 percent)
Individual COT Forex Markets:
US Dollar Index Futures:
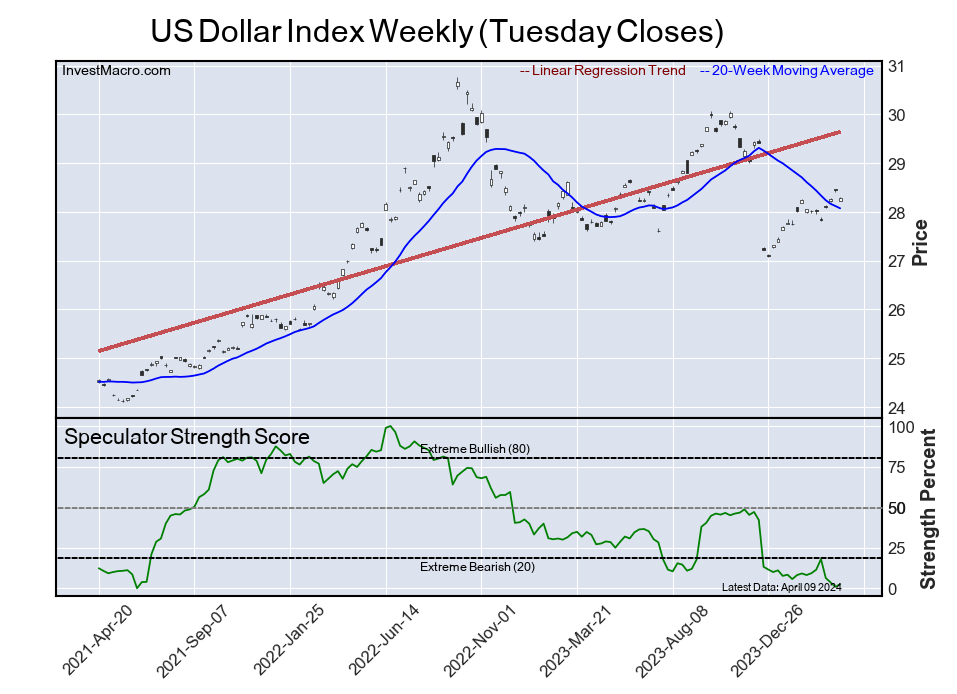
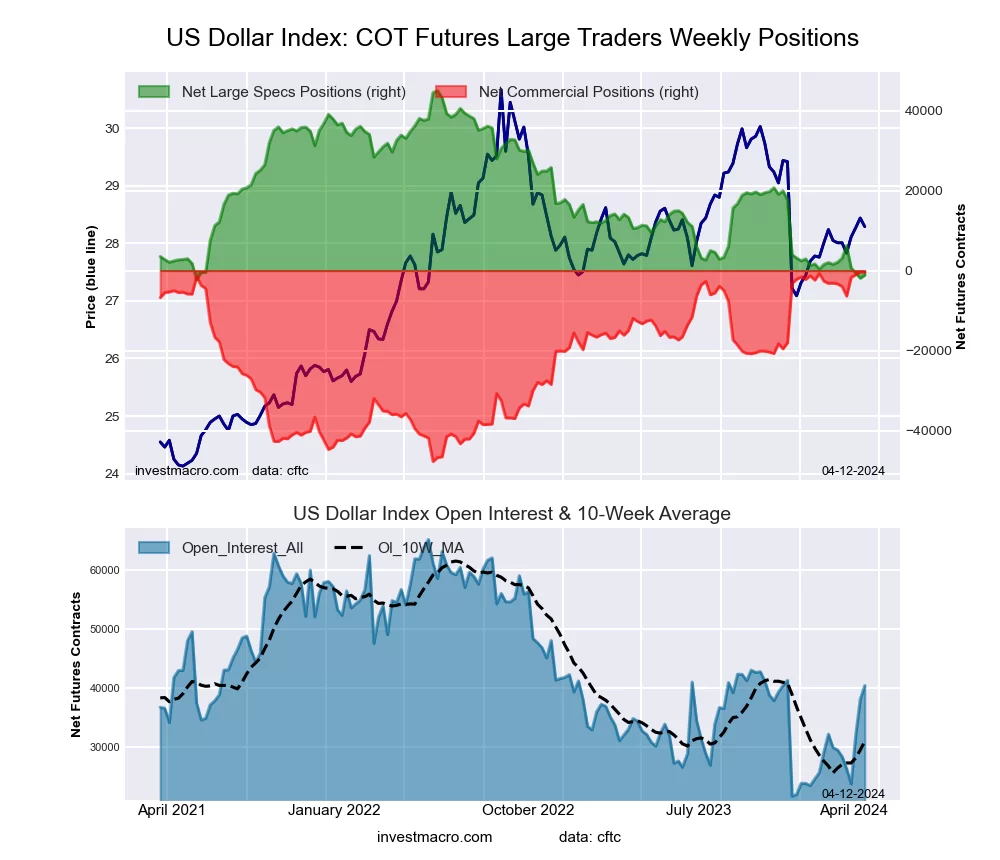 The US Dollar Index large speculator standing this week totaled a net position of -1,142 contracts in the data reported through Tuesday. This was a weekly boost of 754 contracts from the previous week which had a total of -1,896 net contracts.
This week’s current strength score (the trader positioning range over the past three years, measured from 0 to 100) shows the speculators are currently Bearish-Extreme with a score of 2.5 percent. The commercials are Bullish-Extreme with a score of 99.7 percent and the small traders (not shown in chart) are Bearish with a score of 29.5 percent.
Price Trend-Following Model: Weak Downtrend
Our weekly trend-following model classifies the current market price position as: Weak Downtrend. The current action for the model is considered to be: Hold – Maintain Short Position.
| US DOLLAR INDEX Statistics | SPECULATORS | COMMERCIALS | SMALL TRADERS |
| – Percent of Open Interest Longs: | 66.1 | 22.7 | 8.9 |
| – Percent of Open Interest Shorts: | 68.9 | 23.8 | 5.1 |
| – Net Position: | -1,142 | -430 | 1,572 |
| – Gross Longs: | 26,733 | 9,194 | 3,617 |
| – Gross Shorts: | 27,875 | 9,624 | 2,045 |
| – Long to Short Ratio: | 1.0 to 1 | 1.0 to 1 | 1.8 to 1 |
| NET POSITION TREND: | | | |
| – Strength Index Score (3 Year Range Pct): | 2.5 | 99.7 | 29.5 |
| – Strength Index Reading (3 Year Range): | Bearish-Extreme | Bullish-Extreme | Bearish |
| NET POSITION MOVEMENT INDEX: | | | |
| – 6-Week Change in Strength Index: | -6.8 | 6.1 | 3.9 |
Euro Currency Futures:
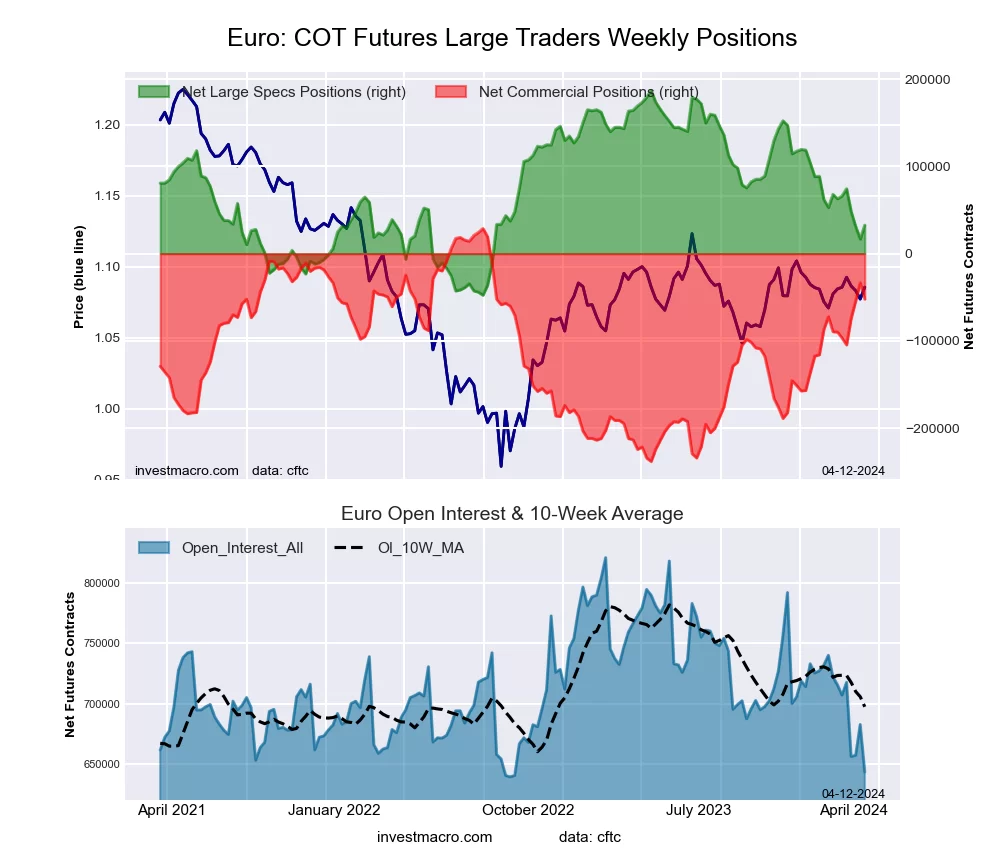 The Euro Currency large speculator standing this week totaled a net position of 32,723 contracts in the data reported through Tuesday. This was a weekly rise of 15,929 contracts from the previous week which had a total of 16,794 net contracts.
This week’s current strength score (the trader positioning range over the past three years, measured from 0 to 100) shows the speculators are currently Bearish with a score of 34.2 percent. The commercials are Bullish with a score of 69.7 percent and the small traders (not shown in chart) are Bearish-Extreme with a score of 9.8 percent.
Price Trend-Following Model: Strong Downtrend
Our weekly trend-following model classifies the current market price position as: Strong Downtrend. The current action for the model is considered to be: Hold – Maintain Short Position.
| EURO Currency Statistics | SPECULATORS | COMMERCIALS | SMALL TRADERS |
| – Percent of Open Interest Longs: | 27.3 | 59.5 | 11.7 |
| – Percent of Open Interest Shorts: | 22.2 | 67.6 | 8.7 |
| – Net Position: | 32,723 | -52,032 | 19,309 |
| – Gross Longs: | 175,419 | 383,114 | 75,049 |
| – Gross Shorts: | 142,696 | 435,146 | 55,740 |
| – Long to Short Ratio: | 1.2 to 1 | 0.9 to 1 | 1.3 to 1 |
| NET POSITION TREND: | | | |
| – Strength Index Score (3 Year Range Pct): | 34.2 | 69.7 | 9.8 |
| – Strength Index Reading (3 Year Range): | Bearish | Bullish | Bearish-Extreme |
| NET POSITION MOVEMENT INDEX: | | | |
| – 6-Week Change in Strength Index: | -12.8 | 14.2 | -12.3 |
British Pound Sterling Futures:
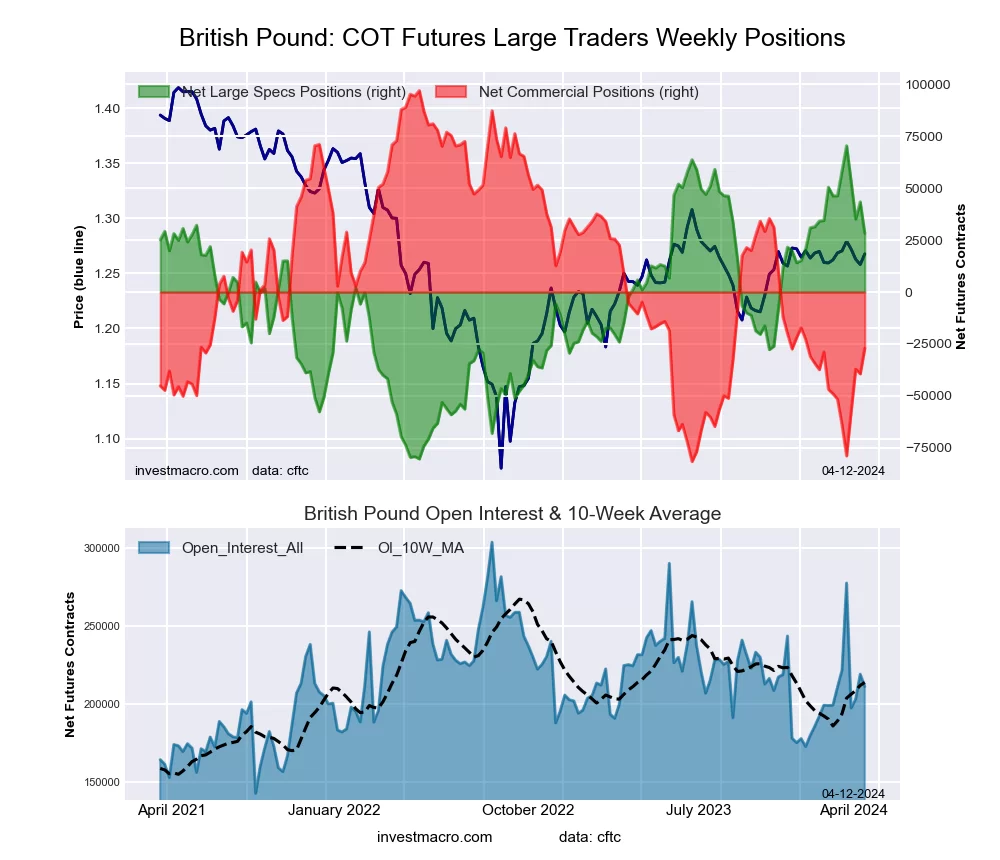 The British Pound Sterling large speculator standing this week totaled a net position of 28,252 contracts in the data reported through Tuesday. This was a weekly lowering of -15,162 contracts from the previous week which had a total of 43,414 net contracts.
This week’s current strength score (the trader positioning range over the past three years, measured from 0 to 100) shows the speculators are currently Bullish with a score of 72.0 percent. The commercials are Bearish with a score of 30.5 percent and the small traders (not shown in chart) are Bullish with a score of 55.7 percent.
Price Trend-Following Model: Strong Downtrend
Our weekly trend-following model classifies the current market price position as: Strong Downtrend. The current action for the model is considered to be: New Sell – Short Position.
| BRITISH POUND Statistics | SPECULATORS | COMMERCIALS | SMALL TRADERS |
| – Percent of Open Interest Longs: | 37.9 | 45.5 | 13.2 |
| – Percent of Open Interest Shorts: | 24.5 | 58.3 | 13.7 |
| – Net Position: | 28,252 | -27,055 | -1,197 |
| – Gross Longs: | 80,000 | 96,196 | 27,814 |
| – Gross Shorts: | 51,748 | 123,251 | 29,011 |
| – Long to Short Ratio: | 1.5 to 1 | 0.8 to 1 | 1.0 to 1 |
| NET POSITION TREND: | | | |
| – Strength Index Score (3 Year Range Pct): | 72.0 | 30.5 | 55.7 |
| – Strength Index Reading (3 Year Range): | Bullish | Bearish | Bullish |
| NET POSITION MOVEMENT INDEX: | | | |
| – 6-Week Change in Strength Index: | -12.0 | 13.7 | -12.6 |
Japanese Yen Futures:
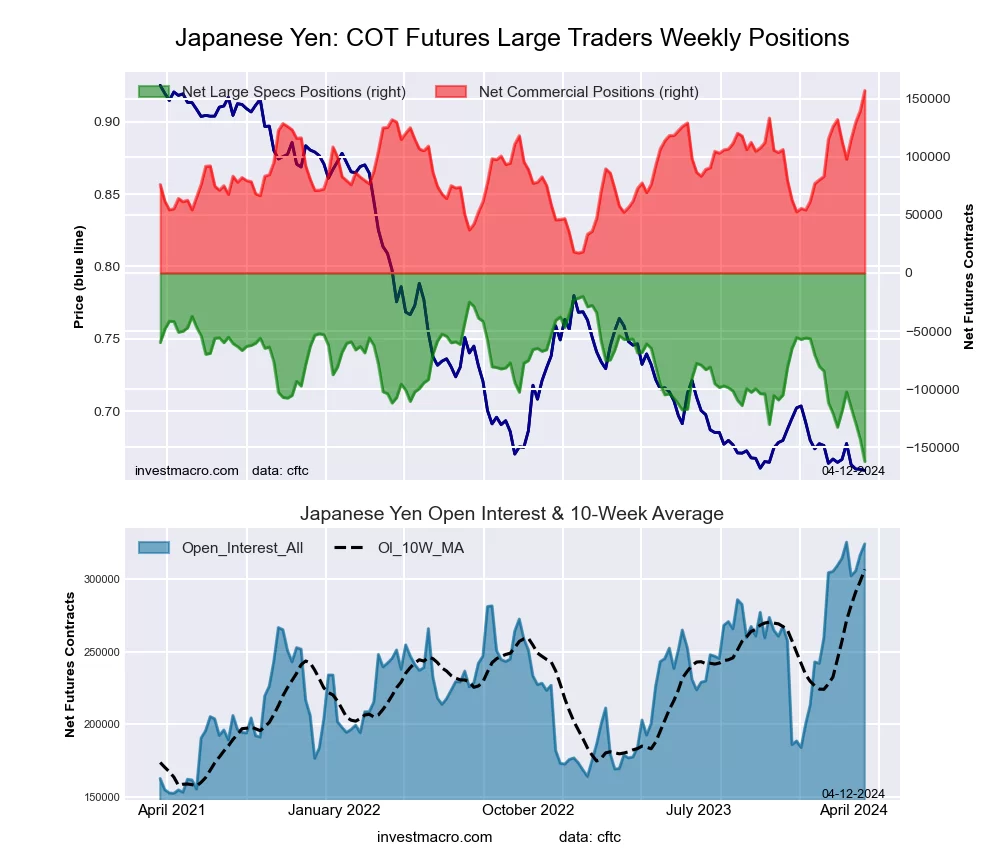 The Japanese Yen large speculator standing this week totaled a net position of -162,151 contracts in the data reported through Tuesday. This was a weekly decline of -18,921 contracts from the previous week which had a total of -143,230 net contracts.
This week’s current strength score (the trader positioning range over the past three years, measured from 0 to 100) shows the speculators are currently Bearish-Extreme with a score of 0.0 percent. The commercials are Bullish-Extreme with a score of 100.0 percent and the small traders (not shown in chart) are Bullish-Extreme with a score of 98.9 percent.
Price Trend-Following Model: Strong Downtrend
Our weekly trend-following model classifies the current market price position as: Strong Downtrend. The current action for the model is considered to be: Hold – Maintain Short Position.
| JAPANESE YEN Statistics | SPECULATORS | COMMERCIALS | SMALL TRADERS |
| – Percent of Open Interest Longs: | 14.6 | 67.6 | 15.7 |
| – Percent of Open Interest Shorts: | 64.5 | 19.2 | 14.1 |
| – Net Position: | -162,151 | 156,942 | 5,209 |
| – Gross Longs: | 47,275 | 219,256 | 50,941 |
| – Gross Shorts: | 209,426 | 62,314 | 45,732 |
| – Long to Short Ratio: | 0.2 to 1 | 3.5 to 1 | 1.1 to 1 |
| NET POSITION TREND: | | | |
| – Strength Index Score (3 Year Range Pct): | 0.0 | 100.0 | 98.9 |
| – Strength Index Reading (3 Year Range): | Bearish-Extreme | Bullish-Extreme | Bullish-Extreme |
| NET POSITION MOVEMENT INDEX: | | | |
| – 6-Week Change in Strength Index: | -20.7 | 17.9 | 14.1 |
Swiss Franc Futures:
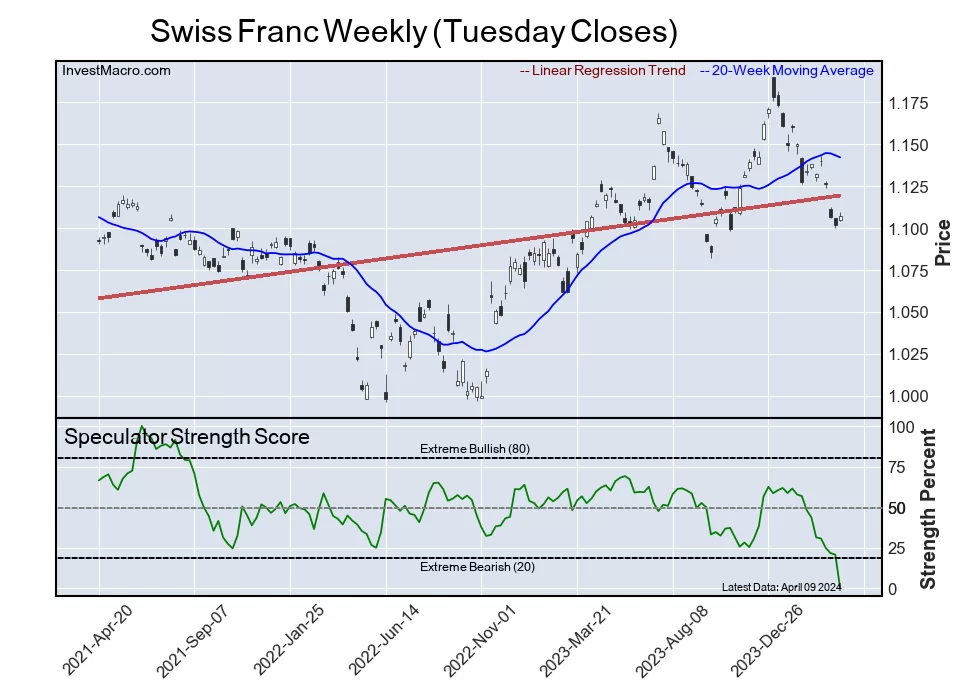
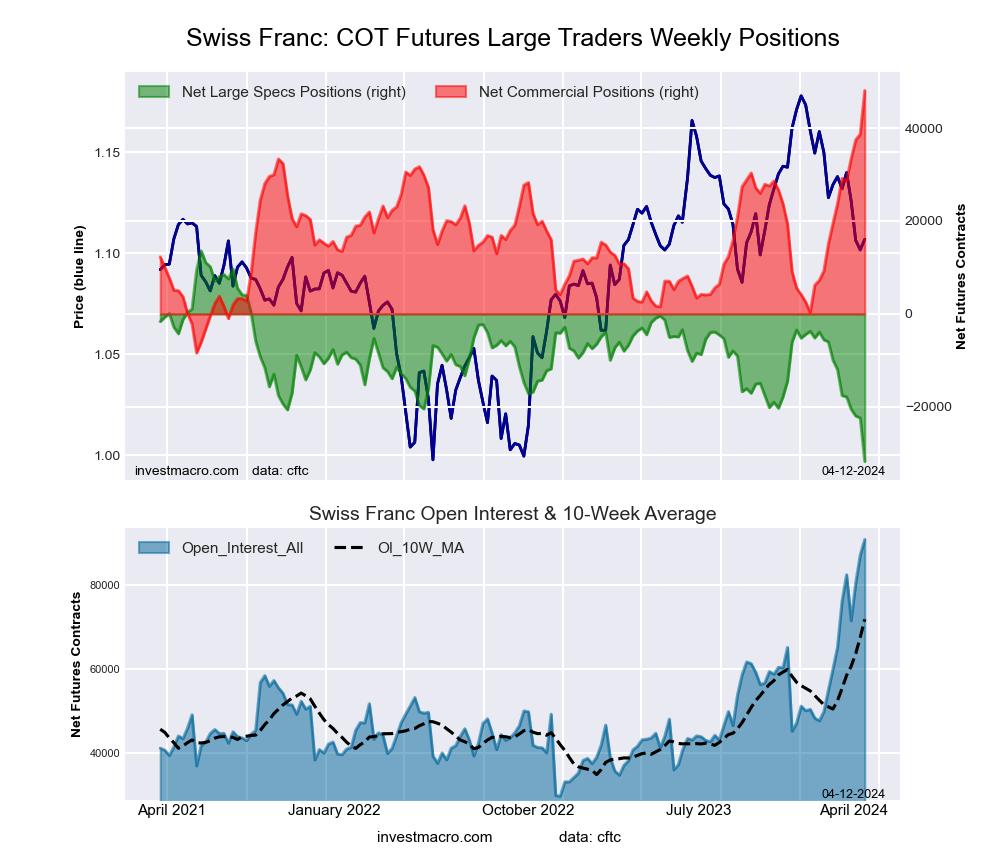 The Swiss Franc large speculator standing this week totaled a net position of -31,764 contracts in the data reported through Tuesday. This was a weekly decrease of -9,394 contracts from the previous week which had a total of -22,370 net contracts.
This week’s current strength score (the trader positioning range over the past three years, measured from 0 to 100) shows the speculators are currently Bearish-Extreme with a score of 0.0 percent. The commercials are Bullish-Extreme with a score of 100.0 percent and the small traders (not shown in chart) are Bearish-Extreme with a score of 3.1 percent.
Price Trend-Following Model: Strong Downtrend
Our weekly trend-following model classifies the current market price position as: Strong Downtrend. The current action for the model is considered to be: Hold – Maintain Short Position.
| SWISS FRANC Statistics | SPECULATORS | COMMERCIALS | SMALL TRADERS |
| – Percent of Open Interest Longs: | 18.3 | 71.2 | 10.5 |
| – Percent of Open Interest Shorts: | 53.3 | 18.3 | 28.5 |
| – Net Position: | -31,764 | 48,083 | -16,319 |
| – Gross Longs: | 16,626 | 64,665 | 9,535 |
| – Gross Shorts: | 48,390 | 16,582 | 25,854 |
| – Long to Short Ratio: | 0.3 to 1 | 3.9 to 1 | 0.4 to 1 |
| NET POSITION TREND: | | | |
| – Strength Index Score (3 Year Range Pct): | 0.0 | 100.0 | 3.1 |
| – Strength Index Reading (3 Year Range): | Bearish-Extreme | Bullish-Extreme | Bearish-Extreme |
| NET POSITION MOVEMENT INDEX: | | | |
| – 6-Week Change in Strength Index: | -43.7 | 43.2 | -20.9 |
Canadian Dollar Futures:
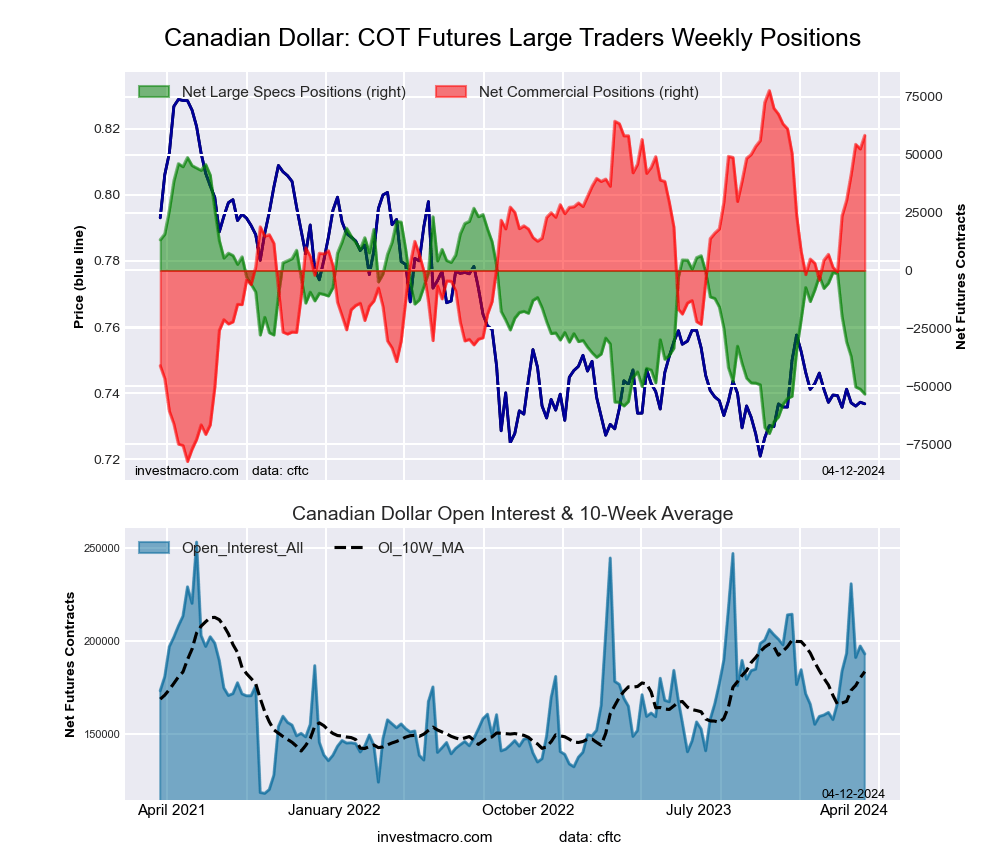 The Canadian Dollar large speculator standing this week totaled a net position of -53,385 contracts in the data reported through Tuesday. This was a weekly lowering of -2,162 contracts from the previous week which had a total of -51,223 net contracts.
This week’s current strength score (the trader positioning range over the past three years, measured from 0 to 100) shows the speculators are currently Bearish-Extreme with a score of 14.3 percent. The commercials are Bullish-Extreme with a score of 87.9 percent and the small traders (not shown in chart) are Bearish-Extreme with a score of 11.8 percent.
Price Trend-Following Model: Strong Downtrend
Our weekly trend-following model classifies the current market price position as: Strong Downtrend. The current action for the model is considered to be: Hold – Maintain Short Position.
| CANADIAN DOLLAR Statistics | SPECULATORS | COMMERCIALS | SMALL TRADERS |
| – Percent of Open Interest Longs: | 18.0 | 66.3 | 14.1 |
| – Percent of Open Interest Shorts: | 45.7 | 36.1 | 16.7 |
| – Net Position: | -53,385 | 58,340 | -4,955 |
| – Gross Longs: | 34,741 | 127,944 | 27,190 |
| – Gross Shorts: | 88,126 | 69,604 | 32,145 |
| – Long to Short Ratio: | 0.4 to 1 | 1.8 to 1 | 0.8 to 1 |
| NET POSITION TREND: | | | |
| – Strength Index Score (3 Year Range Pct): | 14.3 | 87.9 | 11.8 |
| – Strength Index Reading (3 Year Range): | Bearish-Extreme | Bullish-Extreme | Bearish-Extreme |
| NET POSITION MOVEMENT INDEX: | | | |
| – 6-Week Change in Strength Index: | -43.6 | 36.8 | -15.3 |
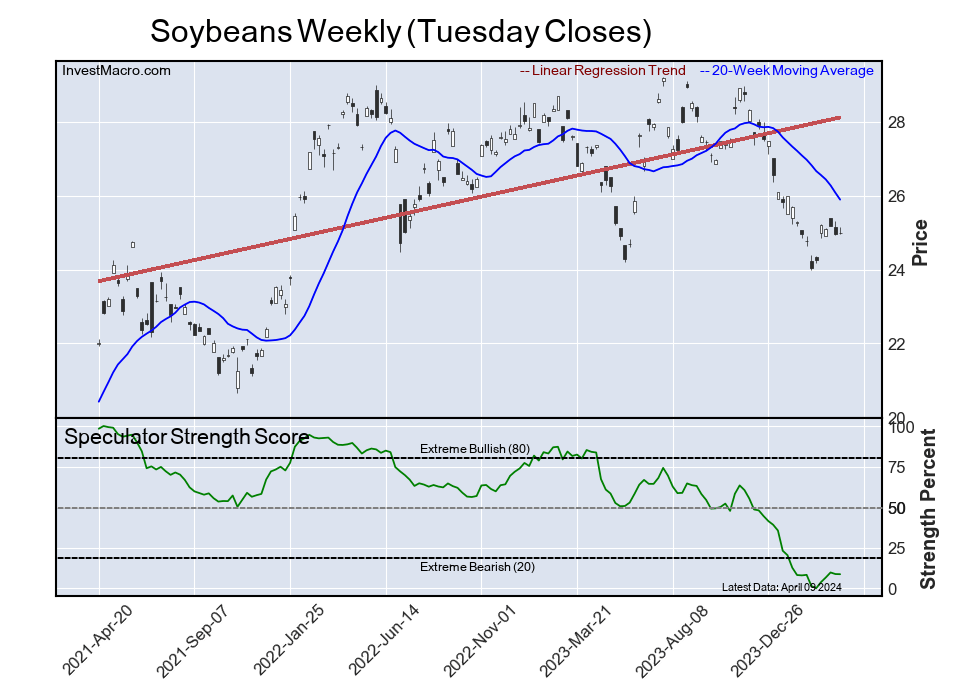
Australian Dollar Futures:
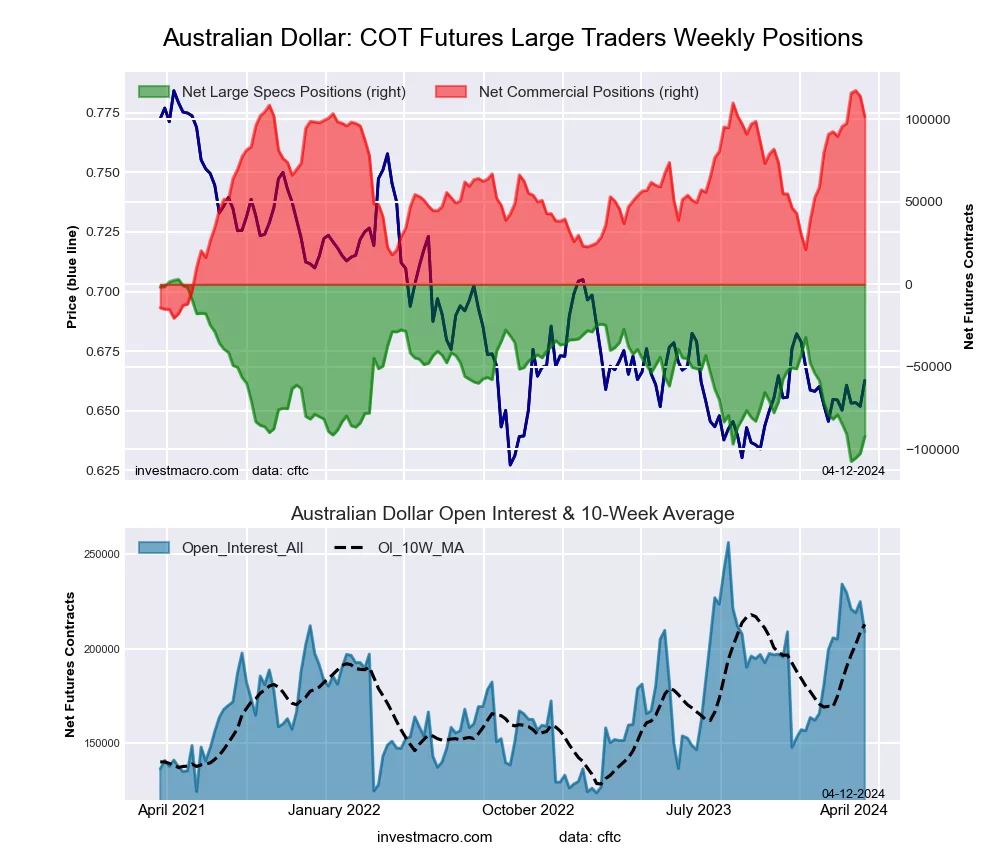 The Australian Dollar large speculator standing this week totaled a net position of -92,341 contracts in the data reported through Tuesday. This was a weekly lift of 10,344 contracts from the previous week which had a total of -102,685 net contracts.
This week’s current strength score (the trader positioning range over the past three years, measured from 0 to 100) shows the speculators are currently Bearish-Extreme with a score of 13.7 percent. The commercials are Bullish-Extreme with a score of 88.5 percent and the small traders (not shown in chart) are Bearish with a score of 30.9 percent.
Price Trend-Following Model: Strong Downtrend
Our weekly trend-following model classifies the current market price position as: Strong Downtrend. The current action for the model is considered to be: Hold – Maintain Short Position.
| AUSTRALIAN DOLLAR Statistics | SPECULATORS | COMMERCIALS | SMALL TRADERS |
| – Percent of Open Interest Longs: | 14.6 | 72.5 | 10.3 |
| – Percent of Open Interest Shorts: | 58.8 | 23.8 | 14.8 |
| – Net Position: | -92,341 | 101,610 | -9,269 |
| – Gross Longs: | 30,556 | 151,421 | 21,567 |
| – Gross Shorts: | 122,897 | 49,811 | 30,836 |
| – Long to Short Ratio: | 0.2 to 1 | 3.0 to 1 | 0.7 to 1 |
| NET POSITION TREND: | | | |
| – Strength Index Score (3 Year Range Pct): | 13.7 | 88.5 | 30.9 |
| – Strength Index Reading (3 Year Range): | Bearish-Extreme | Bullish-Extreme | Bearish |
| NET POSITION MOVEMENT INDEX: | | | |
| – 6-Week Change in Strength Index: | -11.9 | 8.6 | 3.4 |
New Zealand Dollar Futures:
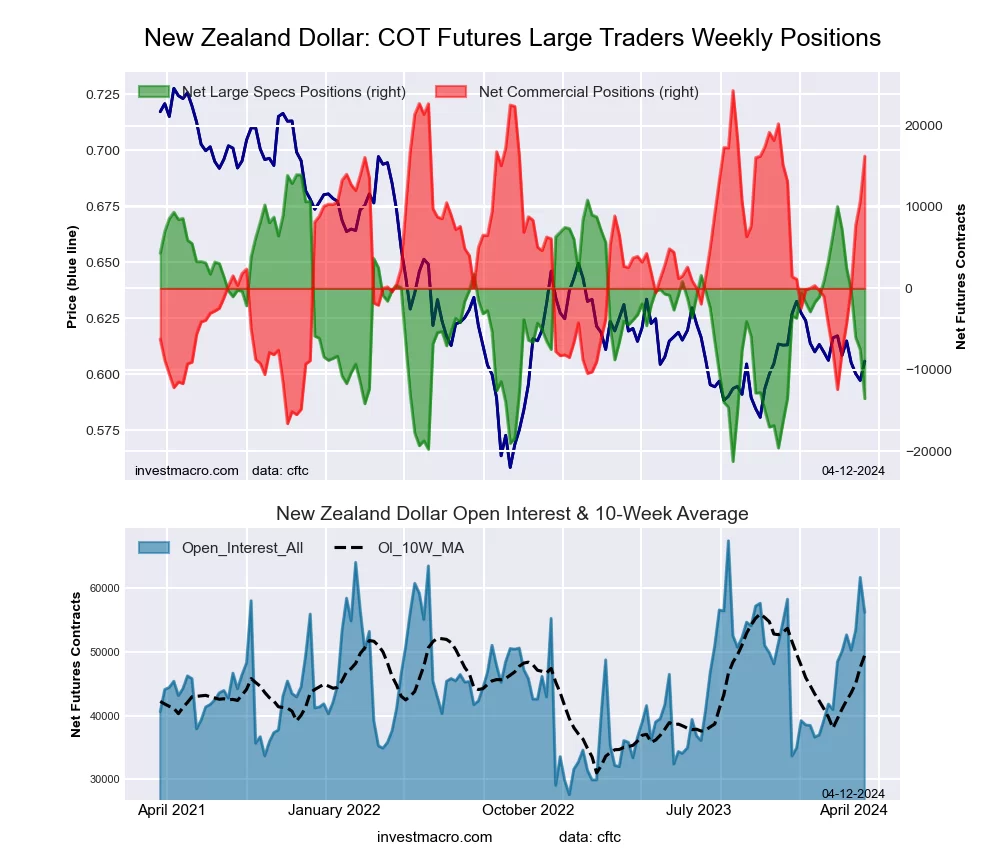 The New Zealand Dollar large speculator standing this week totaled a net position of -13,547 contracts in the data reported through Tuesday. This was a weekly fall of -6,019 contracts from the previous week which had a total of -7,528 net contracts.
This week’s current strength score (the trader positioning range over the past three years, measured from 0 to 100) shows the speculators are currently Bearish with a score of 21.9 percent. The commercials are Bullish-Extreme with a score of 80.3 percent and the small traders (not shown in chart) are Bearish-Extreme with a score of 19.5 percent.
Price Trend-Following Model: Strong Downtrend
Our weekly trend-following model classifies the current market price position as: Strong Downtrend. The current action for the model is considered to be: Hold – Maintain Short Position.
| NEW ZEALAND DOLLAR Statistics | SPECULATORS | COMMERCIALS | SMALL TRADERS |
| – Percent of Open Interest Longs: | 24.4 | 70.2 | 5.1 |
| – Percent of Open Interest Shorts: | 48.5 | 41.4 | 9.9 |
| – Net Position: | -13,547 | 16,239 | -2,692 |
| – Gross Longs: | 13,726 | 39,515 | 2,862 |
| – Gross Shorts: | 27,273 | 23,276 | 5,554 |
| – Long to Short Ratio: | 0.5 to 1 | 1.7 to 1 | 0.5 to 1 |
| NET POSITION TREND: | | | |
| – Strength Index Score (3 Year Range Pct): | 21.9 | 80.3 | 19.5 |
| – Strength Index Reading (3 Year Range): | Bearish | Bullish-Extreme | Bearish-Extreme |
| NET POSITION MOVEMENT INDEX: | | | |
| – 6-Week Change in Strength Index: | -67.0 | 70.0 | -65.2 |
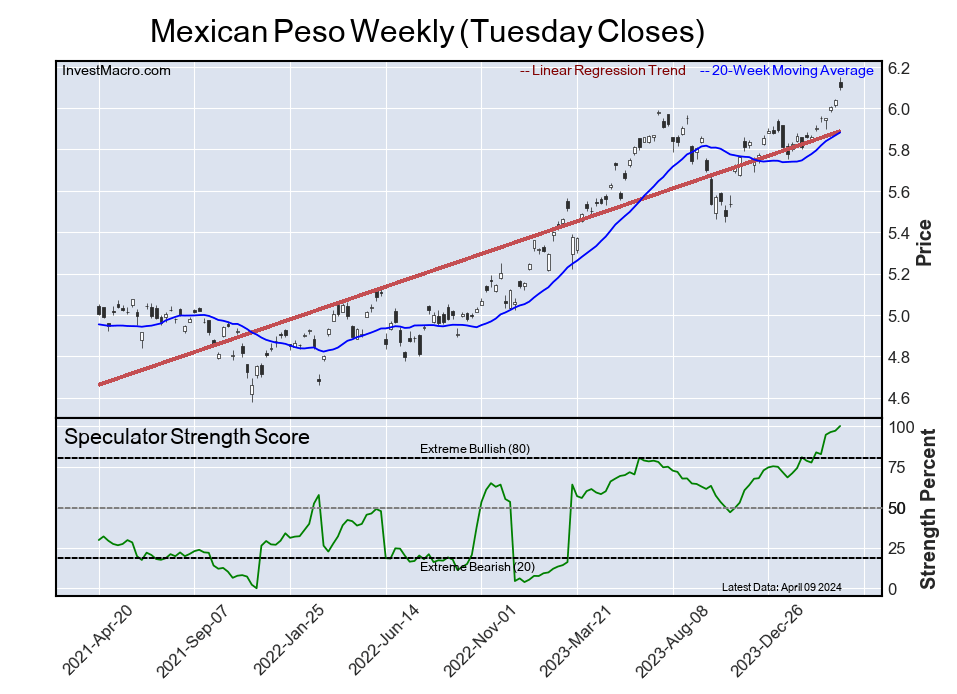
Mexican Peso Futures:
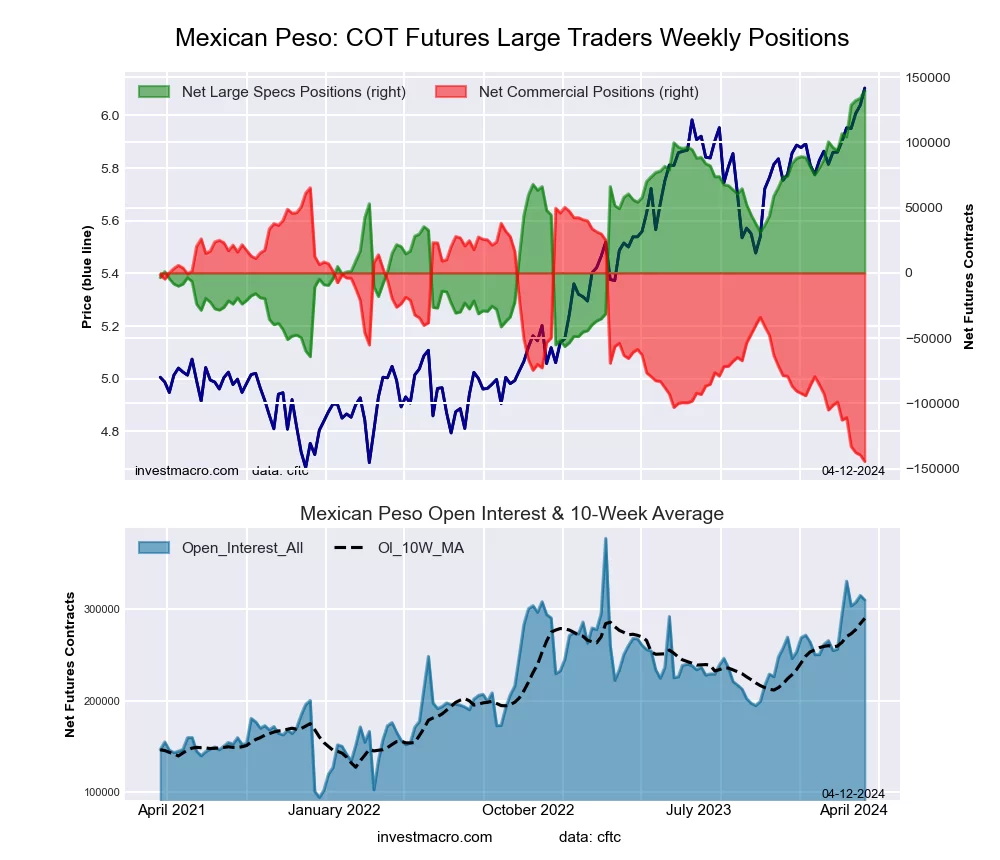 The Mexican Peso large speculator standing this week totaled a net position of 139,691 contracts in the data reported through Tuesday. This was a weekly boost of 5,961 contracts from the previous week which had a total of 133,730 net contracts.
This week’s current strength score (the trader positioning range over the past three years, measured from 0 to 100) shows the speculators are currently Bullish-Extreme with a score of 100.0 percent. The commercials are Bearish-Extreme with a score of 0.0 percent and the small traders (not shown in chart) are Bearish with a score of 41.6 percent.
Price Trend-Following Model: Strong Uptrend
Our weekly trend-following model classifies the current market price position as: Strong Uptrend. The current action for the model is considered to be: Hold – Maintain Long Position.
| MEXICAN PESO Statistics | SPECULATORS | COMMERCIALS | SMALL TRADERS |
| – Percent of Open Interest Longs: | 61.3 | 35.9 | 2.5 |
| – Percent of Open Interest Shorts: | 16.2 | 82.6 | 1.0 |
| – Net Position: | 139,691 | -144,453 | 4,762 |
| – Gross Longs: | 189,880 | 111,158 | 7,836 |
| – Gross Shorts: | 50,189 | 255,611 | 3,074 |
| – Long to Short Ratio: | 3.8 to 1 | 0.4 to 1 | 2.5 to 1 |
| NET POSITION TREND: | | | |
| – Strength Index Score (3 Year Range Pct): | 100.0 | 0.0 | 41.6 |
| – Strength Index Reading (3 Year Range): | Bullish-Extreme | Bearish-Extreme | Bearish |
| NET POSITION MOVEMENT INDEX: | | | |
| – 6-Week Change in Strength Index: | 22.5 | -21.7 | -2.0 |
Brazilian Real Futures:
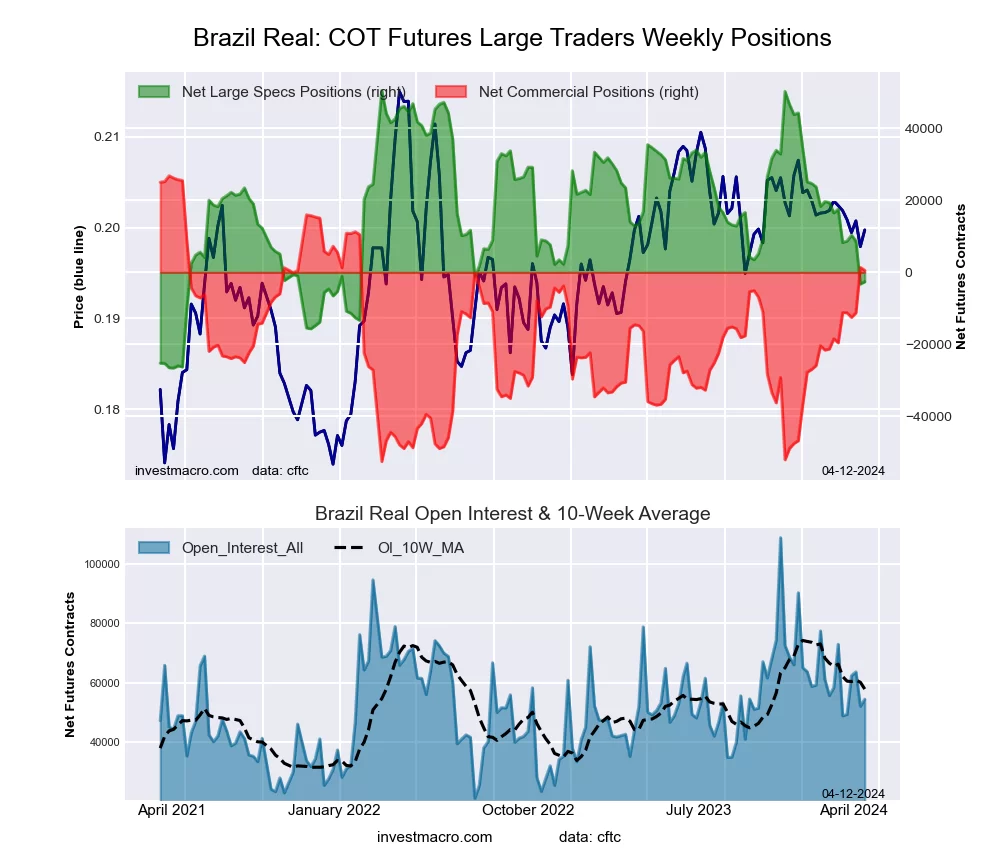 The Brazilian Real large speculator standing this week totaled a net position of -2,616 contracts in the data reported through Tuesday. This was a weekly rise of 645 contracts from the previous week which had a total of -3,261 net contracts.
This week’s current strength score (the trader positioning range over the past three years, measured from 0 to 100) shows the speculators are currently Bearish with a score of 30.8 percent. The commercials are Bullish with a score of 67.8 percent and the small traders (not shown in chart) are Bullish with a score of 53.9 percent.
Price Trend-Following Model: Strong Downtrend
Our weekly trend-following model classifies the current market price position as: Strong Downtrend. The current action for the model is considered to be: Hold – Maintain Short Position.
| BRAZIL REAL Statistics | SPECULATORS | COMMERCIALS | SMALL TRADERS |
| – Percent of Open Interest Longs: | 61.4 | 31.9 | 6.3 |
| – Percent of Open Interest Shorts: | 66.2 | 31.0 | 2.4 |
| – Net Position: | -2,616 | 531 | 2,085 |
| – Gross Longs: | 33,440 | 17,384 | 3,418 |
| – Gross Shorts: | 36,056 | 16,853 | 1,333 |
| – Long to Short Ratio: | 0.9 to 1 | 1.0 to 1 | 2.6 to 1 |
| NET POSITION TREND: | | | |
| – Strength Index Score (3 Year Range Pct): | 30.8 | 67.8 | 53.9 |
| – Strength Index Reading (3 Year Range): | Bearish | Bullish | Bullish |
| NET POSITION MOVEMENT INDEX: | | | |
| – 6-Week Change in Strength Index: | -26.2 | 25.7 | 0.2 |
Bitcoin Futures:
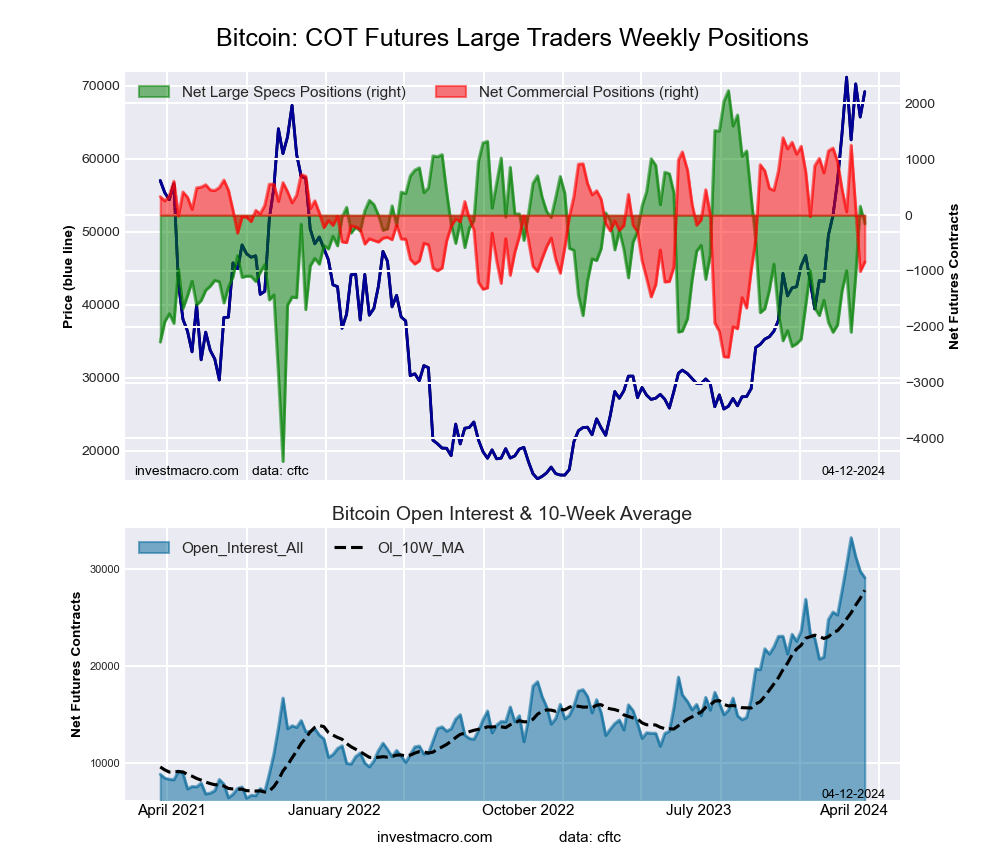 The Bitcoin large speculator standing this week totaled a net position of -153 contracts in the data reported through Tuesday. This was a weekly reduction of -313 contracts from the previous week which had a total of 160 net contracts.
This week’s current strength score (the trader positioning range over the past three years, measured from 0 to 100) shows the speculators are currently Bullish with a score of 64.1 percent. The commercials are Bearish with a score of 43.4 percent and the small traders (not shown in chart) are Bearish with a score of 35.5 percent.
Price Trend-Following Model: Uptrend
Our weekly trend-following model classifies the current market price position as: Uptrend. The current action for the model is considered to be: Hold – Maintain Long Position.
| BITCOIN Statistics | SPECULATORS | COMMERCIALS | SMALL TRADERS |
| – Percent of Open Interest Longs: | 81.1 | 5.3 | 5.8 |
| – Percent of Open Interest Shorts: | 81.6 | 8.2 | 2.4 |
| – Net Position: | -153 | -838 | 991 |
| – Gross Longs: | 23,572 | 1,544 | 1,699 |
| – Gross Shorts: | 23,725 | 2,382 | 708 |
| – Long to Short Ratio: | 1.0 to 1 | 0.6 to 1 | 2.4 to 1 |
| NET POSITION TREND: | | | |
| – Strength Index Score (3 Year Range Pct): | 64.1 | 43.4 | 35.5 |
| – Strength Index Reading (3 Year Range): | Bullish | Bearish | Bearish |
| NET POSITION MOVEMENT INDEX: | | | |
| – 6-Week Change in Strength Index: | 27.3 | -45.8 | -0.4 |
Article By InvestMacro – Receive our weekly COT Newsletter
*COT Report: The COT data, released weekly to the public each Friday, is updated through the most recent Tuesday (data is 3 days old) and shows a quick view of how large speculators or non-commercials (for-profit traders) were positioned in the futures markets.
The CFTC categorizes trader positions according to commercial hedgers (traders who use futures contracts for hedging as part of the business), non-commercials (large traders who speculate to realize trading profits) and nonreportable traders (usually small traders/speculators) as well as their open interest (contracts open in the market at time of reporting). See CFTC criteria here.