Archive for Financial News – Page 2

Gold hits record high amid growing geopolitical tensions

By RoboForex Analytical Department

Gold prices have soared past 2400.00 USD, reaching a new record high on Friday. This marks the fifth consecutive week of gains for the precious metal, fuelled by increasing market demand for “safe-haven” assets amid escalating geopolitical tensions and uncertain global economic conditions.

The recent sharp increase in geopolitical tensions, particularly in the Middle East, has overshadowed optimistic remarks from Federal Reserve officials. The Fed’s monetary authorities are currently inclined towards gradual interest rate cuts throughout the year, given the persistent strength of inflation and the robust state of the US economy. However, the deepening conflict, especially with Iran’s involvement, has heightened concerns about the stability of the region, diminishing hopes for a quick diplomatic resolution.

Gold’s role as a defensive asset has been reinforced under these circumstances, with expectations that its price could climb even higher if the Middle East conflict continues escalating. Investor interest in gold will likely to persist as long as the situation remains volatile.

The focus on gold as a safe investment has largely overshadowed other economic indicators, including fluctuations in the value of the US dollar and other currencies.

Technical analysis of XAU/USD

On the H4 chart of XAU/USD, a broad consolidation range has formed around 2379.70. Exiting this range upward opens the potential to target 2437.00. Following this, a correction to the level of 2323.23 might commence, possibly extending to 2183.42. This scenario is supported by the MACD indicator, with its signal line positioned above zero but poised to decline towards new lows.

On the H1 chart, XAU/USD exhibits a diverging “Triangle” formation around 2379.70. A downward movement to 2342.42 could occur, followed by an upward trajectory to 2437.00. Upon reaching this peak, a decline to 2323.23 is anticipated. This corrective movement is the initial target. The Stochastic oscillator, with its signal line currently above 20, is expected to rise towards 80, suggesting potential upward movements within this framework.


Disclaimer

Any forecasts contained herein are based on the author’s particular opinion. This analysis may not be treated as trading advice. RoboForex bears no responsibility for trading results based on trading recommendations and reviews contained herein.

The US natural gas prices fell to a 2-month low. A drop in the technology sector on Wednesday had a negative impact on the broad market

By JustMarkets

At Monday’s close, the Dow Jones Index (US30) decreased by 0.12%, while the S&P 500 Index (US500) was down 0.58%. The NASDAQ Technology Index (US100) closed yesterday negative 1.15%. A drop in chip company stocks negatively impacted the overall market on Wednesday after ASML Holding NV reported first-quarter net sales below consensus. Geopolitical risks in the Middle East continue to weigh on equities amid concerns that Israel will retaliate after Iran fired a barrage of missiles and drones at Israel over the weekend.

Equity markets in Europe mostly went up yesterday. Germany’s DAX (DE40) added 0.02%, France’s CAC 40 (FR40) closed up 0.62%, Spain’s IBEX 35 (ES35) rose by 1.02%, and the UK’s FTSE 100 (UK100) closed positive 0.35% on Wednesday. European equity markets opened higher on Thursday amid improving risk sentiment, while investors ignored another tech-driven sell-off on Wall Street.

Several ECB officials made statements yesterday. Cipollone of the ECB executive board said that if incoming data confirms that inflation is returning to the 2% target, removing some of the restrictive measures introduced in 2023 would be appropriate. This view was also supported by the representative of the ECB’s Governing Council, Centeno. He added that it was time for the ECB to change monetary policy due to weak economic growth and progress on disinflation. But there was a counter-argument from ECB Governing Council spokesman Holzmann, who said he was not fully convinced that the ECB should start cutting interest rates in June, citing the results of the Eurozone wage debate and rising tensions in the Middle East, which poses risks to inflation.

WTI crude prices held below $83 a barrel on Thursday, having lost more than 3% in the previous session, amid signs that US oil supply remains strong and demand is rising. EIA data showed that US crude inventories rose by 2.735 million barrels last week, increasing for the fourth week and beating market expectations for a 1.6 million barrel increase. Meanwhile, the US said it would reimpose oil sanctions against Venezuela in response to President Nicolas Maduro’s failure to fulfill his campaign pledges. European Union leaders also discussed new restrictions on Iran following its attack on Israel over the weekend. Any restrictions will keep oil prices from falling.

The US natural gas prices fell more than 3.5% to below $1.7 per MMBtu, the lowest in two months, due to a sharp decline in gas going to LNG export plants and a large surplus in storage. In addition, gas inventories are expected to be 36% above the seasonal average due to a combination of high initial inventory levels and a mild winter.

Asian markets traded without a single dynamic yesterday. Japan’s Nikkei 225 (JP225) was down 1.32%, China’s FTSE China A50 (CHA50) was up 0.79%, Hong Kong’s Hang Seng (HK50) added 0.02%, and Australia’s ASX 200 (AU200) was negative 0.09%.

On Wednesday, China’s central bank said it will maintain a cautious monetary policy and ensure the efficient utilization of financial resources. It added that the authorities will ensure that the yuan’s movement is mainly driven by supply and demand. Meanwhile, economists forecast that China’s central bank will cut the RRR by 25 bps in Q3 2024 after it cut the rate by 50 bps earlier this year, the biggest cut in 2 years.

Australia’s labor market report came out mixed. Australia’s seasonally adjusted unemployment rate rose to 3.8% in March 2024 from February’s five-month low of 3.7% but below market forecasts of 3.9%. The number of unemployed increased by 20.6 thousand to 569.9 thousand, while those looking for work rose by 19.3 thousand to 371.3 thousand.

S&P 500 (US500) 5,022.21 −29.20 (−0.58%)

Dow Jones (US30) 37,735.11 −45.66 (−0.12%)

DAX (DE40) 17,770.02 +3.79 (+0.021%)

FTSE 100 (UK100) 7,847.99 +27.63 (+0.35%)

USD Index 105.86 -0.09 (-0.09%)

Important events today:
  • – Australia Unemployment Rate (m/m) at 04:30 (GMT+3);
  • – US Initial Jobless Claims (w/w) at 15:30 (GMT+3);
  • – US Philadelphia Fed Manufacturing Index (m/m) at 15:30 (GMT+3);
  • – US Existing Home Sales (m/m) at 17:00 (GMT+3);
  • – US Natural Gas Storage (w/w) at 17:30 (GMT+3).

By JustMarkets


This article reflects a personal opinion and should not be interpreted as an investment advice, and/or offer, and/or a persistent request for carrying out financial transactions, and/or a guarantee, and/or a forecast of future events.

Target Thursdays: Cocoa, Bitcoin and USDCHF hit targets!

By ForexTime

  • Cocoa “throwback” rewards bears
  • Bitcoin bears bag 50,000 points!
  • USDCHF secures all bearish targets

Geopolitical risks, key economic data, and big bank earnings have made this an eventful week for markets.

And we could see more action as anticipation mounts ahead of the upcoming Bitcoin halving.

Here are how these discussed instruments performed this week:


     1) Cocoa hits all-time high

  • Where and when was Target Price (TP) published?

It was another week another all-time high for FXTM’s new commodity – Cocoa.

However, we cautioned that a “technical throwback could be in the works…with key support at $10717, $10485…)

Note: A technical throwback is when prices slip back towards a breakout level after breaking resistance.


  • What happened since TP was published?

After hitting an all-time high at $11345.56 on Monday, prices tumbled over 8% on Tuesday amid profit taking and concerns over global demand negatively impacted by record cocoa prices.


  • How much in potential profits?

Traders who entered at Monday’s closing price around $11120 and exited at the $10485 support level would have caught a 5.7% move to the downside.

     2) Bitcoin: Halving vs Geopolitics

  • Where and when was Target Price (TP) published?

In our trade of the week article published on Monday, 15th April:

“Prices seem to be under pressure following the sharp selloff witnessed on Saturday. Should $65000 prove to be reliable resistance, this could trigger a selloff towards $61500 and $60000.”


  • What happened since TP was published?

Bitcoin along with other altcoins were hit by escalating geopolitical tensions in the Middle East.

The “OG” crypto dropped below $60,000 for the first time in more than a month amid profit-taking and risk aversion.

Note: The upcoming halving is a significant event for the crypto space and spark volatility.


  • How much in potential profits?

A whopping 50,000 points for traders who shorted Bitcoin from the $65000 level.


       3) USDCHF hits all bearish targets

  • Where and when was Target Price (TP) published?

This technical scenario (USDCHF) is based on the FXTM Signals that are posted twice a day (before the London and New York sessions) for all FXTM clients to follow.

It can be found in the MyFXTM profile under Trading Services… FXTM Trading Signals.


  • What happened since TP was published?

The USDCHF fell this morning as the Swiss Franc gained against most G10 currencies.


  • How much in potential profits?

USDCHF has hit all its profit targets.

Traders who entered at 0.90956 and exited at the final target level of 0.90866 would have gained roughly 10 pips.

Feel like you missed out on these profits?

You can keep following our “Daily Market Analysis” for fresh trading ideas and opportunities across global financial markets.


Forex-Time-LogoArticle by ForexTime

ForexTime Ltd (FXTM) is an award winning international online forex broker regulated by CySEC 185/12 www.forextime.com

British Pound shows signs of recovery amid favourable inflation data

By RoboForex Analytical Department

The British pound sterling is showing signs of recovery, bouncing back from a five-month low, with GBP/USD stabilising around the 1.2470 mark on Thursday. This rebound is attributed to the release of UK inflation data, suggesting a possible monetary policy easing by the Bank of England (BoE).

The UK’s consumer price index (CPI) slowed to 3.2% year-on-year in March, down from 3.4% in February, marking the lowest inflation rate in two and a half years. This slowdown has raised investor optimism regarding potential policy easing by the BoE, particularly since core inflation has also dropped to its lowest since mid-2021. However, persistent inflation in the services sector may lead to cautious deliberation among certain members of the monetary committee.

Meanwhile, representatives from the US Federal Reserve have reiterated that US interest rates are likely to remain high for an extended period. In contrast, the BoE is perceived as relatively stable, potentially initiating monetary policy easing by summer.

The first quarter saw significant pressures from the tight employment market and shocks from rising energy prices, which initially suggested that the BoE might follow the European Central Bank (ECB) and the Fed in lowering interest rates. However, market conditions have shifted considerably. Exchange analysts now anticipate that the ECB might cut interest rates by June, the BoE by September, and the Fed only in Q4.

Technical analysis of GBP/USD

The H4 chart for GBP/USD indicates that after forming a consolidation range of around 1.2547, the pair has reached the target of 1.2450 with a downward exit. A new consolidation range is currently forming above this level. A break below this range may drive prices lower to 1.2380, with a subsequent correction to retest 1.2547 (testing from below) before a possible continuation to 1.2200. This bearish scenario is supported by the MACD oscillator, whose signal line is below zero and is trending downwards.

On the H1 chart, the GBP/USD has completed a decline to 1.2406 and is currently undergoing a correction to 1.2491. Following this correction, a new decline to 1.2381 is anticipated. The Stochastic oscillator, currently above 80, is poised for a sharp decline to the 20 mark, reinforcing the likelihood of further downward movement in the short term.

Disclaimer

Any forecasts contained herein are based on the author’s particular opinion. This analysis may not be treated as trading advice. RoboForex bears no responsibility for trading results based on trading recommendations and reviews contained herein.

Indices decline amid hawkish comments from the Fed. Investors are waiting for Israel’s answer

By JustMarkets

At Monday’s close, the Dow Jones Index (US30) added 0.17%, while the S&P 500 Index (US500) was down 0.21%. The NASDAQ Technology Index (US100) closed negative 0.12% yesterday. The Fed’s hawkish comments on Tuesday pushed 10-year T-note yields to a 5-month high and negatively impacted equities. The US Fed Chairman Jerome Powell said yesterday that given the strength of the labor market and progress on inflation so far, it is appropriate to give restrictive policy additional time to work. In addition, Fed Vice Chairman Jefferson added that if incoming data indicate that inflation is more resilient, it would be appropriate to maintain the current restrictive policy for a longer period. Currently, markets expect only 40 basis points of easing from the Fed this year, down significantly from 160 basis points at the beginning of the year. Markets are pricing in the chances of a rate cut of 25 bps. Up to 3% will be at the next FOMC meeting on May 1, and 20% will be at the June 12 meeting.

Geopolitical risks in the Middle East continue to weigh on equities amid concerns that Israel will retaliate after Iran fired a barrage of rockets and drones at Israel over the weekend. Israel’s military cabinet postponed a meeting scheduled for Tuesday to decide on retaliatory measures.

The International Monetary Fund raised its 2024 global GDP forecast to 3.2% from its January forecast of 3.1%.

Equity markets in Europe mostly went up yesterday. Germany’s DAX (DE40) fell by 1.44%, France’s CAC 40 (FR40) closed down 1.40%, Spain’s IBEX 35 (ES35) lost 1.50%, and the UK’s FTSE 100 (UK100) closed negative 1.82% on Tuesday.

German economic growth expectations in the ZEW survey rose by 11.2 to a two-year high 42.9, beating expectations of 35.5. ECB President Lagarde said yesterday that unless there are major shocks to developments, the ECB is approaching a point where the bank will have to moderate its restrictive monetary policy. Lagarde also added that this will likely happen in a fairly short period. ECB Governing Council representative Makhlouf provided more specificity, saying that the ECB could cut interest rates at its next meeting in June if the upward trend in inflation continues. Swaps put the odds of a 25 bps ECB rate cut at its next meeting on June 6 at 87%.

WTI crude futures fell as low as $85 a barrel on Wednesday, declining for the third consecutive session. Economic uncertainty in China, a major oil importer, and a delayed US interest rate cut weighed on the demand outlook. However, given tensions in the Middle East and considering OPEC+ production cuts, the overall fundamental backdrop points to further gains in oil prices.

Asian markets were predominantly down yesterday. Japan’s Nikkei 225 (JP225) was down 1.94%, China’s FTSE China A50 (CHA50) lost 0.40%, Hong Kong’s Hang Seng (HK50) decreased by 2.12% and Australia’s ASX 200 (AU200) was negative 1.81%.

The New Zealand dollar rose to $0.59 after data showed that the country’s inflation rate eased to 4% y/y in the first quarter, the lowest since June 2021. The reading matched economists’ expectations but exceeded the Reserve Bank of New Zealand’s (RBNZ) forecast of 3.8% y/y. Earlier this month, the RBNZ kept the rate unchanged for the sixth consecutive meeting as policymakers sought to further ease capacity and inflation pressures despite data pointing to weakening economic activity.

Japan posted a trade deficit for the third consecutive fiscal year as the cost of energy and other imported goods rose and the yen remained weak.

Westpac forecasts Australian GDP growth to remain modest at 1.6% in 2024, down from a soft 1.5% a year earlier. This is well below Australia’s “trend” growth rate of around 2.5%.

S&P 500 (US500) 5,061.82 −61.59 (−1.20%)

Dow Jones (US30) 37,735.11 −248.13 (−0.65%)

DAX (DE40) 18,026.58 +96.26 (+0.54%)

FTSE 100 (UK100) 7,965.53 −30.05 (−0.38%)

USD Index 106.35 +0.14 (+0.13%)

Important events today:
  • – New Zealand Consumer Price Index (q/q) at 01:45 (GMT+3);
  • – Japan Trade Balance (m/m) at 02:50 (GMT+3);
  • – UK Consumer Price Index (m/m) at 09:00 (GMT+3);
  • – UK Producer Price Index (m/m) at 09:00 (GMT+3);
  • – Eurozone Consumer Price Index (m/m) at 12:00 (GMT+3);
  • – US Crude Oil Reserves (w/w) at 17:30 (GMT+3);
  • – UK BoE Gov Bailey Speaks at 19:00 (GMT+3).

By JustMarkets


This article reflects a personal opinion and should not be interpreted as an investment advice, and/or offer, and/or a persistent request for carrying out financial transactions, and/or a guarantee, and/or a forecast of future events.

EURGBP: Slams into support on hot UK inflation

By ForexTime 

  • Pound boosted by sticky CPI data
  • EURGBP drops over 20 pips
  • Eurozone CPI match initial estimates
  • Watch out for BoE Bailey’s speech
  • Key levels at 50-day SMA, 0.8530 & 0.8505

EURGBP was injected with fresh volatility on Wednesday after UK inflation fell less than expected in March.

The minor currency pair tumbled over 20 pips, dipping below the 0.8530 support as cooling BoE rate cut bets supported the British Pound. More currency movements could be on the horizon, especially when factoring in BoE Governor Andrew Bailey’s speech later today.

Interestingly, traders are now pricing in a 67% probability of a 25-basis point cut by August, with a move fully priced in by November 2024.

Sterling is up against most G10 currencies this week and may extend gains if upcoming data supports the case for “higher for longer” rates.

In other news, there were no changes to the initial estimates of the Eurozone March inflation figures with core CPI at 2.9% YoY. This data is likely to reinforce expectations around the ECB cutting interest rates in June.

Given how the ECB is expected to start cutting rates before the BoE, the EURGBP may remain pressured in the medium to longer term.

Regarding the technicals, prices are trading below the 50-day SMA with 0.8530 acting as a key support and level of interest.

The Average Directional Movement Index (ADX), an indicator that shows the strength of the current market trend signals further downside for the EURGBP.

  • A breakdown below 0.8530 may see 0.8505 along the upward-sloping trendline act as support.
  • Should prices push higher, the 50-day Simple moving average may act as near-term resistance at 0.8548.
  • Above the 50-day SMA is the 21-day Simple moving average at 0.8558.

Bloomberg’s FX model forecasts an 82% chance that EURGBP will trade within the 0.84777 – 0.85965 range over the next one week.


Forex-Time-LogoArticle by ForexTime

ForexTime Ltd (FXTM) is an award winning international online forex broker regulated by CySEC 185/12 www.forextime.com

Brent crude prices dip amid concerns over global demand

By RoboForex Analytical Department

Brent crude oil prices decreased slightly on Wednesday, falling to 89.50 USD per barrel. The decline is primarily attributed to concerns over global oil demand, particularly given the economic indicators coming out of China, the world’s largest energy importer. Although China’s GDP grew faster than expected in Q1 2024, other critical economic parameters such as property investment, retail sales, and industrial production remain subdued, dampening overall demand prospects.

According to the American Petroleum Institute (API), US crude oil inventories have risen more than expected, adding to the complexities. While such an increase in inventories typically might bolster oil prices, the prevailing anxiety over global demand continues to exert downward pressure.

Political developments in the Middle East also remain a focal point for the oil markets. A high-level meeting involving Western nations and Israel was postponed to Wednesday, with efforts expected to focus on averting a significant escalation in regional conflicts. Given the region’s important global oil supply, such disputes are crucial for the oil sector.

Later today, the US Department of Energy is scheduled to release updated statistics on crude oil and petroleum product inventories for the week, which could influence market volatility.

Technical analysis of Brent

On the H4 chart, Brent crude has formed a consolidation range around the 88.30 USD level, indicating a lack of a clear trend. If there is an upward breakout from this range, a rise to 92.00 USD could be anticipated. This could be followed by a potential correction to 84.50 USD and further growth to 94.00 USD, potentially extending to 97.00 USD. The MACD indicator supports this scenario, with the signal line nearing zero and expected to rebound upwards, suggesting continued growth.

On the H1 chart, a growth impulse to 90.20 USD has been completed, and a corrective movement to 88.80 USD is underway. Once this correction is completed, a new growth wave towards 92.00 USD is anticipated, likely followed by a new corrective phase. The Stochastic oscillator, positioned below 20, prepares for a rebound, supporting the likelihood of further upward movement.


Disclaimer

Any forecasts contained herein are based on the author’s particular opinion. This analysis may not be treated as trading advice. RoboForex bears no responsibility for trading results based on trading recommendations and reviews contained herein.

Stock indices sell-off amid rising geopolitical tensions in the Middle East. China’s GDP grew the most in a year

By JustMarkets

At Monday’s close, the Dow Jones (US30) Index decreased by 0.65%, while the S&P 500 (US500) Index was down 1.20%. The NASDAQ Technology Index (US100) closed yesterday negative at 1.79%. The US dollar initially declined on Monday amid lower liquidity demand, as stocks rose after geopolitical concerns eased amid hopes that diplomatic efforts would curb the conflict between Iran and Israel. However, the US dollar jumped sharply in the US session after March, and US retail sales rose more than expected, a hawkish factor for Fed policy. In addition, the inability of equities to hold on to the early rally caused additional liquidity demand for the dollar. That said, last night, Israel’s defense minister said that Israel has no choice but to retaliate against Iran for its drone missile attack on Israel over the weekend.

Salesforce (CRM) shares fell more than 7%. They topped the list of losers in the S&P 500 and Dow Jones Industrials following a Bloomberg report that the company is interested in acquiring Informatica, which analysts say could attract regulatory attention. Atlassian (TEAM) slid more than 7% and topped the list of losers in the Nasdaq 100 after Mizuho Securities cut its price target on the company’s shares to $240 from $265. Tesla (TSLA) closed down more than 5%, topping the Nasdaq 100 losers list, after CEO Musk said the company will cut its global workforce by more than 10% as demand for electric vehicles slows.

Equity markets in Europe mostly went up yesterday. Germany’s DAX (DE40) rose by 0.54% (up -1.28% on the week), France’s CAC 40 (FR40) closed higher by 0.43%, Spain’s IBEX 35 (ES35) closed at its opening price, and the UK’s FTSE 100 (UK100) closed negative 0.38% on Monday. European stock markets opened lower on Tuesday as strong US retail sales data reinforced expectations that the Federal Reserve will postpone interest rate cuts. Investors are also keeping a close eye on developments in the Middle East amid concerns that an Iranian attack on Israel over the weekend could lead to a wider conflict in the region.

The latest data showed an unexpected increase in the UK unemployment rate to 4.2%, exceeding expectations of 4.0%, while wage growth slowed gradually. Traders adjusted their forecasts for the Bank of England and the Federal Reserve to cut interest rates this year, driven by strong US inflation figures. The Bank of England rate is expected to fall to 4.75% by the end of 2024 from the current 5.25%, a significant change from the previous forecast that suggested a rate cut to 4.5% by December.

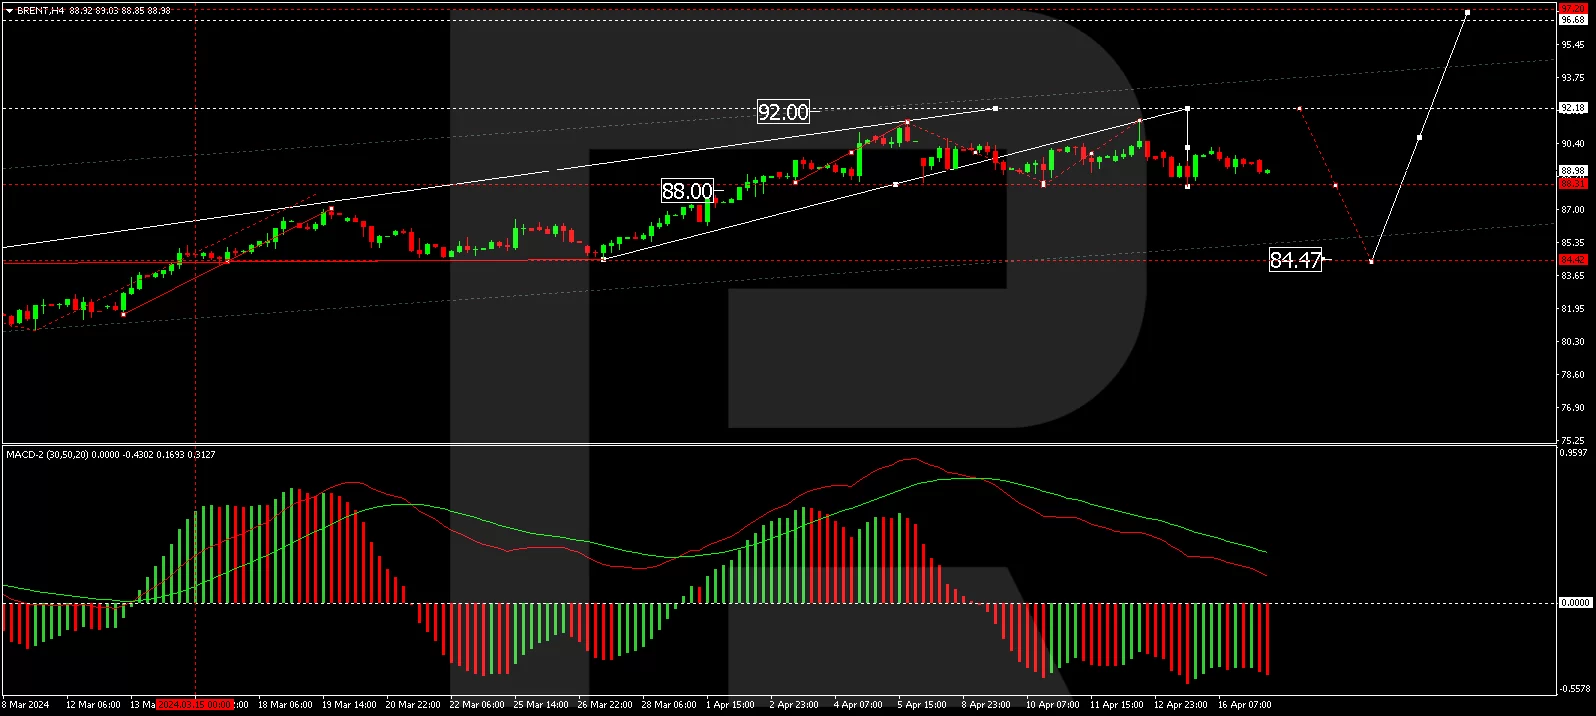
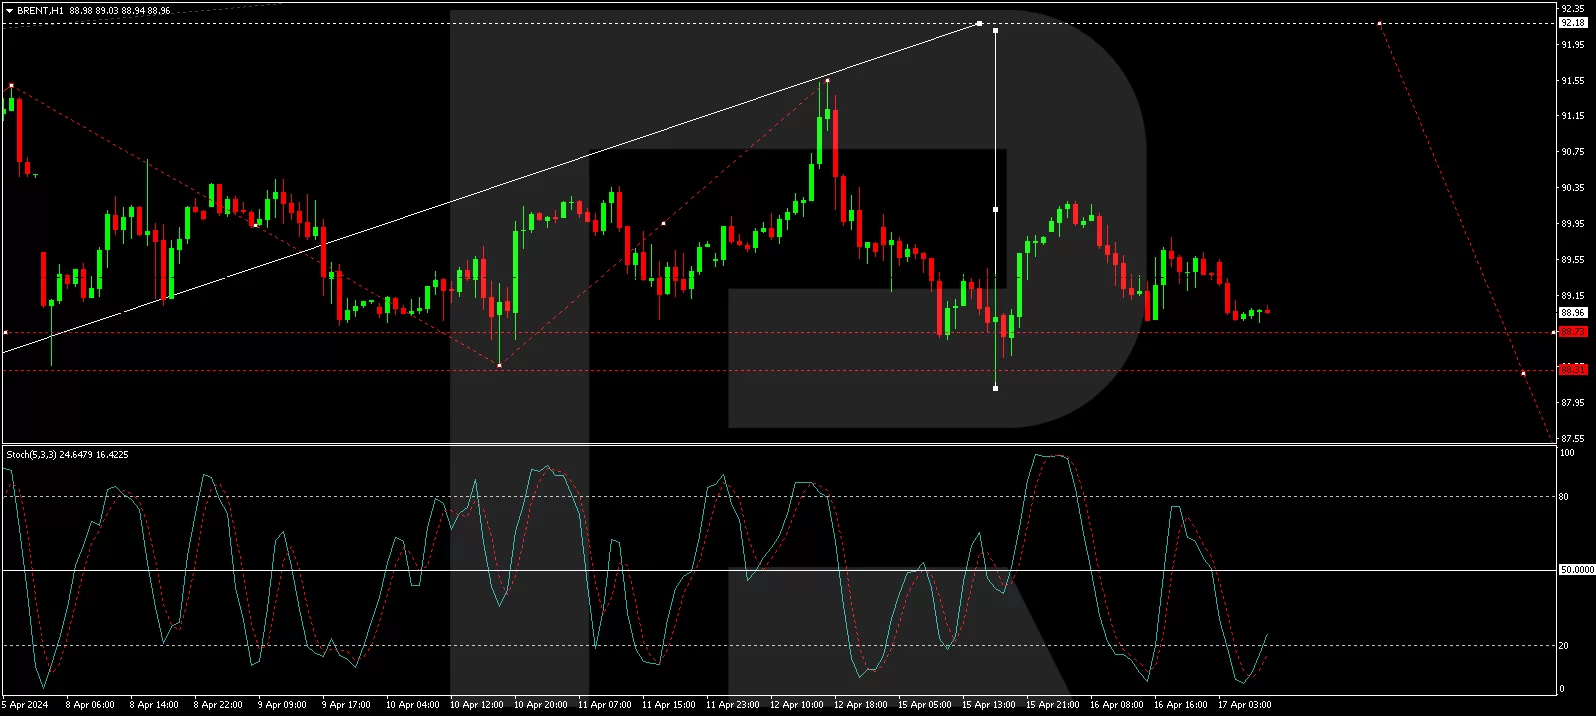
WTI crude oil prices rose to around $86 a barrel on Tuesday, reversing losses from the previous session as investors await Israel’s response. Israel’s military chief said his country would respond to the attack, with reports suggesting they were targeting key targets in Iran. Iran is a leading OPEC member, producing more than 3 million barrels of crude oil daily.

Asian markets were predominantly down. Japan’s Nikkei 225 (JP225) was down 0.65% yesterday, China’s FTSE China A50 (CHA50) was up 2.7%, Hong Kong’s Hang Seng (HK50) lost 0.99% yesterday, and Australia’s ASX 200 (AU200) was negative 0.75%.

Asian stocks fell sharply on Tuesday, following an overnight decline on Wall Street amid lingering concerns over geopolitical tensions in the Middle East and a longer-term interest rate hike in the US. However, losses in Chinese stocks were slightly less than their peers as gross domestic product (GDP) data showed the country’s economy grew more than expected in the first quarter. China’s economy grew 5.3% y/y in the first quarter of 2024, exceeding market forecasts of 5.0% and following 5.2% growth in the previous period. This was the sharpest annual growth since Q2 2023, helped by continued supportive measures from Beijing, while the Lunar New Year festival also boosted consumer spending. Fixed asset investment rose by 4.5% in the first three months of the year, the highest in three years and above the consensus forecast of 4.3%. Meanwhile, March data showed that industrial production and retail sales rose less than expected, underscoring the need for further policy easing for the economy. At the same time, the unemployment rate came in at 5.2% in March, remaining near February’s 7-month high of 5.3%.

S&P 500 (US500) 5,061.82 −61.59 (−1.20%)

Dow Jones (US30) 37,735.11 −248.13 (−0.65%)

DAX (DE40) 18,026.58 +96.26 (+0.54%)

FTSE 100 (UK100) 7,965.53 −30.05 (−0.38%)

USD Index 106.35 +0.14 (+0.13%)

Important events today:
  • – China GDP (q/q) at 05:00 (GMT+3);
  • – China Industrial Production (y/y) at 05:00 (GMT+3);
  • – China Unemployment Rate (m/m) at 05:00 (GMT+3);
  • – China Retail Sales (m/m) at 05:00 (GMT+3);
  • – UK Average Earnings Index (m/m) at 09:00 (GMT+3);
  • – UK Claimant Count Change (m/m) at 09:00 (GMT+3);
  • – UK Unemployment Rate (m/m) at 09:00 (GMT+3);
  • – German ZEW Economic Sentiment (m/m) at 12:00 (GMT+3);
  • – Eurozone ZEW Economic Sentiment (m/m) at 12:00 (GMT+3);
  • – Eurozone Trade Balance (m/m) at 12:00 (GMT+3);
  • – Canada Consumer Price Index (m/m) at 15:30 (GMT+3);
  • – US Building Permits (m/m) at 15:30 (GMT+3);
  • – US Industrial Production (m/m) at 16:15 (GMT+3);
  • – UK BoE Gov Bailey Speaks at 20:00 (GMT+3);
  • – Canada BoC Gov Macklem Speaks at 20:15 (GMT+3);
  • – US Fed Chair Powell Speaks at 20:15 (GMT+3).

By JustMarkets


This article reflects a personal opinion and should not be interpreted as an investment advice, and/or offer, and/or a persistent request for carrying out financial transactions, and/or a guarantee, and/or a forecast of future events.

New FXTM commodity hits all-time high!

By ForexTime 

  • FXTM launches 10 new commodities
  • Cocoa hits fresh record high
  • Biggest gainer YTD in FXTM’s commodity universe
  • Prices up over 150% since the start of 2024
  • Firmly bullish on H4/H1 timeframe

This week, FXTM launched 10 new commodities!

This now brings FXTM’s tally to 13 different commodities to trade from.

And Cocoa has certainly hijacked our attention, jumping to a fresh all-time high on Monday.

The commodity posted its highest-ever intraday price at $11345.56 (Monday, 15th April)!

Note: Cocoa is priced per metric ton (MT)

Before we take a deep dive into why Cocoa prices are skyrocketing, let’s cover some basics:

What is Cocoa?

Cocoa is refined from the seeds of a cacao tree, which is a key ingredient in chocolate production.

What does FXTM’s Cocoa track?

FXTM’s Cocoa tracks the ICE US Cocoa futures which is the world benchmark for the global cocoa market.

The lowdown…

Cocoa prices have seen extraordinary gains in recent months!

The commodity is up over 150% year-to-date as the industry faces a perfect storm.

A combination of bad weather, crop disease, and rising freight costs have led to sudden and aggressive increases in the price of Cocoa.

The bigger picture

Did you know the world’s two biggest producers of cocoa beans are based in West Africa?

The Ivory Coast and Ghana are the big boys when it comes to production, accounting for more than 50% of the world’s cocoa.

A weather phenomenon known as El Nino has been causing drier weather for these countries, negatively impacting harvest yields as a result.

It does not end here

Meanwhile, the world’s appetite for chocolate remains robust!

According to the International Cocoa Organization’s latest forecast for the 2023/2024 cocoa year, demand is set to outstrip supply by more than 300,000 tonnes.

What does this mean?

This could mean more gains for cocoa if demand continues to exceed supply which is anticipated to decline by almost 11% this year.

How about the technicals?

Prices are firmly bullish on the daily charts with the path of least resistance pointing north.

However, a technical throwback could be in the works before bulls jump back into the scene.

Key support levels can be found at $10717, 10485 and the psychological $10000.


Forex-Time-LogoArticle by ForexTime

ForexTime Ltd (FXTM) is an award winning international online forex broker regulated by CySEC 185/12 www.forextime.com

NZD hits five-month low against strong US dollar

By RoboForex Analytical Department

The New Zealand dollar has plummeted to a five-month low, with the NZD/USD pair touching the 0.5890 mark. This decline was triggered by the release of robust American retail sales data, which raised concerns that the Federal Reserve might delay interest rate cuts expected in 2024.

The prevailing expectation in the stock market is that the Fed will begin its monetary policy easing cycle in September, diverging from the earlier forecast of June. This expectation adjustment has bolstered the US dollar’s position, exerting additional pressure on other currencies.

The Reserve Bank of New Zealand (RBNZ) has maintained its interest rate steady for six consecutive meetings, including a neutral stance in its April meeting. The central bank’s primary objectives are alleviating production capacity pressures and mitigating inflation’s economic impact. Despite signs of weakening economic activity, New Zealand’s annual inflation rate dropped to 4.7% in the quarter ending December – the lowest since Q2 2021. However, inflation remains significantly above the RBNZ’s 1-3% target range.

There are indications that the New Zealand economy entered a technical recession in Q3 2023, with more recent data still awaited.

Technical analysis of NZD/USD

The H4 chart of NZD/USD shows that a consolidation range was established around the 0.5937 level, followed by a downward move to 0.5872. A corrective move back to 0.5900 is possible (testing from below), after which a further decline to 0.5830 is anticipated. This bearish scenario is supported by the MACD indicator, with its signal line positioned below zero and pointing downwards.

On the H1 chart, the NZD/USD pair continues its downward trajectory towards 0.5854. After completing the decline to 0.5872, a corrective movement to 0.5900 is likely. Subsequently, a new downward phase could target 0.5854, potentially extending towards 0.5830. This outlook is confirmed by the Stochastic oscillator, currently below 20, with an expected rise to 50, indicating the potential for a temporary corrective upswing before continuing the downward trend.


Disclaimer

Any forecasts contained herein are based on the author’s particular opinion. This analysis may not be treated as trading advice. RoboForex bears no responsibility for trading results based on trading recommendations and reviews contained herein.