By InvestMacro
Here are the latest charts and statistics for the Commitment of Traders (COT) reports data published by the Commodities Futures Trading Commission (CFTC).
The latest COT data is updated through Tuesday April 16th and shows a quick view of how large traders (for-profit speculators and commercial hedgers) were positioned in the futures markets.
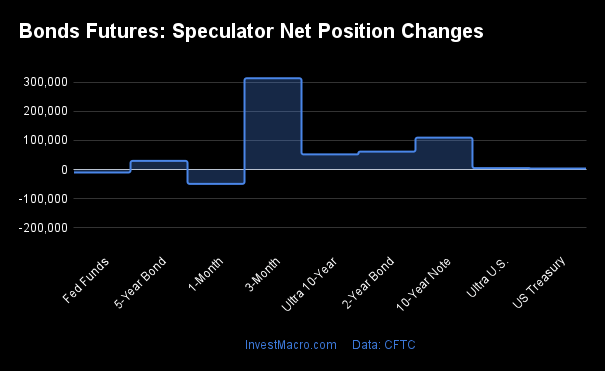
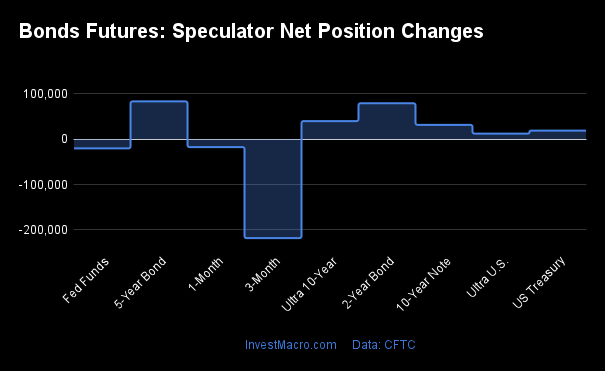
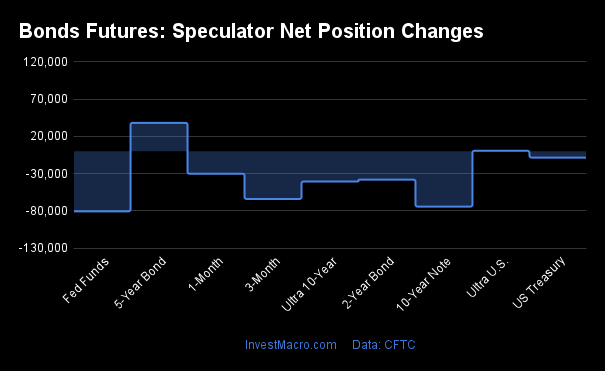
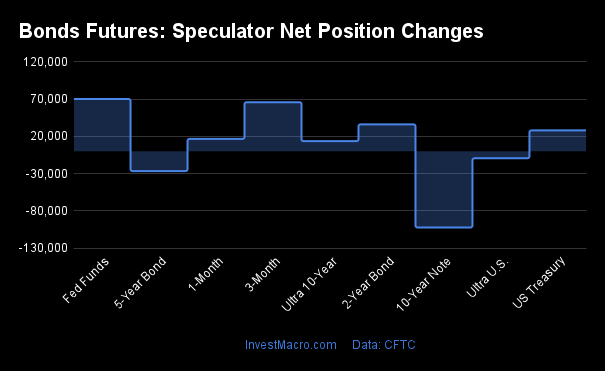
Weekly Speculator Changes led by 10-Year Bonds & Fed Funds
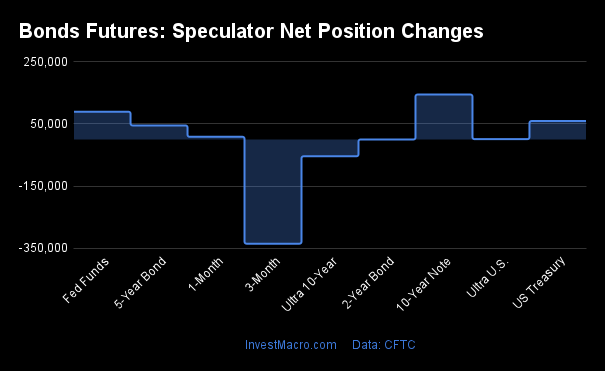
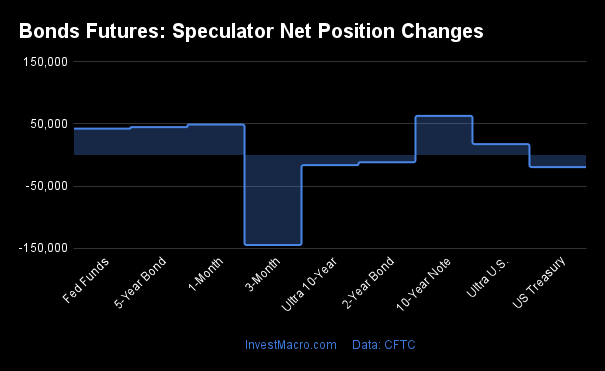
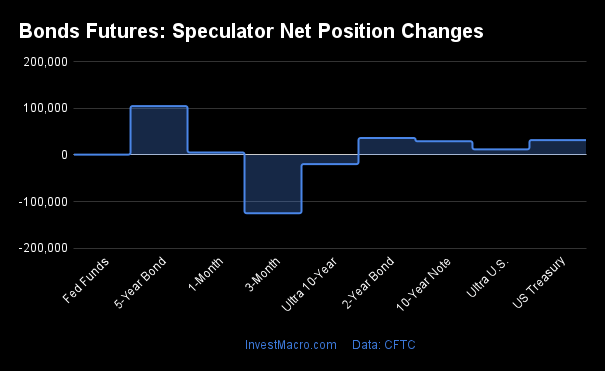
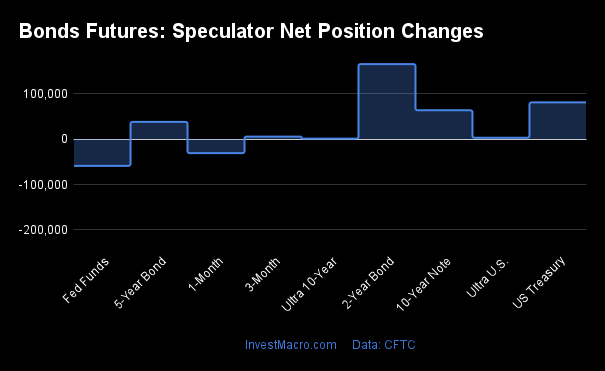
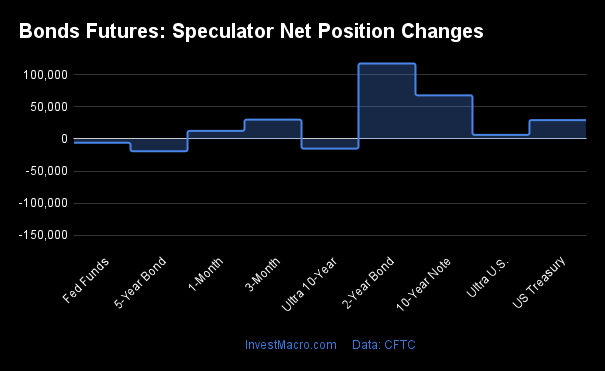
The COT bond market speculator bets were overall higher this week as five out of the eight bond markets we cover had higher positioning while the other three markets had lower speculator contracts.
Leading the gains for the bond markets was the 10-Year Bonds with a jump by 144,846 contracts followed by the Fed Funds (89,424 contracts), the US Treasury Bonds (59,426 contracts), the 5-Year Bonds (45,198 contracts) and with the Ultra Treasury Bonds (1,055 contracts) also having a positive week.
The bond markets with declines in speculator bets for the week were the SOFR 3-Months (-335,904 contracts), the Ultra 10-Year Bonds (-54,176 contracts) and the 2-Year Bonds (-13 contracts).
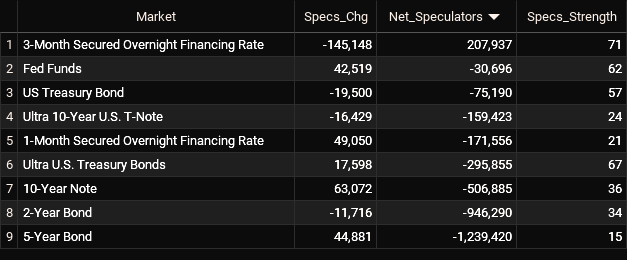
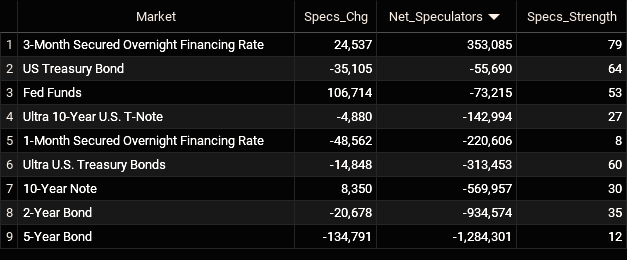
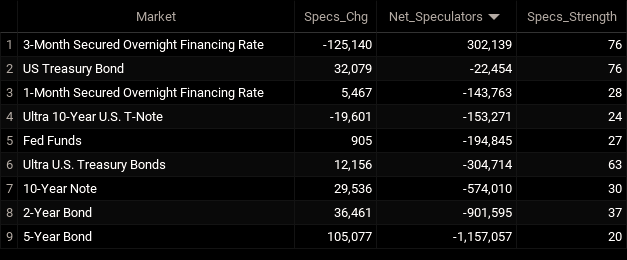
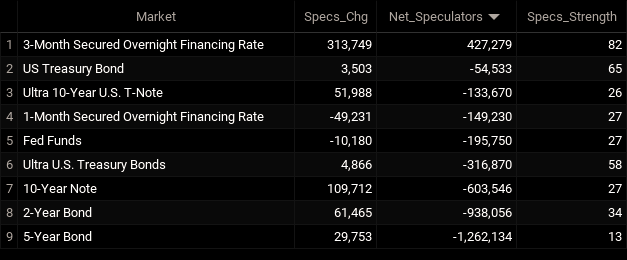
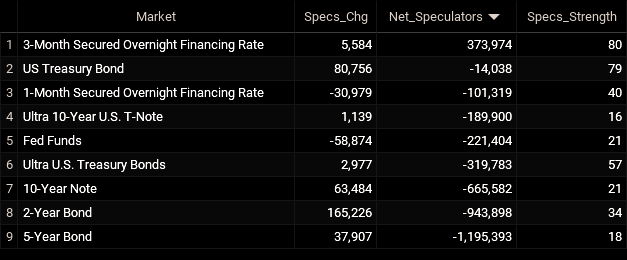
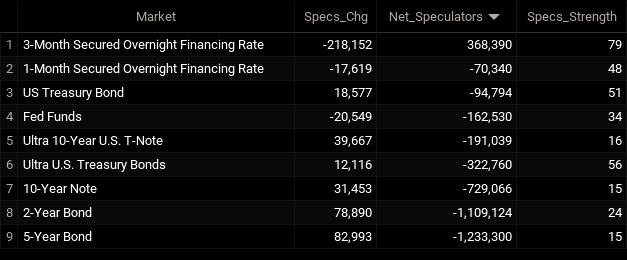
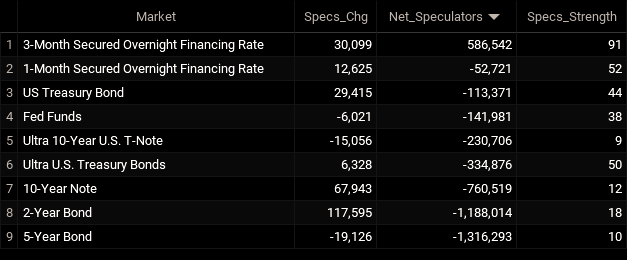
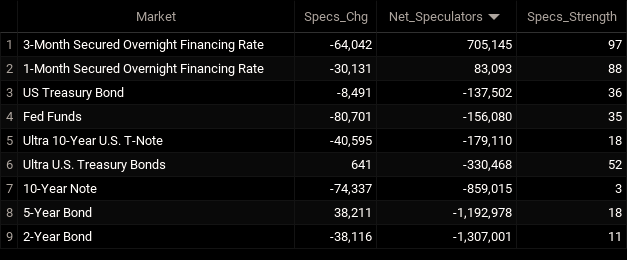
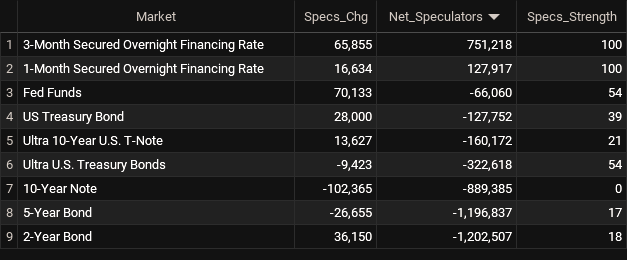
Bonds Net Speculators Leaderboard
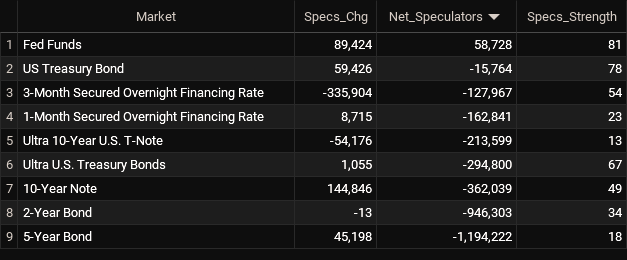
Legend: Weekly Speculators Change | Speculators Current Net Position | Speculators Strength Score compared to last 3-Years (0-100 range)
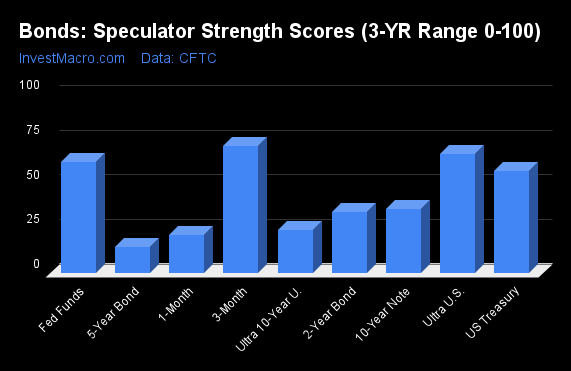
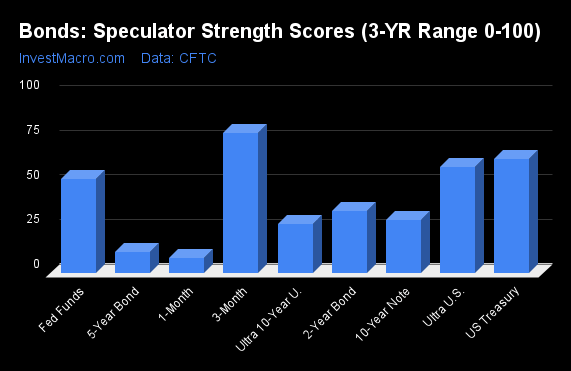
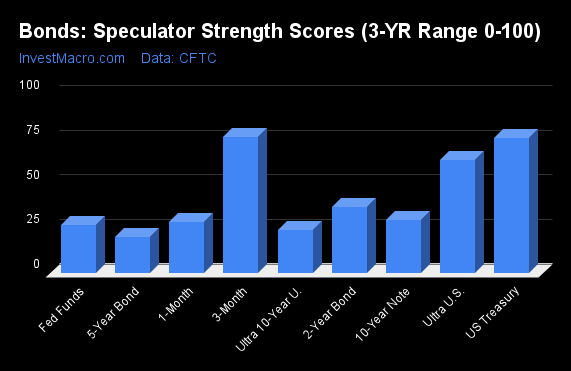
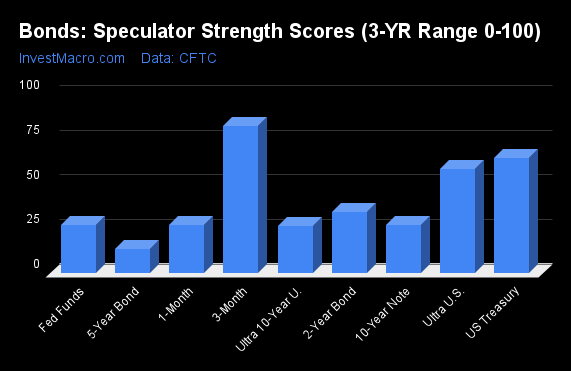
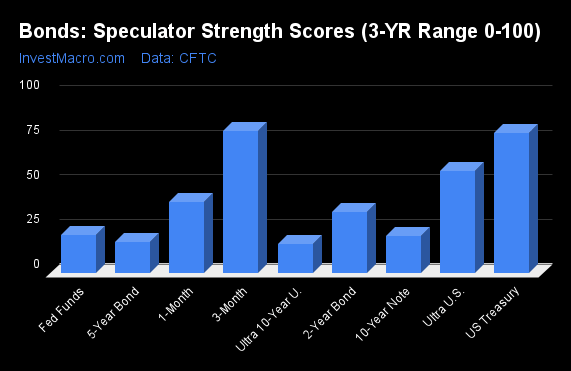
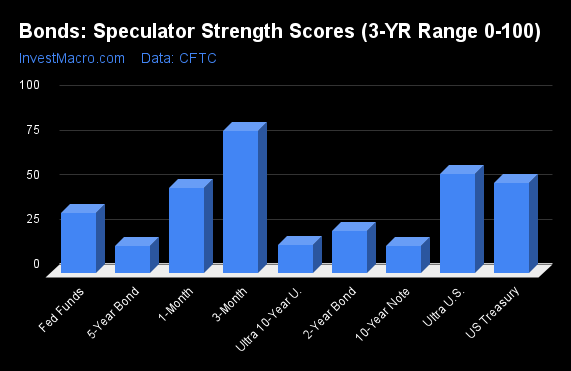
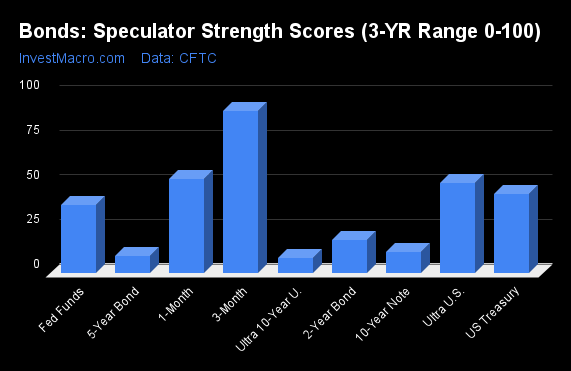
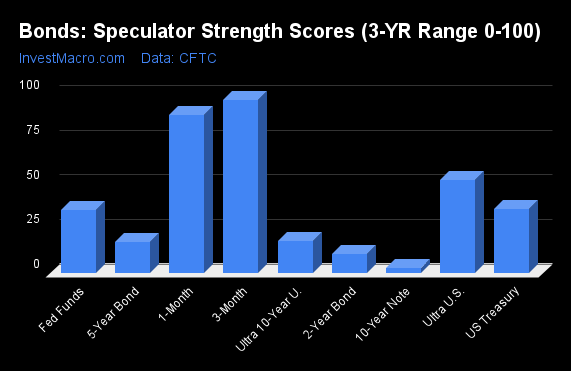
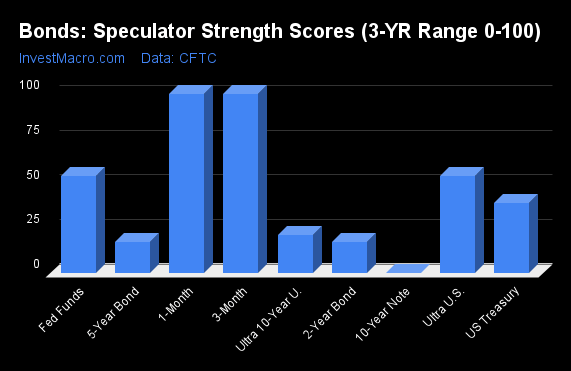
Strength Scores led by Fed Funds & US Treasury Bonds
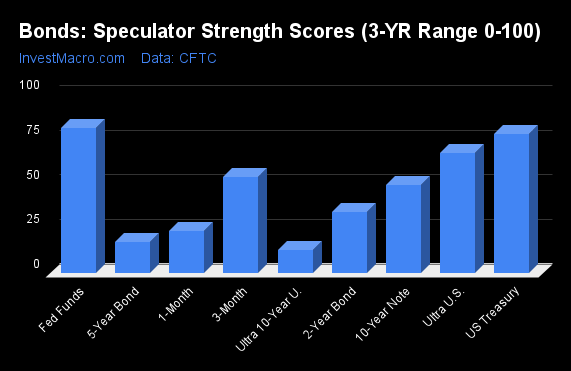
COT Strength Scores (a normalized measure of Speculator positions over a 3-Year range, from 0 to 100 where above 80 is Extreme-Bullish and below 20 is Extreme-Bearish) showed that the Fed Funds (81 percent) and the US Treasury Bonds (78 percent) lead the bond markets this week. The Ultra Treasury Bonds (67 percent) comes in as the next highest in the weekly strength scores.
On the downside, the Ultra 10-Year Bonds (13 percent) and the 5-Year Bonds (18 percent) come in at the lowest strength level currently and are both in Extreme-Bearish territory (below 20 percent). The next lowest strength score was the 2-Year Bonds at 34 percent.
Strength Statistics:
Fed Funds (81.1 percent) vs Fed Funds previous week (62.0 percent)
2-Year Bond (33.9 percent) vs 2-Year Bond previous week (33.9 percent)
5-Year Bond (17.5 percent) vs 5-Year Bond previous week (14.7 percent)
10-Year Bond (49.3 percent) vs 10-Year Bond previous week (35.7 percent)
Ultra 10-Year Bond (13.1 percent) vs Ultra 10-Year Bond previous week (24.1 percent)
US Treasury Bond (78.0 percent) vs US Treasury Bond previous week (57.3 percent)
Ultra US Treasury Bond (67.3 percent) vs Ultra US Treasury Bond previous week (66.9 percent)
SOFR 3-Months (53.7 percent) vs SOFR 3-Months previous week (71.0 percent)
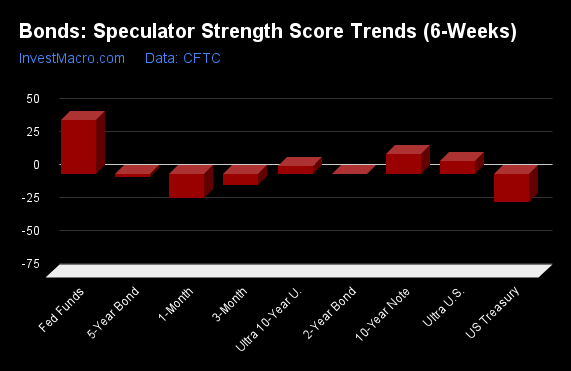
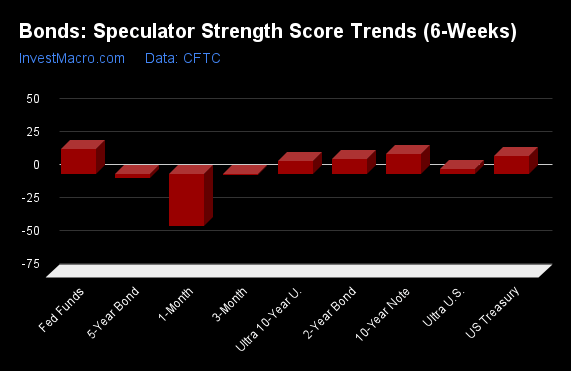
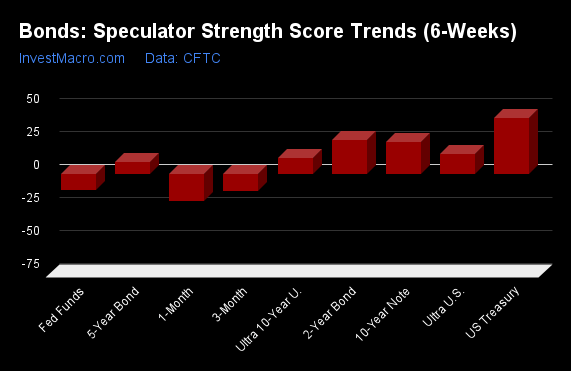
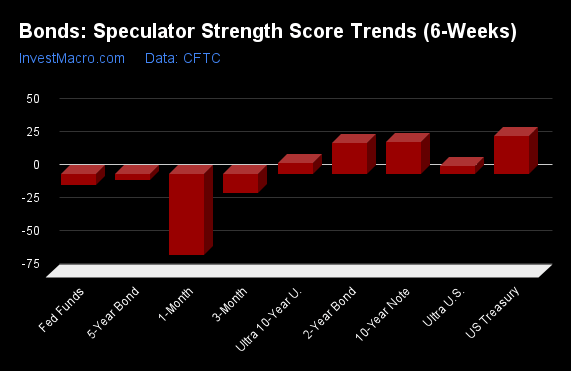
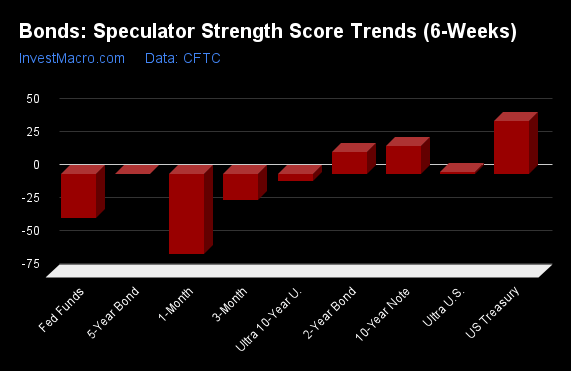
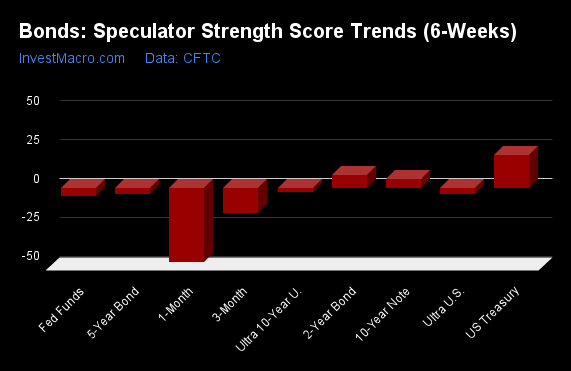
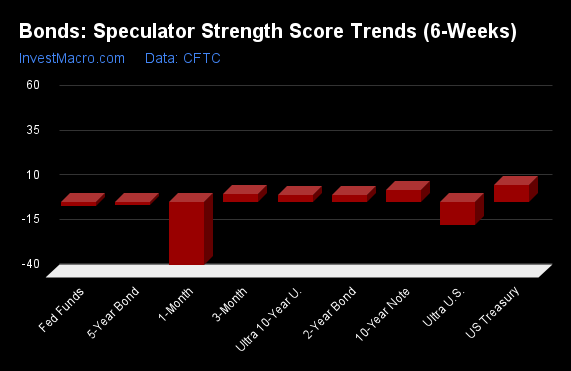
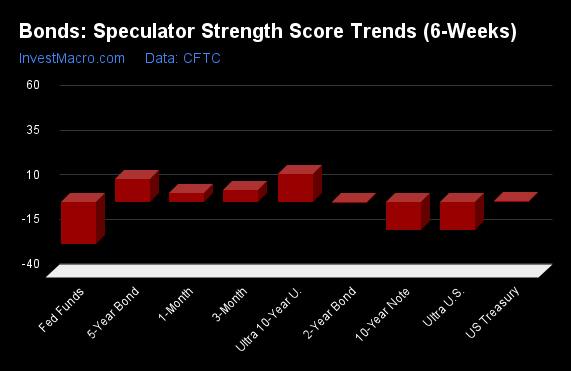
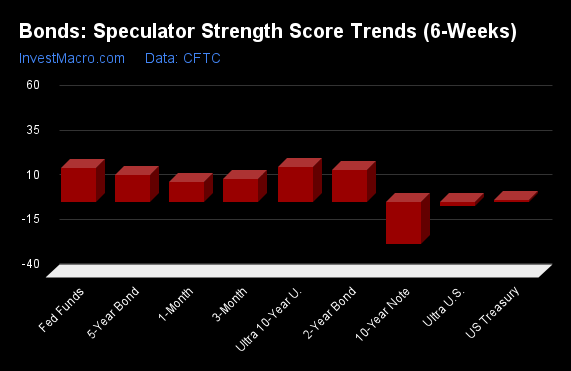
Fed Funds & 10-Year Bonds top the 6-Week Strength Trends
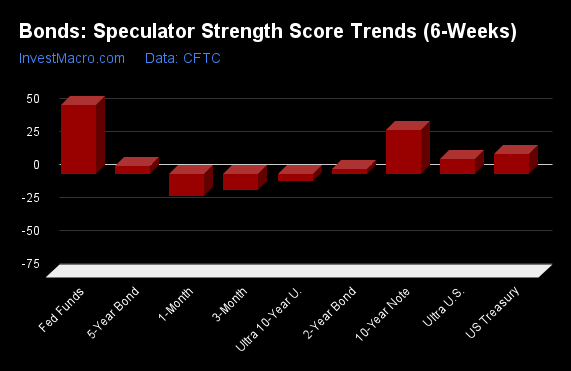
COT Strength Score Trends (or move index, calculates the 6-week changes in strength scores) showed that the Fed Funds (52 percent) and the 10-Year Bonds (33 percent) lead the past six weeks trends for bonds. The US Treasury Bonds (15 percent) is the next highest positive movers in the latest trends data.
The SOFR 3-Months (-12 percent) and the Ultra 10-Year Bonds (-6 percent) lead the downside trend scores currently.
Strength Trend Statistics:
Fed Funds (52.2 percent) vs Fed Funds previous week (40.7 percent)
2-Year Bond (3.4 percent) vs 2-Year Bond previous week (-0.2 percent)
5-Year Bond (6.2 percent) vs 5-Year Bond previous week (-2.8 percent)
10-Year Bond (32.8 percent) vs 10-Year Bond previous week (14.8 percent)
Ultra 10-Year Bond (-5.7 percent) vs Ultra 10-Year Bond previous week (6.2 percent)
US Treasury Bond (14.7 percent) vs US Treasury Bond previous week (-21.3 percent)
Ultra US Treasury Bond (11.2 percent) vs Ultra US Treasury Bond previous week (10.0 percent)
SOFR 3-Months (-12.5 percent) vs SOFR 3-Months previous week (-8.6 percent)
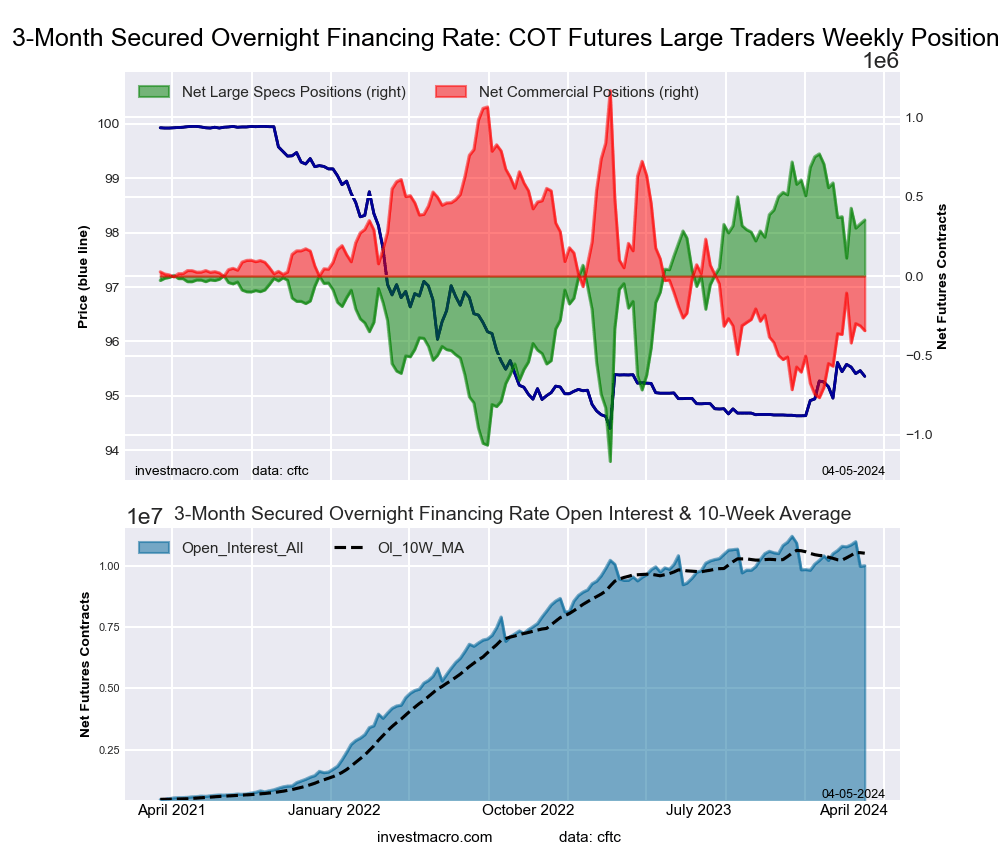
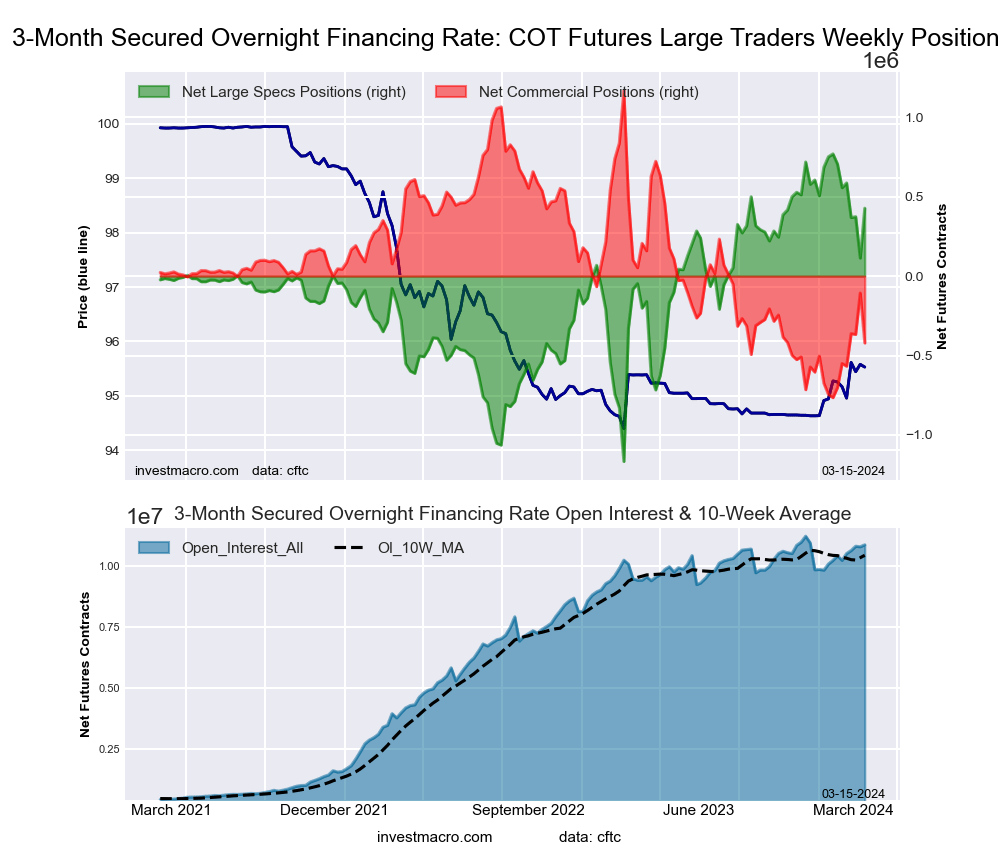
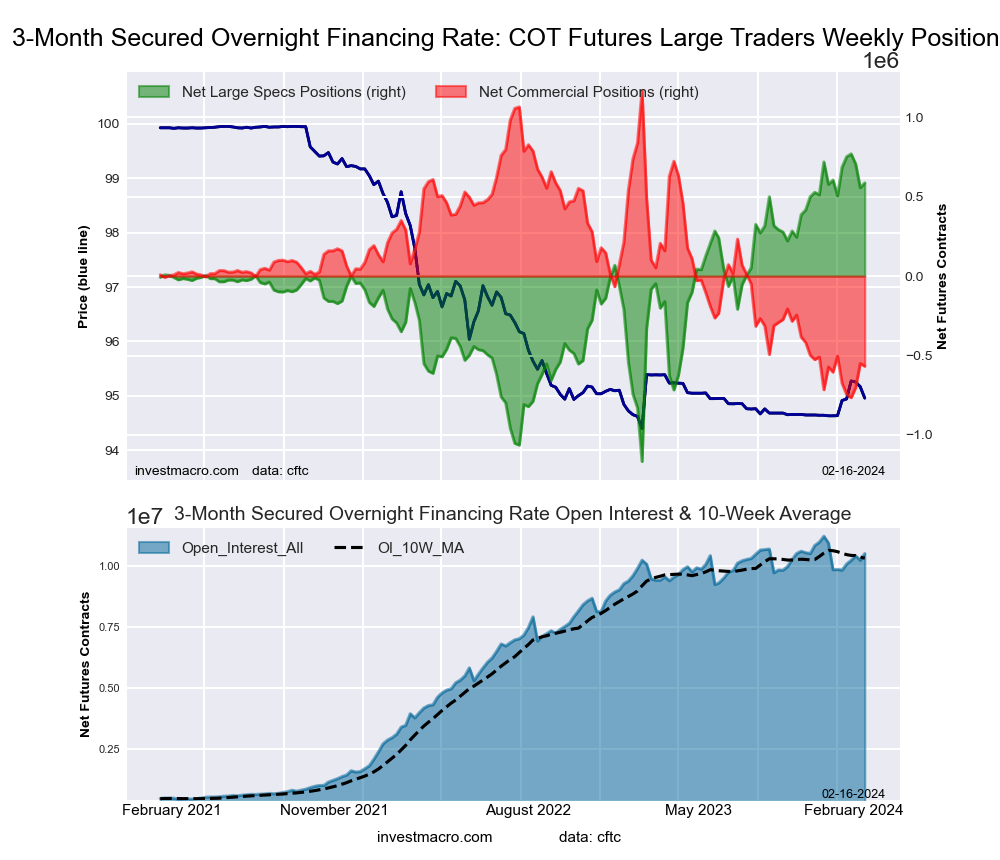
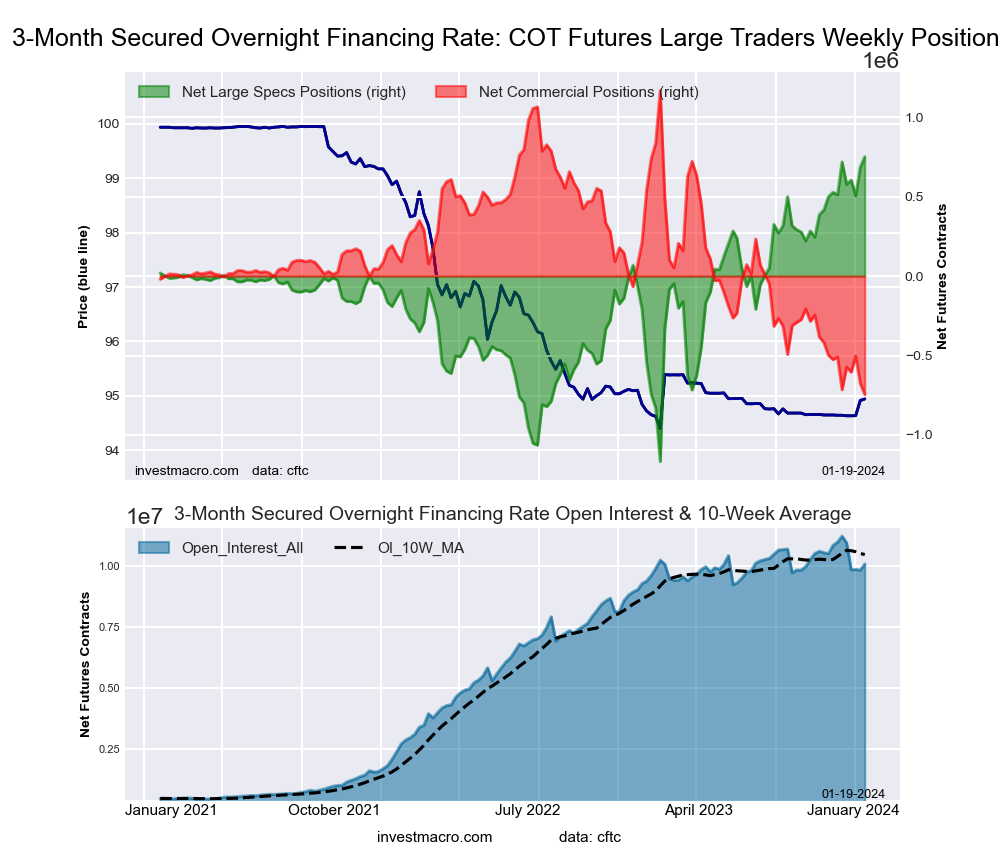
Secured Overnight Financing Rate (3-Month) Futures:
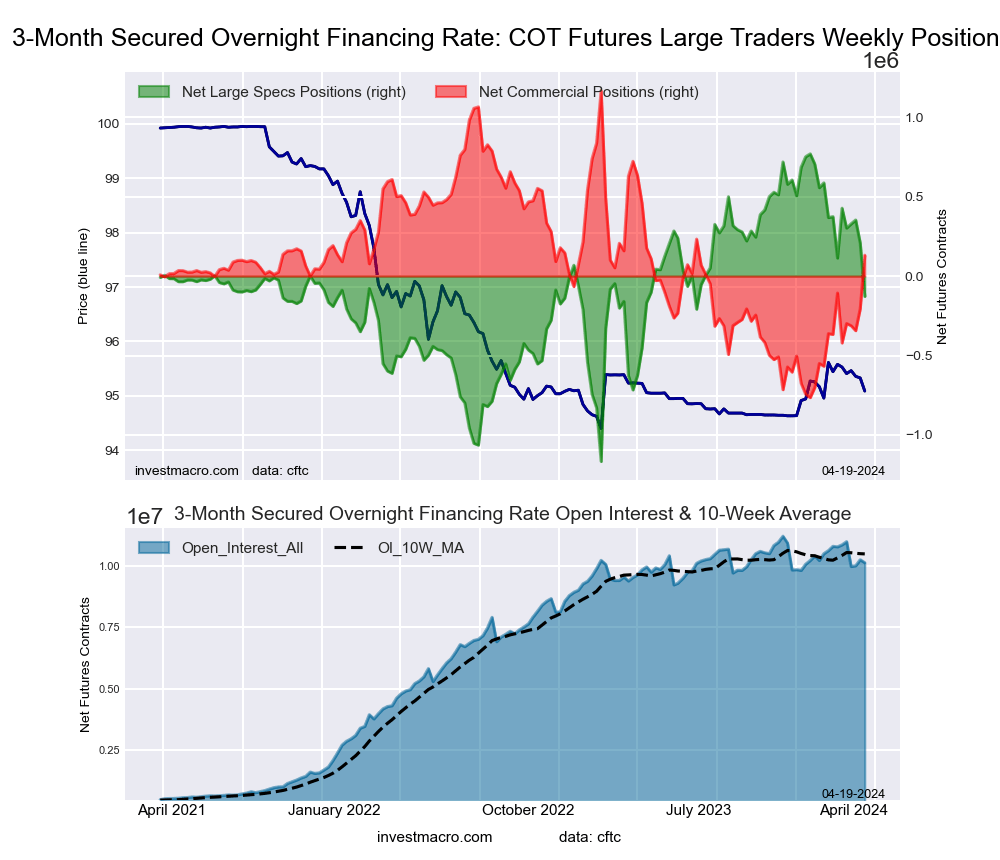 The Secured Overnight Financing Rate (3-Month) large speculator standing this week was a net position of -127,967 contracts in the data reported through Tuesday. This was a weekly lowering of -335,904 contracts from the previous week which had a total of 207,937 net contracts.
This week’s current strength score (the trader positioning range over the past three years, measured from 0 to 100) shows the speculators are currently Bullish with a score of 53.7 percent. The commercials are Bearish with a score of 46.4 percent and the small traders (not shown in chart) are Bullish-Extreme with a score of 86.0 percent.
Price Trend-Following Model: Weak Uptrend
Our weekly trend-following model classifies the current market price position as: Weak Uptrend. The current action for the model is considered to be: Hold – Maintain Long Position.
| SOFR 3-Months Statistics | SPECULATORS | COMMERCIALS | SMALL TRADERS |
| – Percent of Open Interest Longs: | 14.7 | 57.4 | 0.3 |
| – Percent of Open Interest Shorts: | 15.9 | 56.1 | 0.4 |
| – Net Position: | -127,967 | 131,343 | -3,376 |
| – Gross Longs: | 1,485,664 | 5,819,244 | 32,257 |
| – Gross Shorts: | 1,613,631 | 5,687,901 | 35,633 |
| – Long to Short Ratio: | 0.9 to 1 | 1.0 to 1 | 0.9 to 1 |
| NET POSITION TREND: | |||
| – Strength Index Score (3 Year Range Pct): | 53.7 | 46.4 | 86.0 |
| – Strength Index Reading (3 Year Range): | Bullish | Bearish | Bullish-Extreme |
| NET POSITION MOVEMENT INDEX: | |||
| – 6-Week Change in Strength Index: | -12.5 | 12.3 | 1.9 |
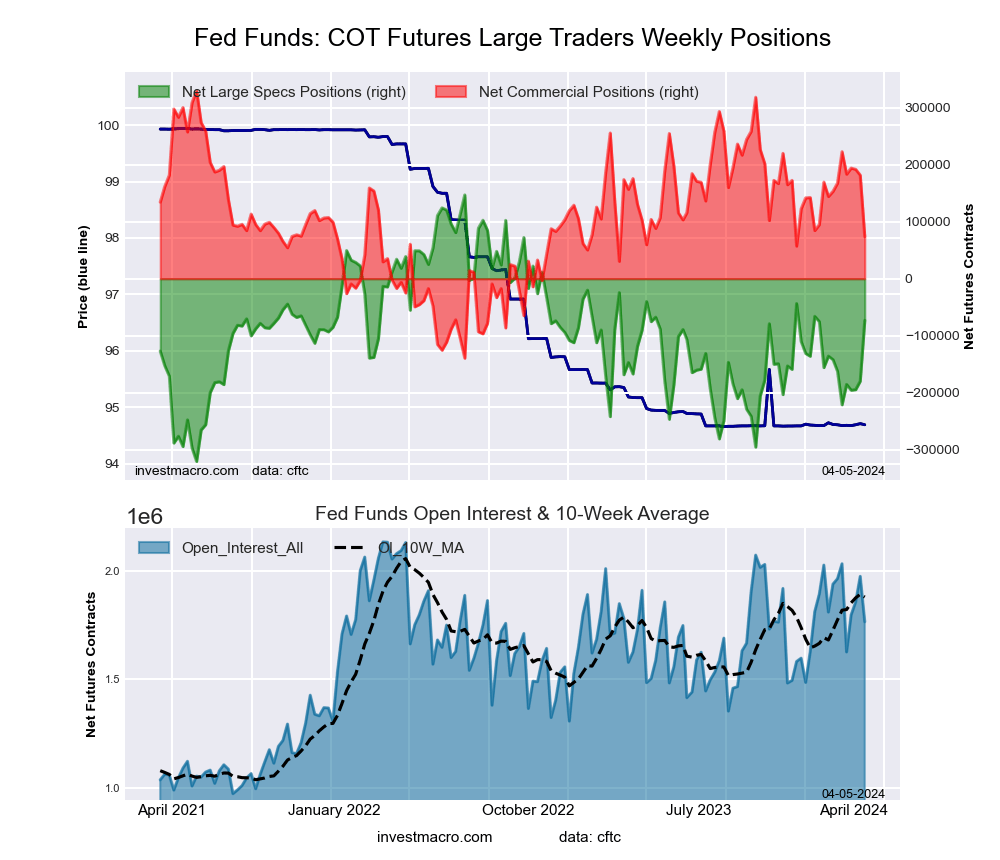
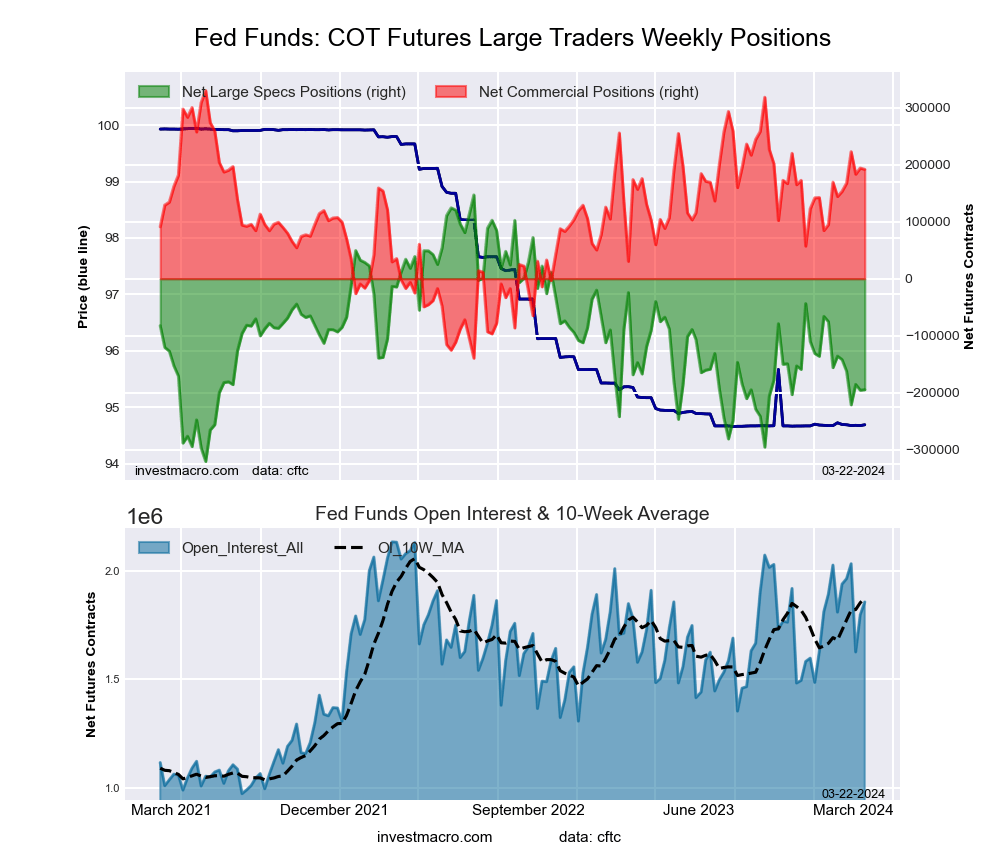
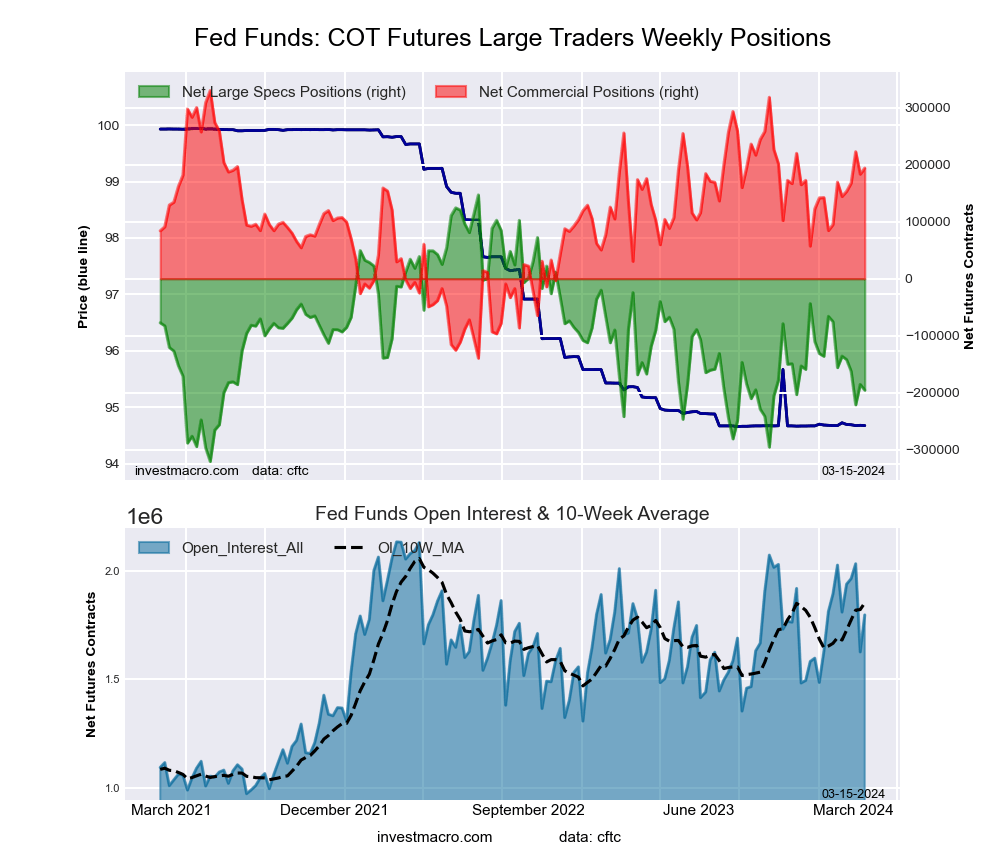
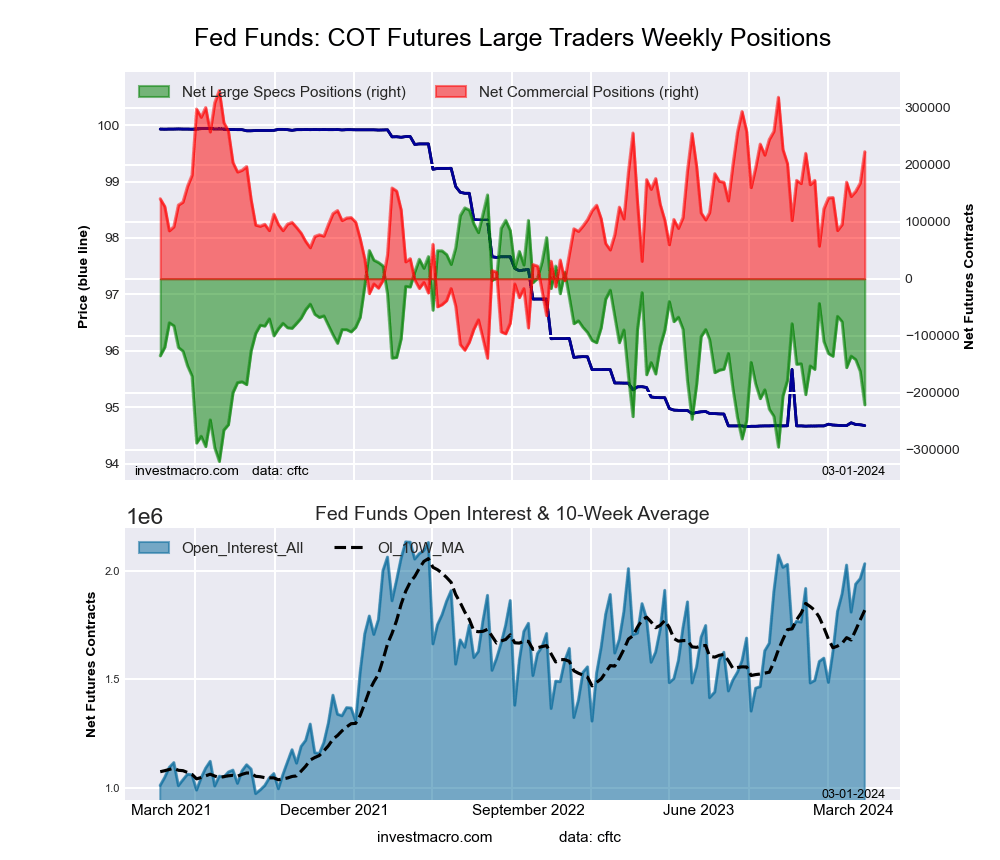
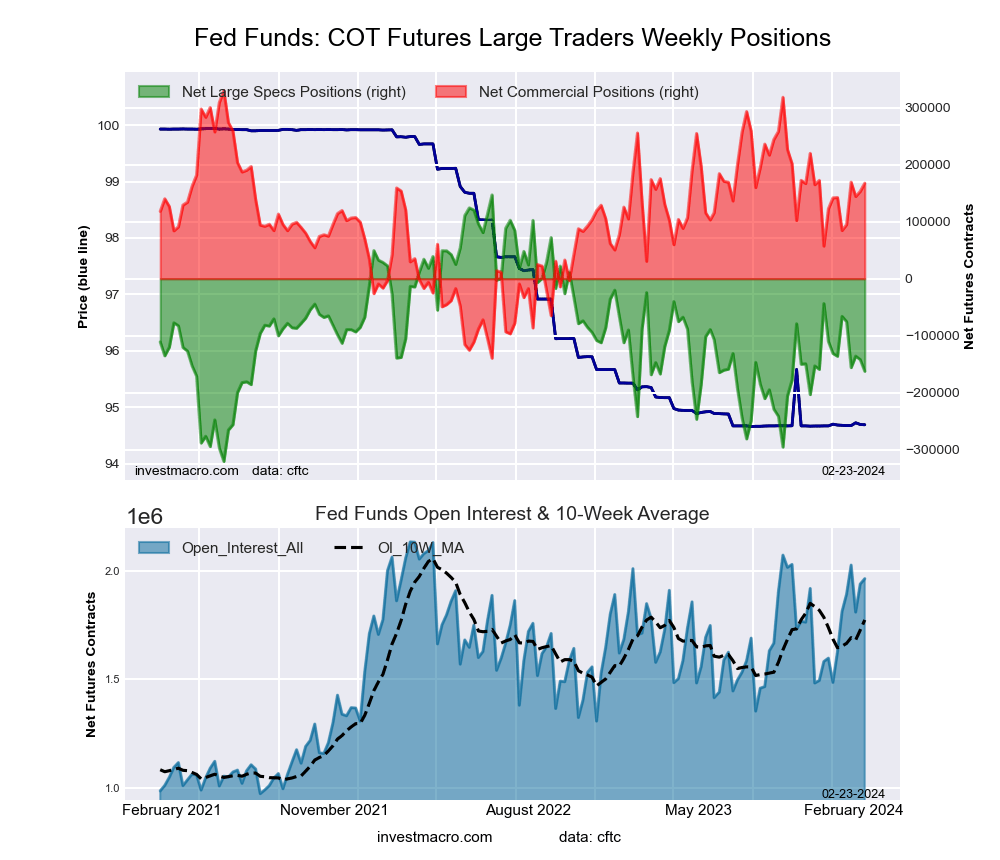
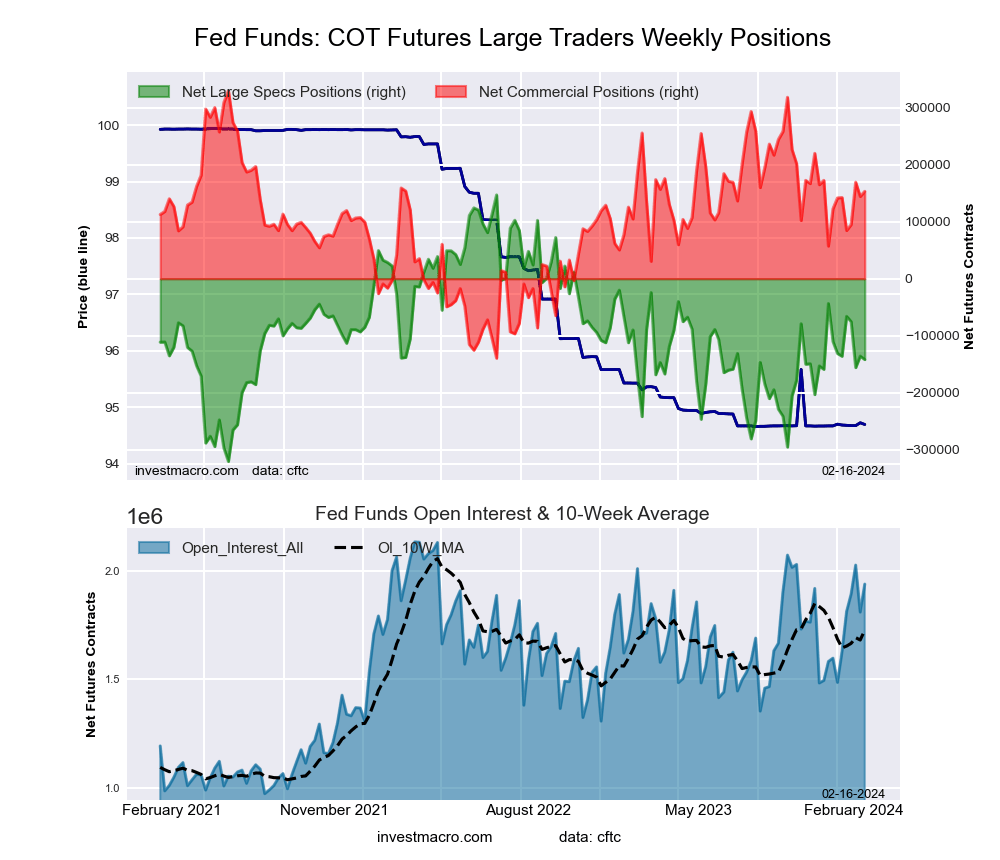
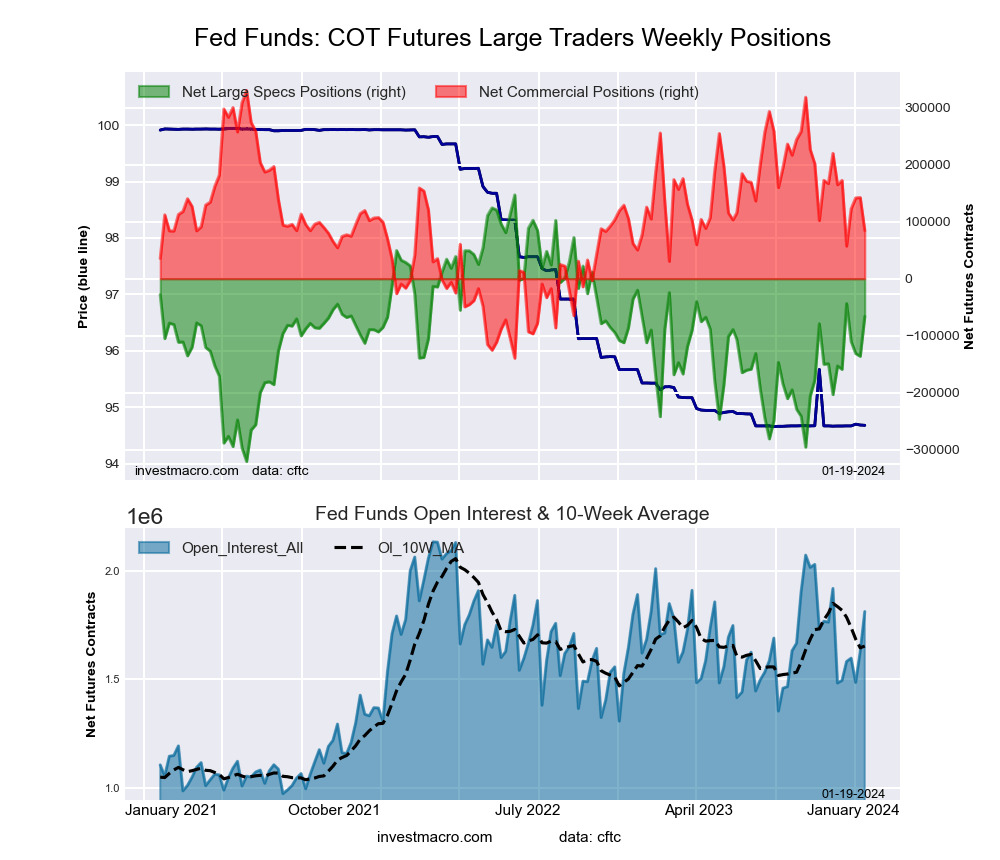
30-Day Federal Funds Futures:
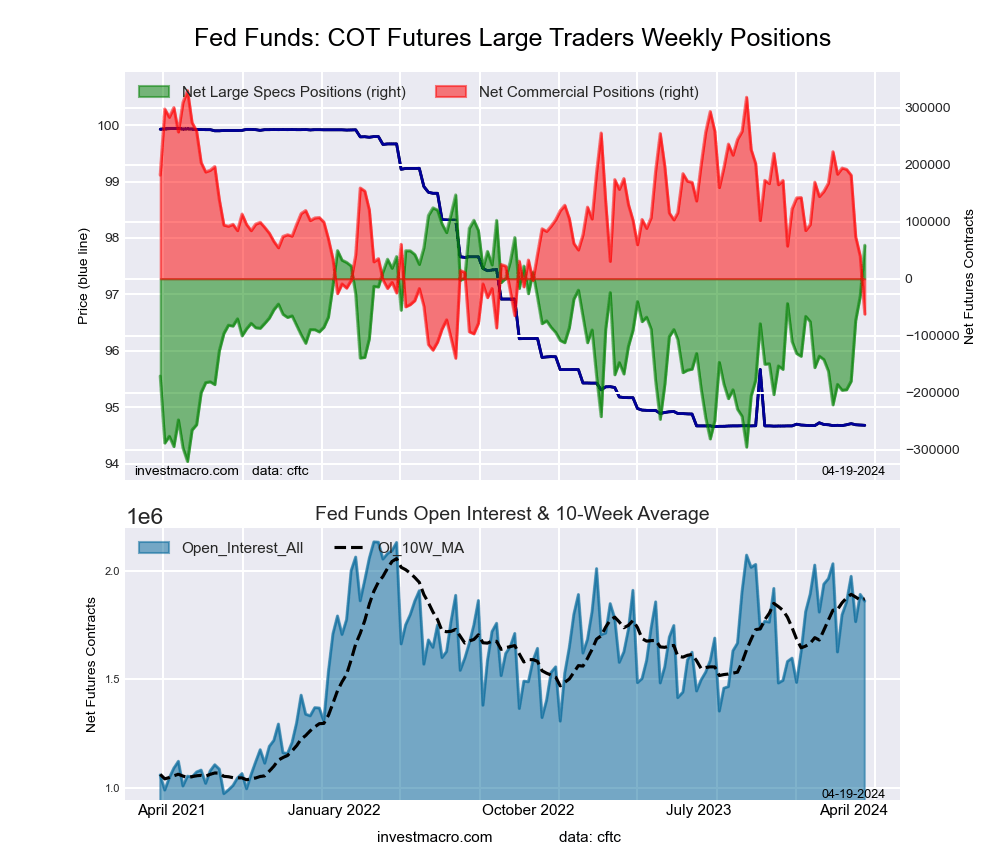 The 30-Day Federal Funds large speculator standing this week was a net position of 58,728 contracts in the data reported through Tuesday. This was a weekly increase of 89,424 contracts from the previous week which had a total of -30,696 net contracts.
This week’s current strength score (the trader positioning range over the past three years, measured from 0 to 100) shows the speculators are currently Bullish-Extreme with a score of 81.1 percent. The commercials are Bearish-Extreme with a score of 16.5 percent and the small traders (not shown in chart) are Bullish-Extreme with a score of 97.6 percent.
Price Trend-Following Model: Downtrend
Our weekly trend-following model classifies the current market price position as: Downtrend. The current action for the model is considered to be: Hold – Maintain Short Position.
| 30-Day Federal Funds Statistics | SPECULATORS | COMMERCIALS | SMALL TRADERS |
| – Percent of Open Interest Longs: | 21.4 | 62.6 | 2.4 |
| – Percent of Open Interest Shorts: | 18.2 | 66.0 | 2.2 |
| – Net Position: | 58,728 | -62,100 | 3,372 |
| – Gross Longs: | 397,356 | 1,164,532 | 43,727 |
| – Gross Shorts: | 338,628 | 1,226,632 | 40,355 |
| – Long to Short Ratio: | 1.2 to 1 | 0.9 to 1 | 1.1 to 1 |
| NET POSITION TREND: | |||
| – Strength Index Score (3 Year Range Pct): | 81.1 | 16.5 | 97.6 |
| – Strength Index Reading (3 Year Range): | Bullish-Extreme | Bearish-Extreme | Bullish-Extreme |
| NET POSITION MOVEMENT INDEX: | |||
| – 6-Week Change in Strength Index: | 52.2 | -52.3 | 2.7 |
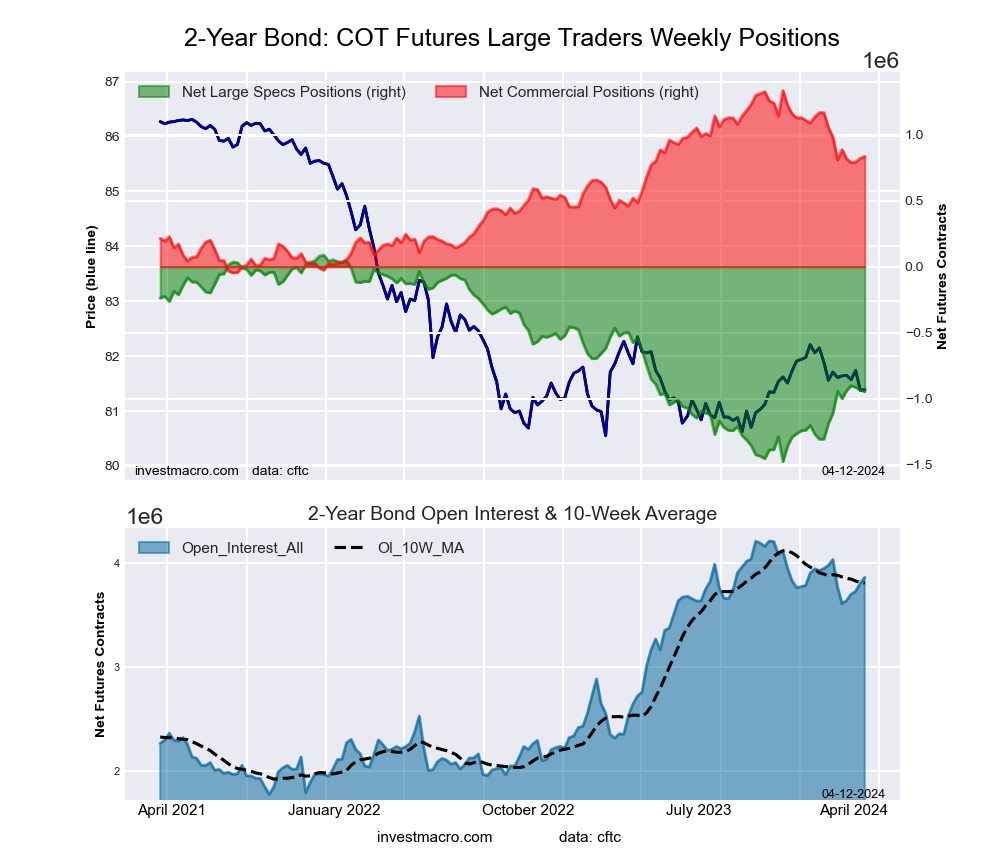
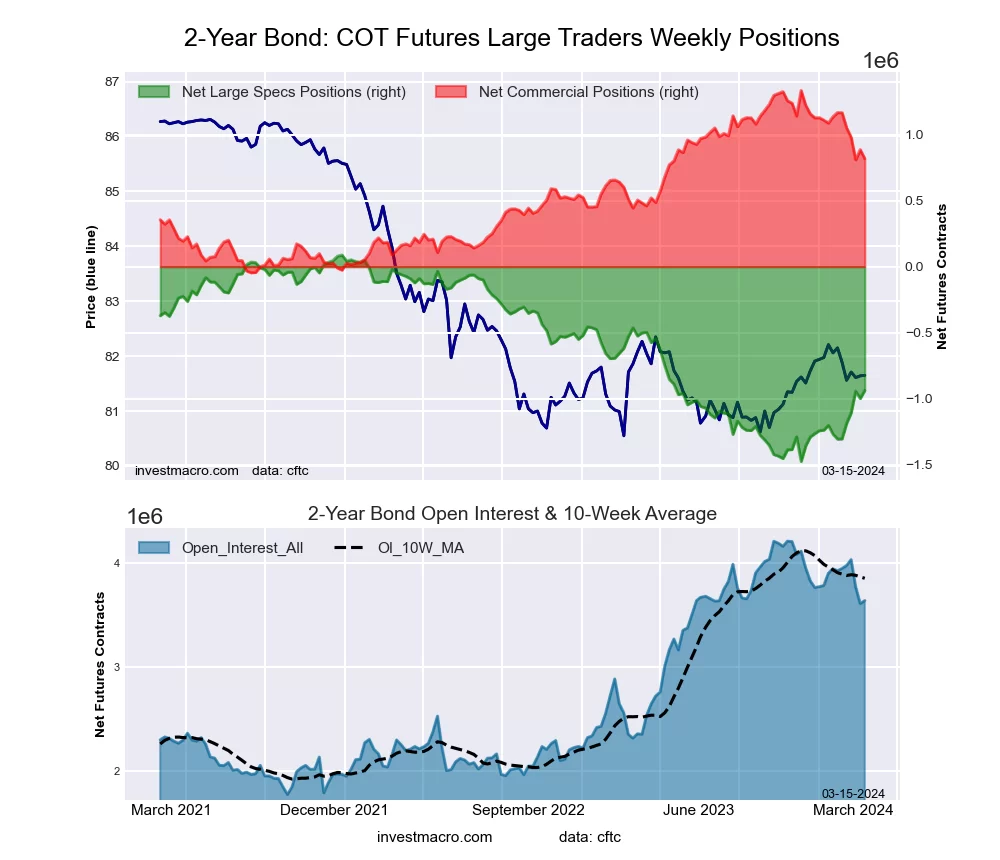
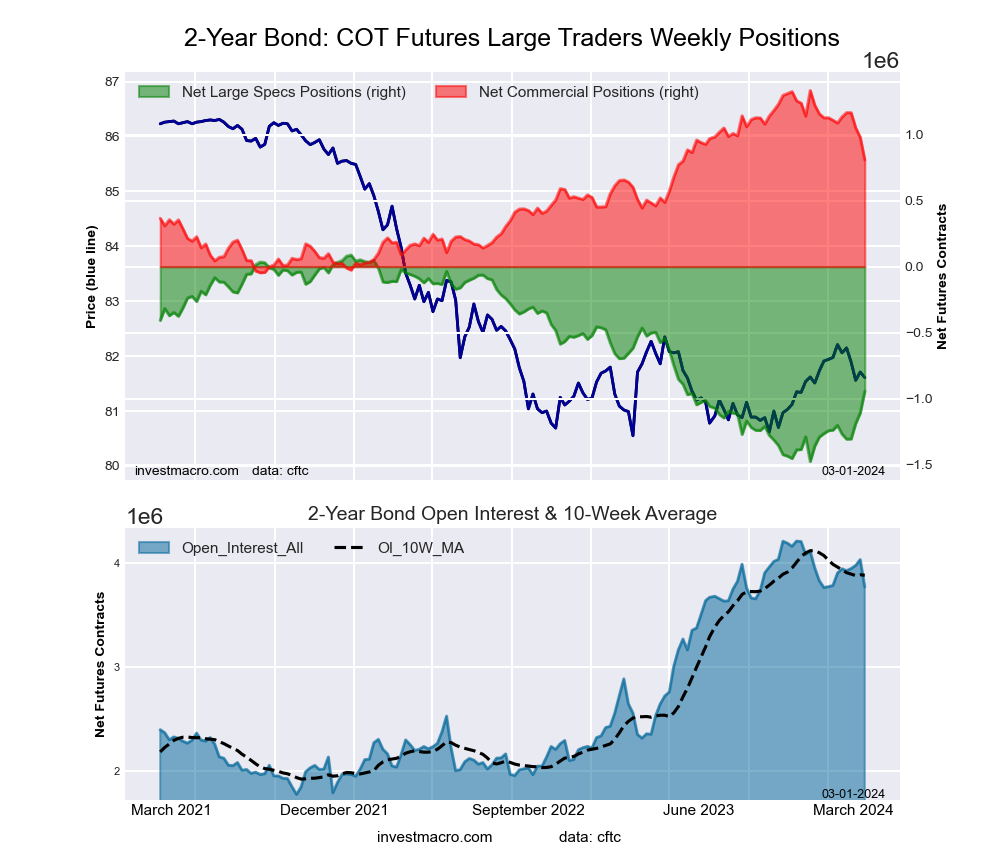
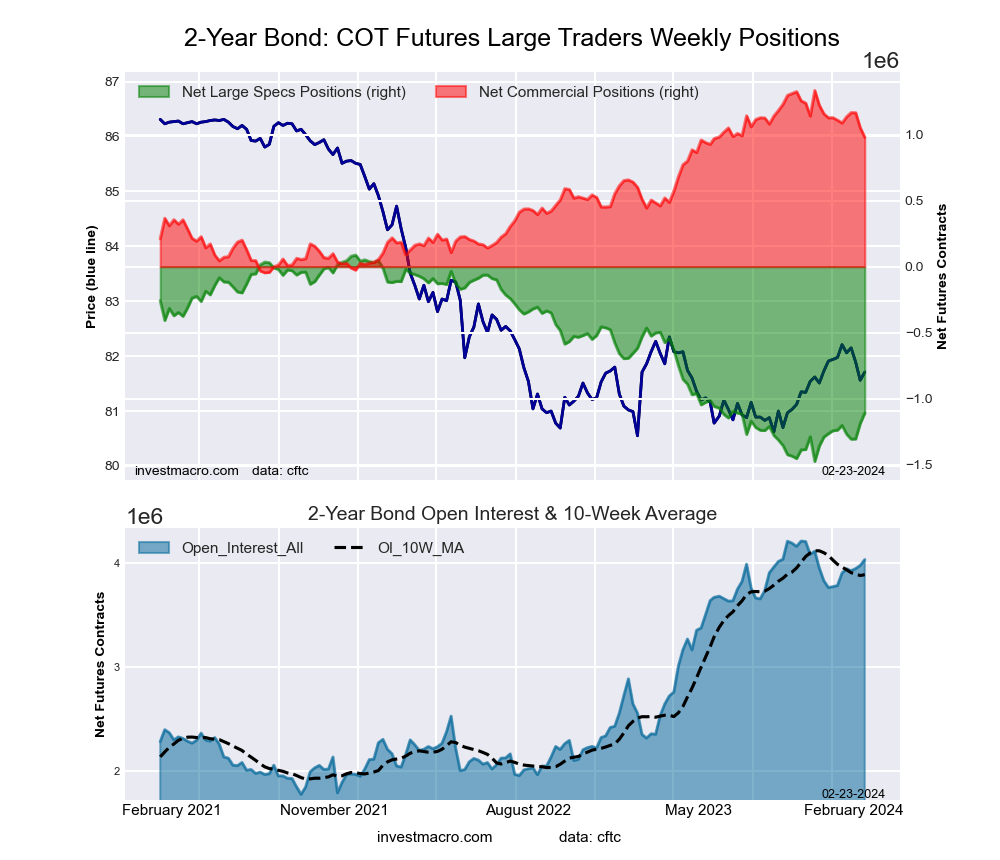
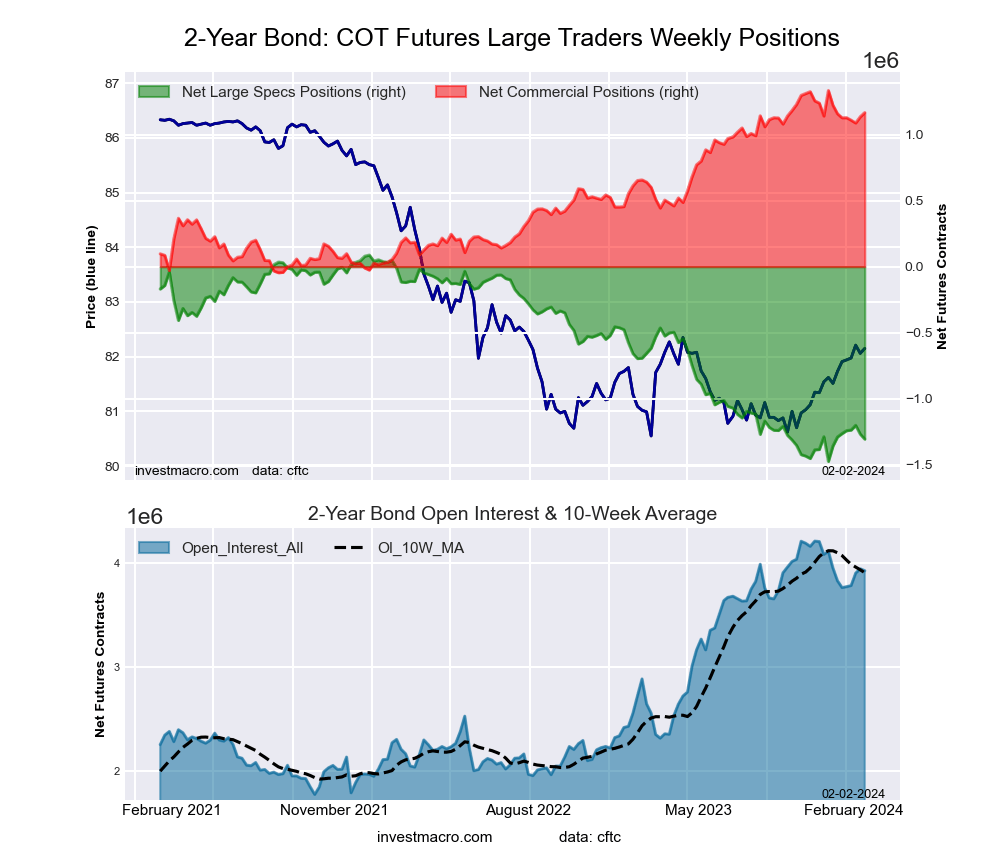
2-Year Treasury Note Futures:
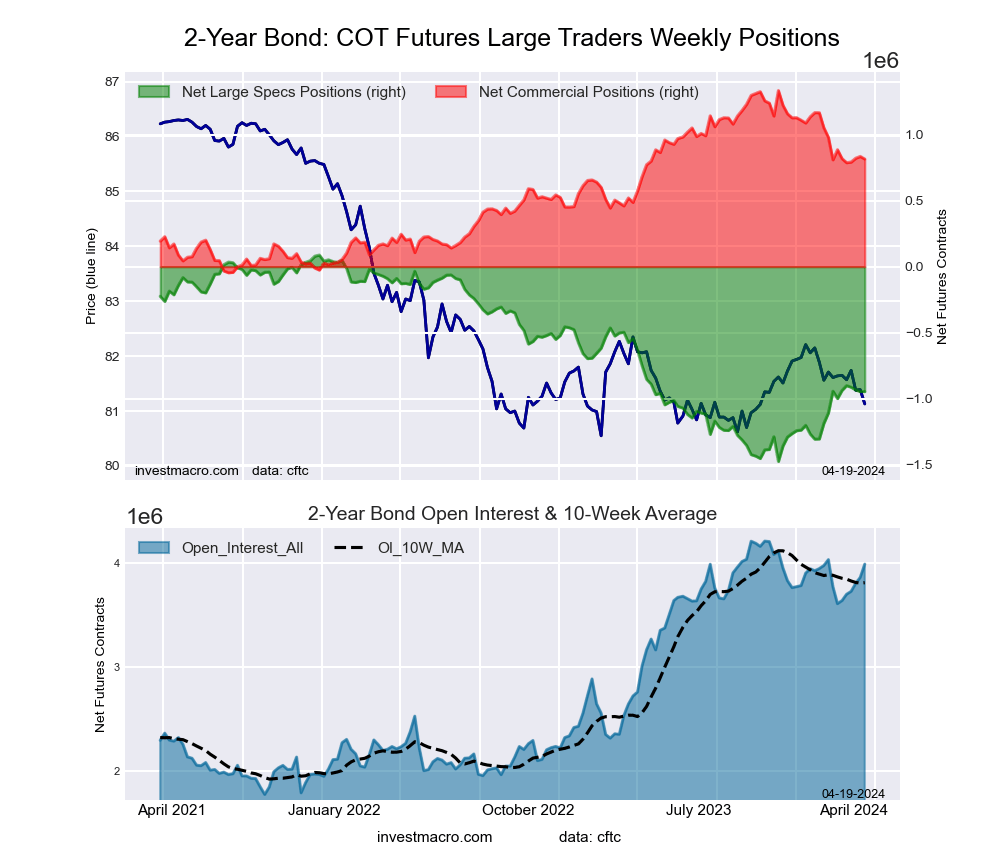 The 2-Year Treasury Note large speculator standing this week was a net position of -946,303 contracts in the data reported through Tuesday. This was a weekly reduction of -13 contracts from the previous week which had a total of -946,290 net contracts.
This week’s current strength score (the trader positioning range over the past three years, measured from 0 to 100) shows the speculators are currently Bearish with a score of 33.9 percent. The commercials are Bullish with a score of 62.4 percent and the small traders (not shown in chart) are Bullish-Extreme with a score of 93.7 percent.
Price Trend-Following Model: Strong Downtrend
Our weekly trend-following model classifies the current market price position as: Strong Downtrend. The current action for the model is considered to be: Hold – Maintain Short Position.
| 2-Year Treasury Note Statistics | SPECULATORS | COMMERCIALS | SMALL TRADERS |
| – Percent of Open Interest Longs: | 12.6 | 79.3 | 6.6 |
| – Percent of Open Interest Shorts: | 36.4 | 58.8 | 3.3 |
| – Net Position: | -946,303 | 815,457 | 130,846 |
| – Gross Longs: | 503,827 | 3,161,777 | 263,544 |
| – Gross Shorts: | 1,450,130 | 2,346,320 | 132,698 |
| – Long to Short Ratio: | 0.3 to 1 | 1.3 to 1 | 2.0 to 1 |
| NET POSITION TREND: | |||
| – Strength Index Score (3 Year Range Pct): | 33.9 | 62.4 | 93.7 |
| – Strength Index Reading (3 Year Range): | Bearish | Bullish | Bullish-Extreme |
| NET POSITION MOVEMENT INDEX: | |||
| – 6-Week Change in Strength Index: | 3.4 | -5.1 | 6.6 |
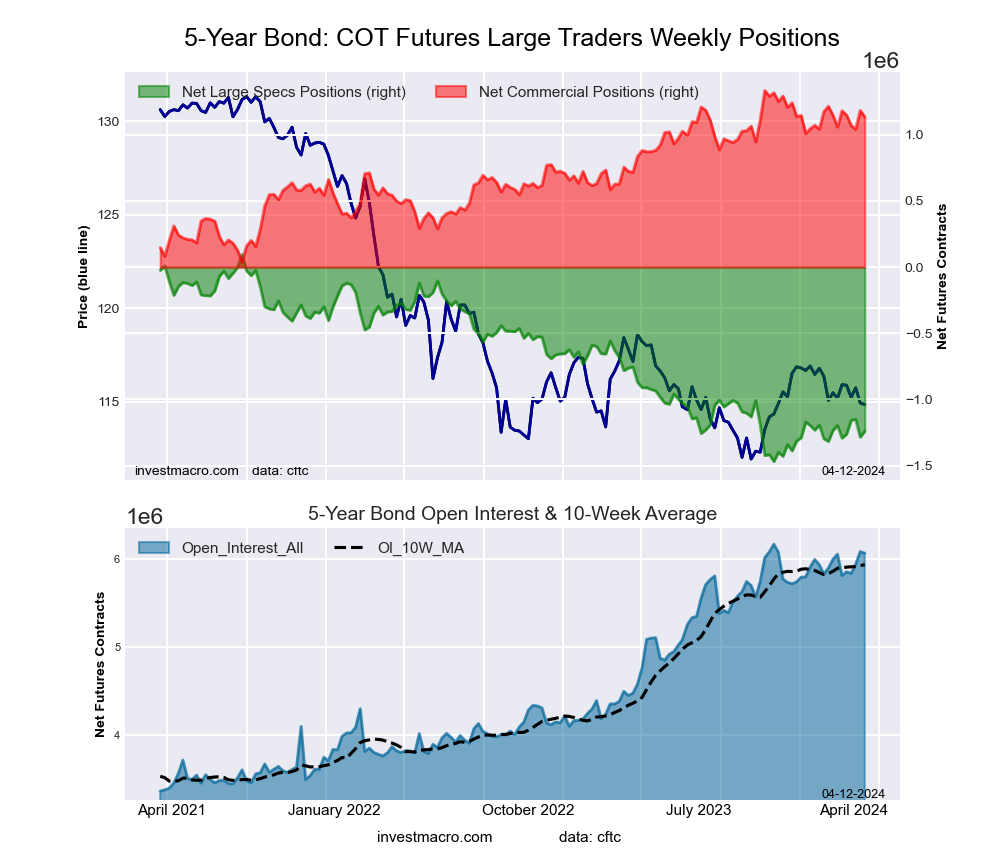
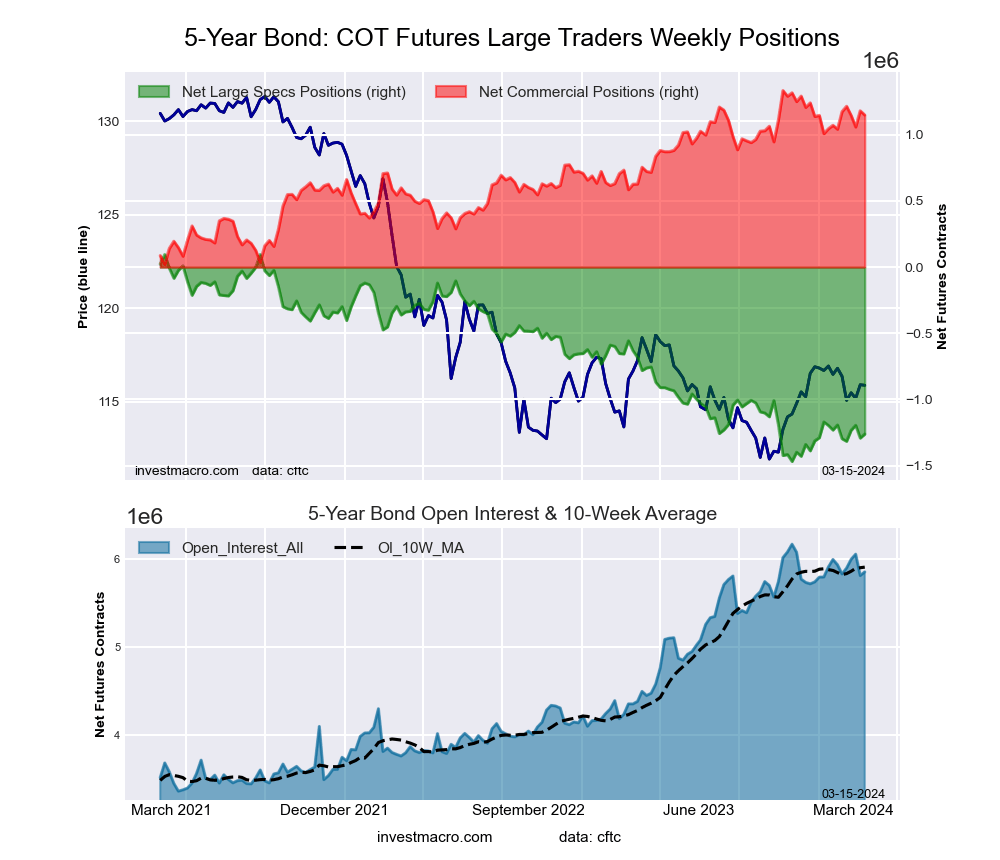
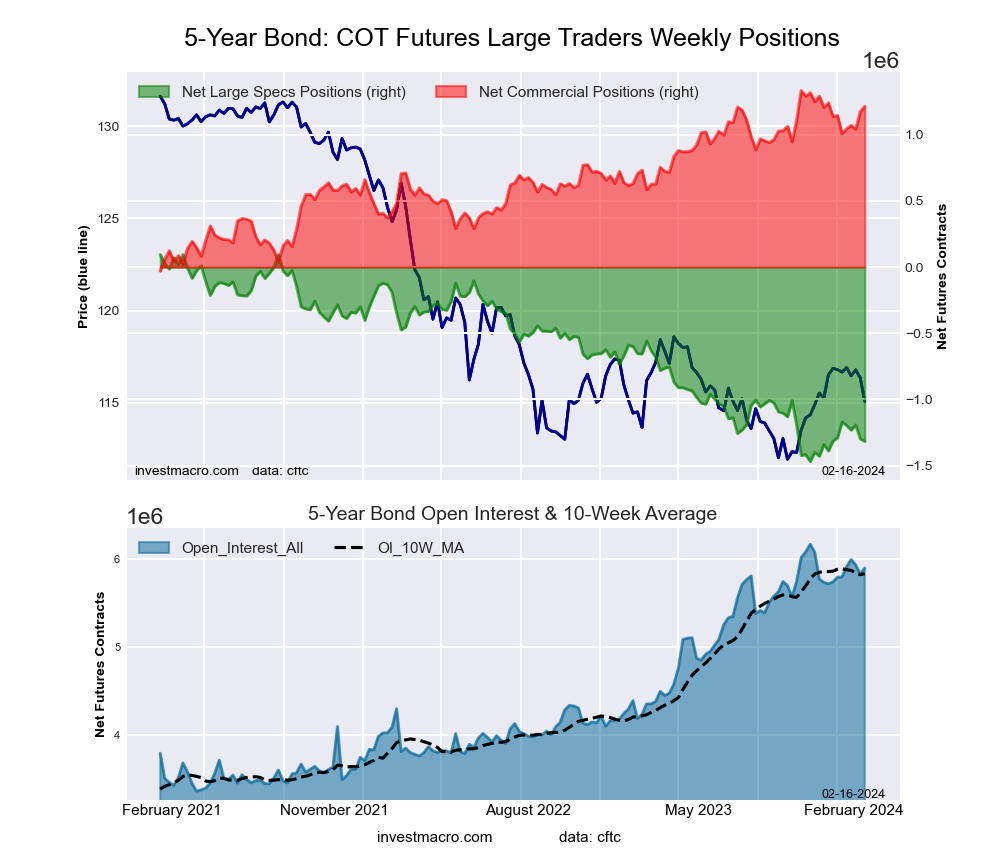
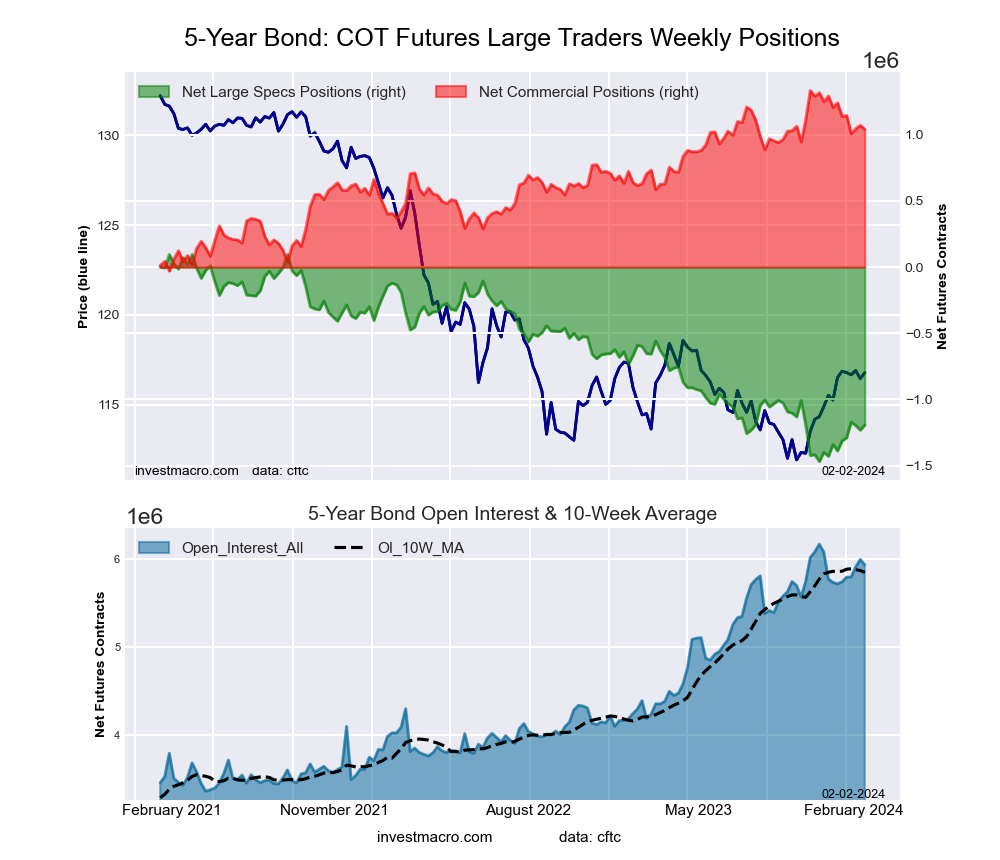
5-Year Treasury Note Futures:
 The 5-Year Treasury Note large speculator standing this week was a net position of -1,194,222 contracts in the data reported through Tuesday. This was a weekly gain of 45,198 contracts from the previous week which had a total of -1,239,420 net contracts.
This week’s current strength score (the trader positioning range over the past three years, measured from 0 to 100) shows the speculators are currently Bearish-Extreme with a score of 17.5 percent. The commercials are Bullish with a score of 79.8 percent and the small traders (not shown in chart) are Bullish-Extreme with a score of 88.6 percent.
Price Trend-Following Model: Strong Downtrend
Our weekly trend-following model classifies the current market price position as: Strong Downtrend. The current action for the model is considered to be: Hold – Maintain Short Position.
| 5-Year Treasury Note Statistics | SPECULATORS | COMMERCIALS | SMALL TRADERS |
| – Percent of Open Interest Longs: | 7.7 | 83.1 | 7.2 |
| – Percent of Open Interest Shorts: | 27.5 | 65.3 | 5.2 |
| – Net Position: | -1,194,222 | 1,072,513 | 121,709 |
| – Gross Longs: | 461,614 | 5,000,703 | 431,620 |
| – Gross Shorts: | 1,655,836 | 3,928,190 | 309,911 |
| – Long to Short Ratio: | 0.3 to 1 | 1.3 to 1 | 1.4 to 1 |
| NET POSITION TREND: | |||
| – Strength Index Score (3 Year Range Pct): | 17.5 | 79.8 | 88.6 |
| – Strength Index Reading (3 Year Range): | Bearish-Extreme | Bullish | Bullish-Extreme |
| NET POSITION MOVEMENT INDEX: | |||
| – 6-Week Change in Strength Index: | 6.2 | -8.4 | 2.3 |
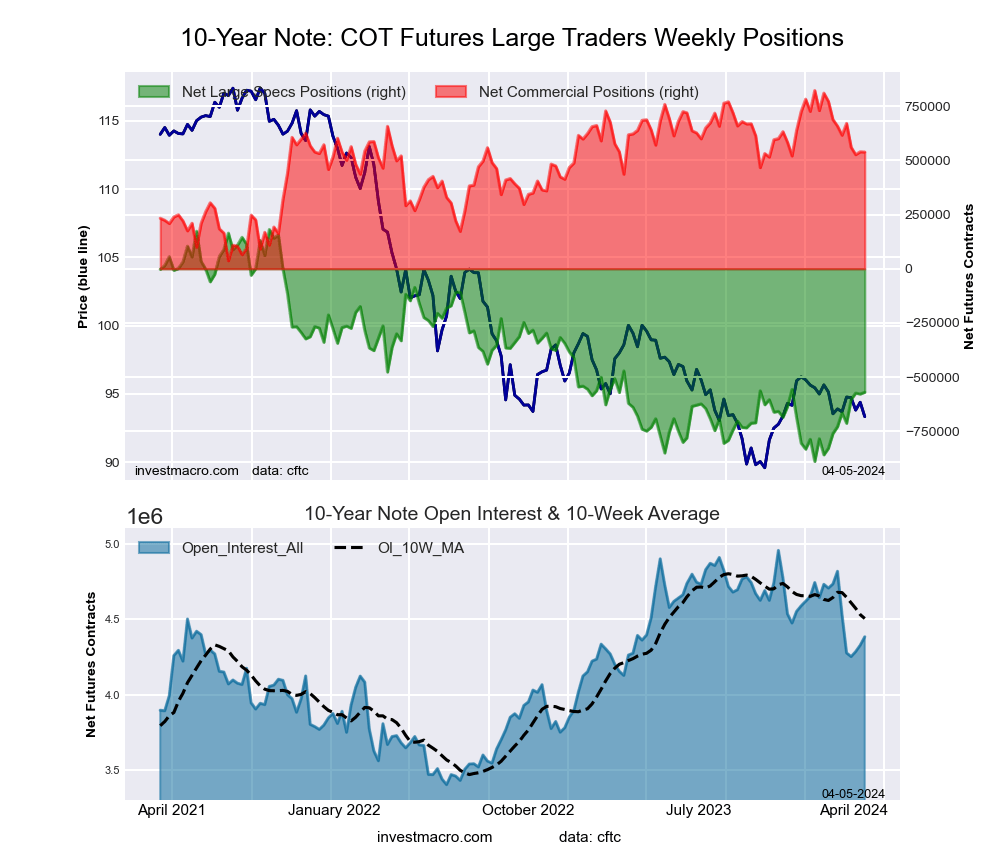
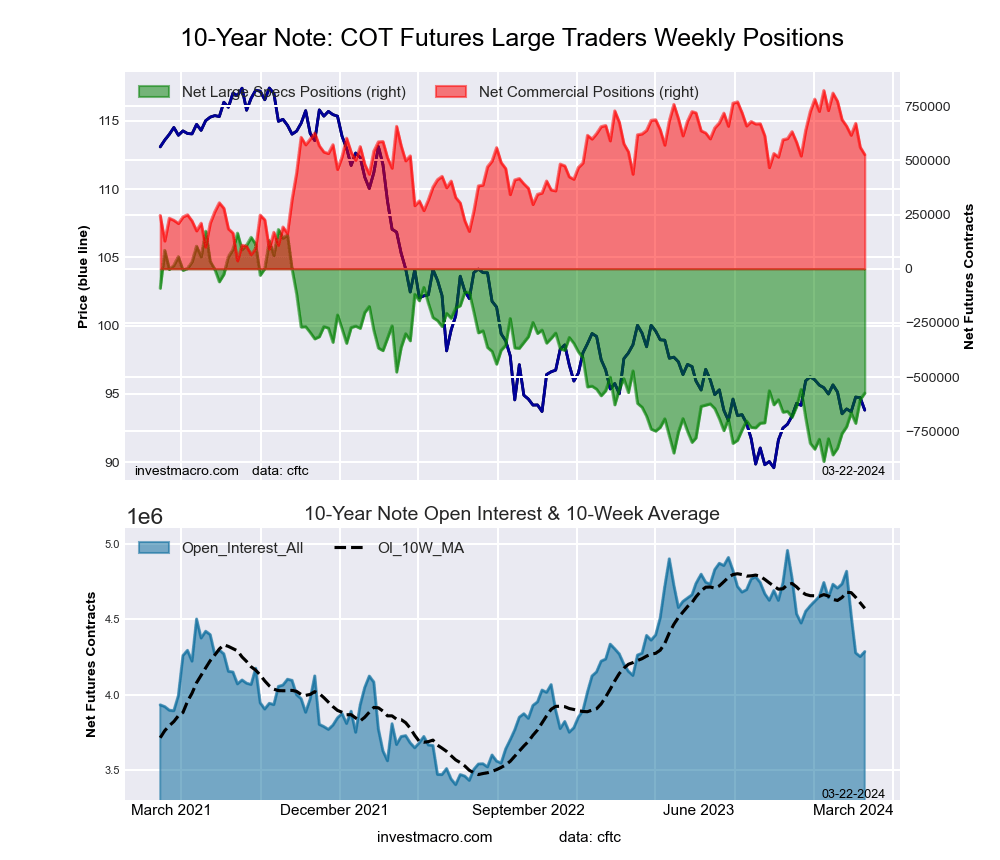
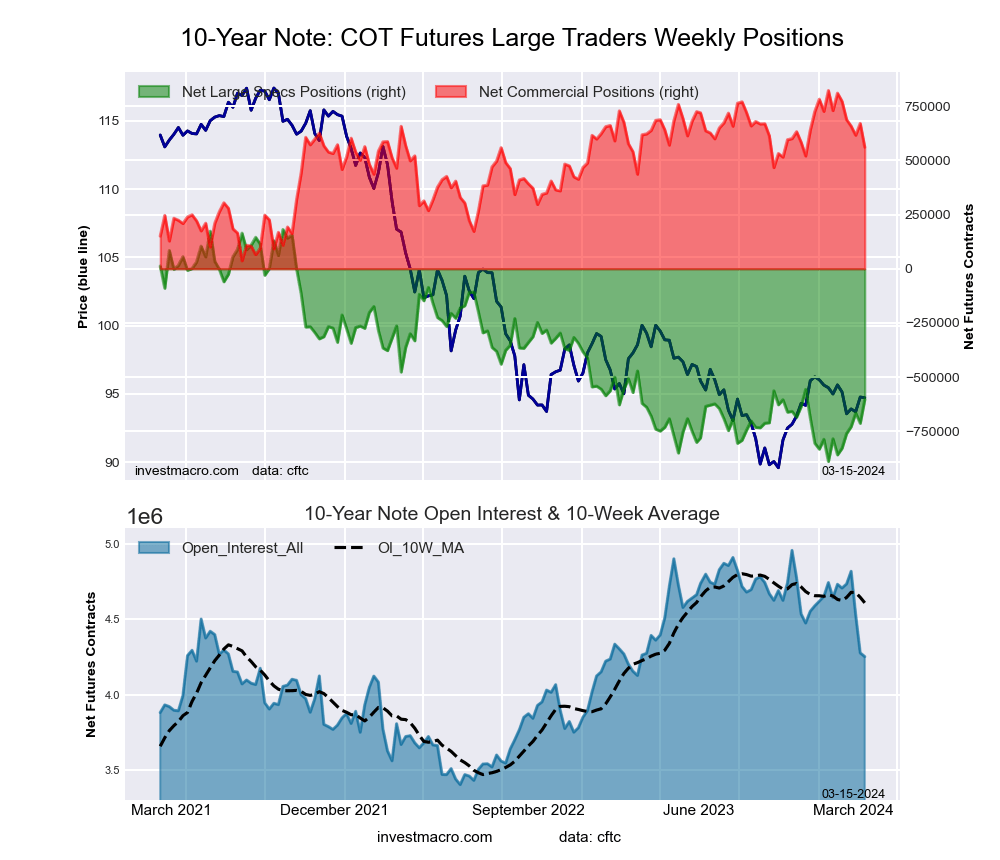
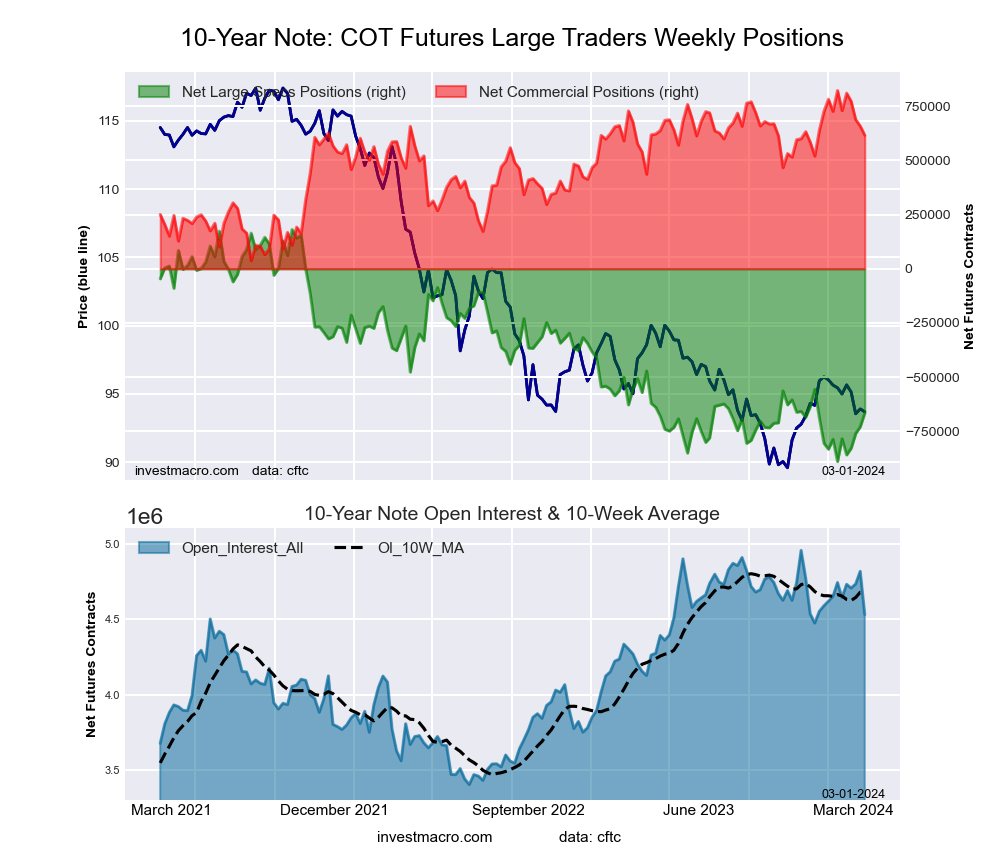
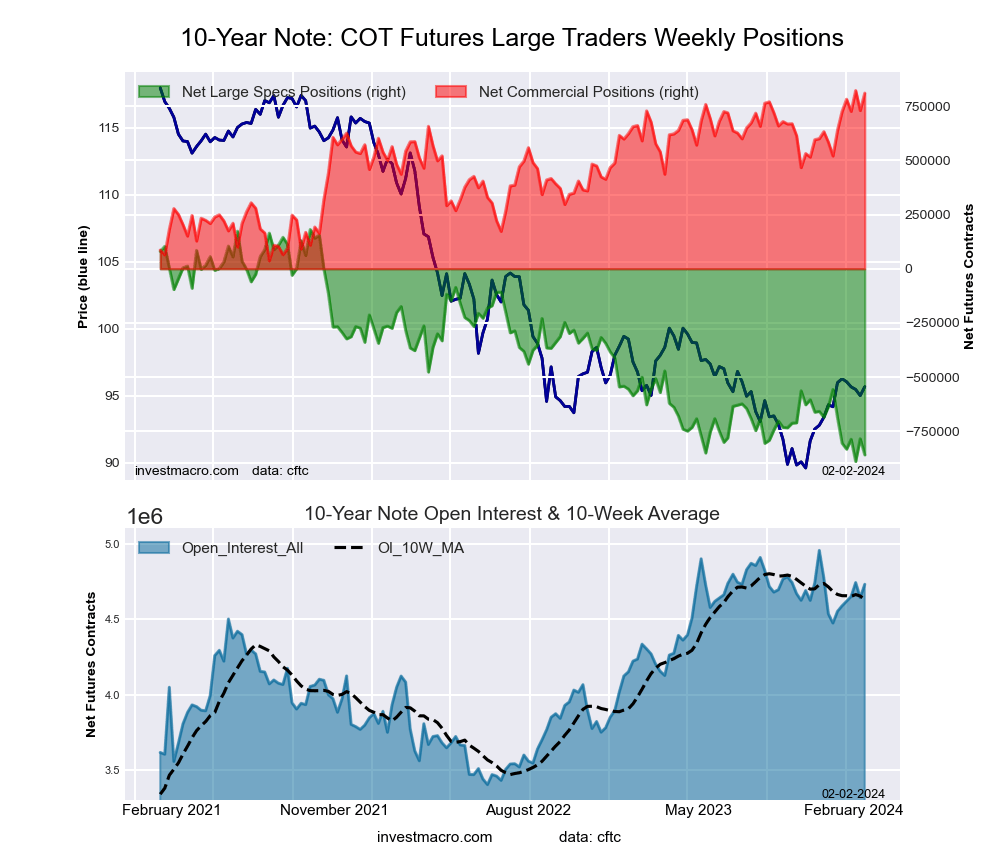
10-Year Treasury Note Futures:
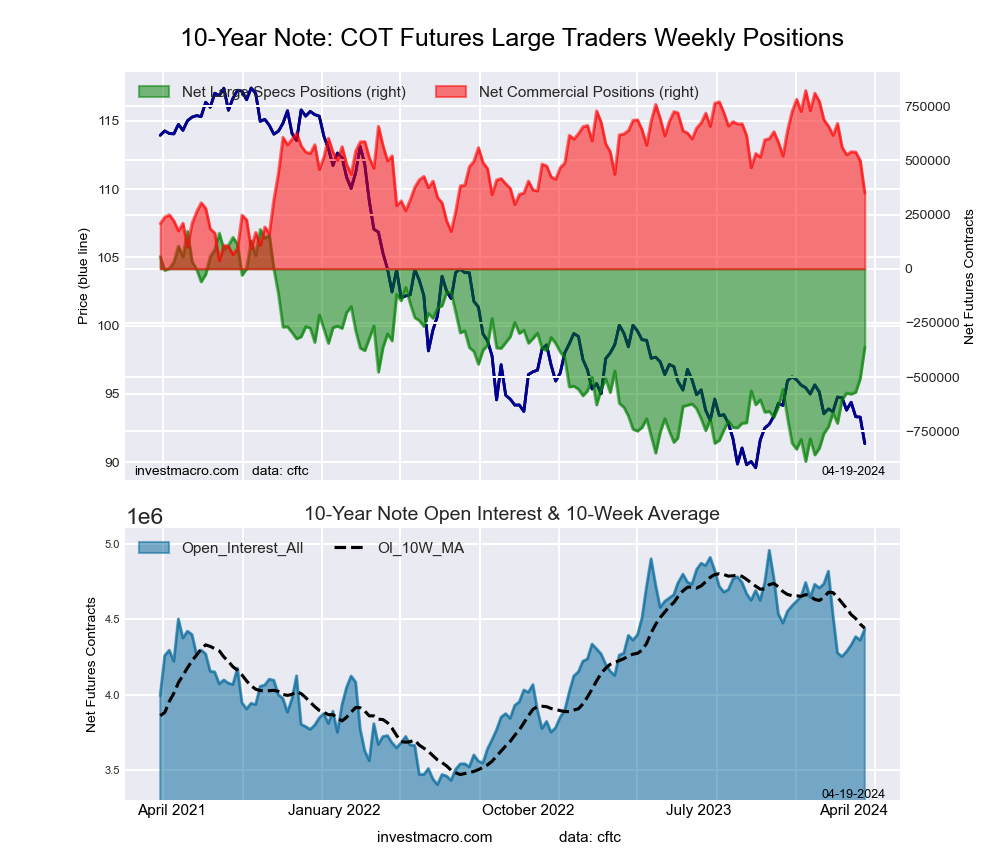 The 10-Year Treasury Note large speculator standing this week was a net position of -362,039 contracts in the data reported through Tuesday. This was a weekly rise of 144,846 contracts from the previous week which had a total of -506,885 net contracts.
This week’s current strength score (the trader positioning range over the past three years, measured from 0 to 100) shows the speculators are currently Bearish with a score of 49.3 percent. The commercials are Bearish with a score of 39.8 percent and the small traders (not shown in chart) are Bullish with a score of 76.1 percent.
Price Trend-Following Model: Strong Downtrend
Our weekly trend-following model classifies the current market price position as: Strong Downtrend. The current action for the model is considered to be: Hold – Maintain Short Position.
| 10-Year Treasury Note Statistics | SPECULATORS | COMMERCIALS | SMALL TRADERS |
| – Percent of Open Interest Longs: | 12.0 | 75.9 | 9.2 |
| – Percent of Open Interest Shorts: | 20.2 | 68.0 | 9.0 |
| – Net Position: | -362,039 | 350,006 | 12,033 |
| – Gross Longs: | 533,604 | 3,365,808 | 410,016 |
| – Gross Shorts: | 895,643 | 3,015,802 | 397,983 |
| – Long to Short Ratio: | 0.6 to 1 | 1.1 to 1 | 1.0 to 1 |
| NET POSITION TREND: | |||
| – Strength Index Score (3 Year Range Pct): | 49.3 | 39.8 | 76.1 |
| – Strength Index Reading (3 Year Range): | Bearish | Bearish | Bullish |
| NET POSITION MOVEMENT INDEX: | |||
| – 6-Week Change in Strength Index: | 32.8 | -40.8 | -6.6 |
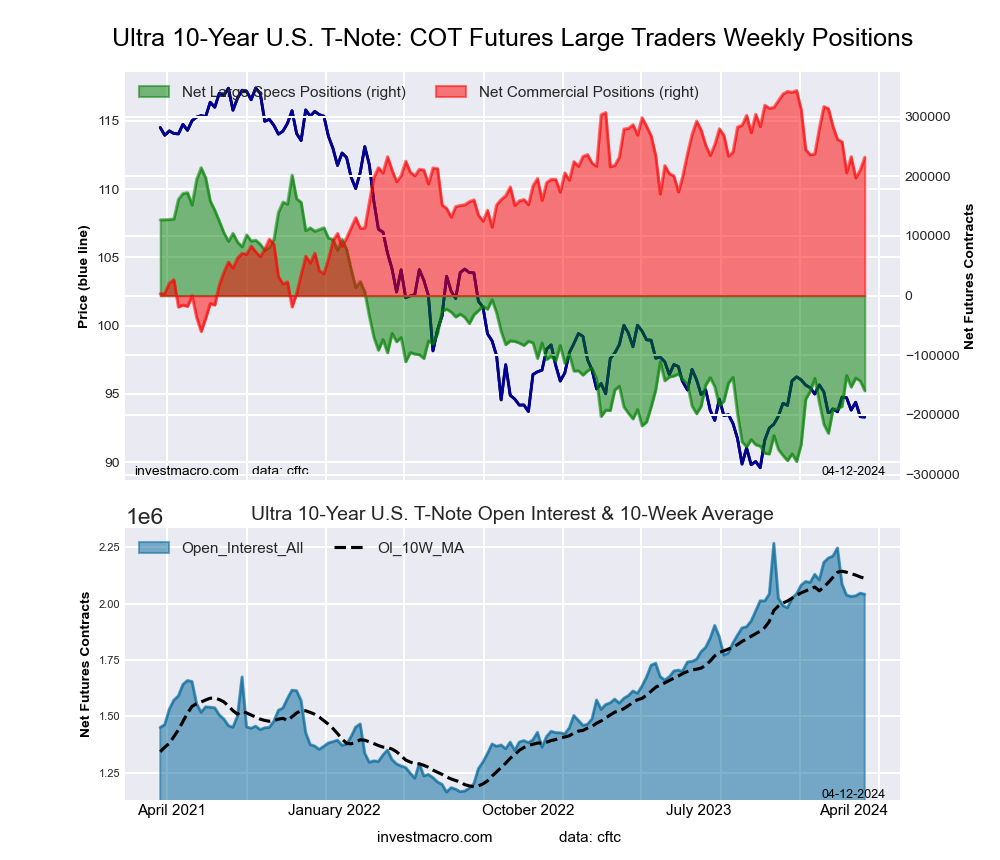
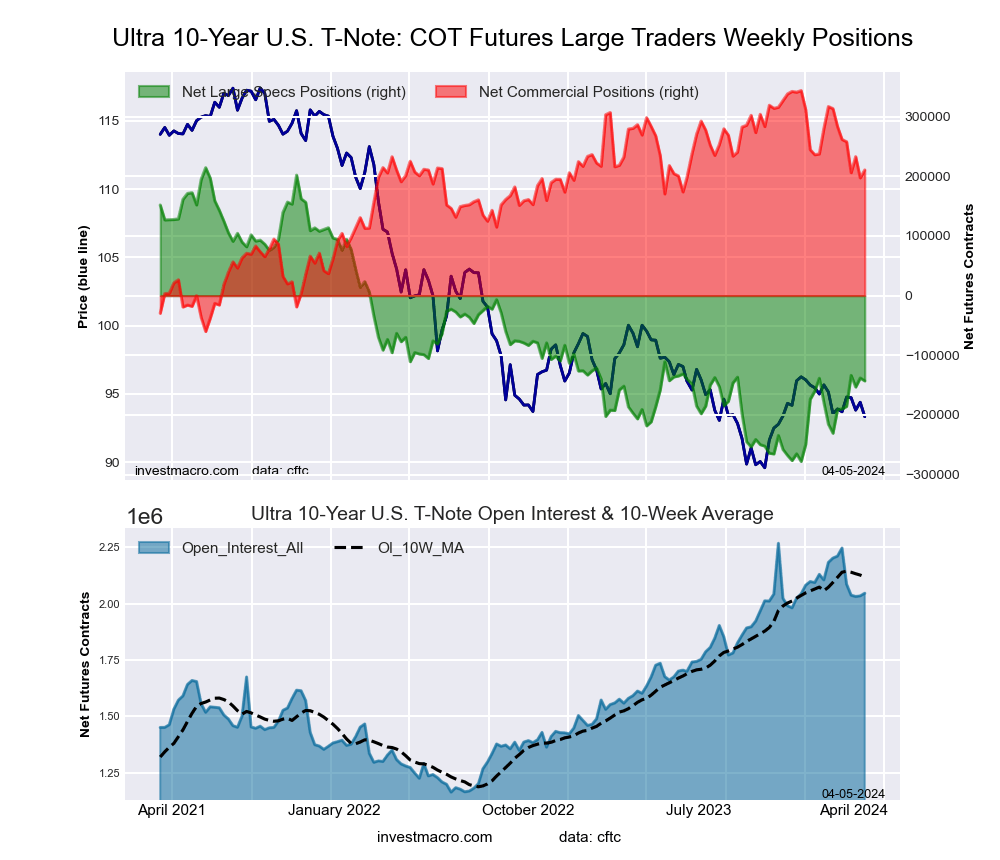
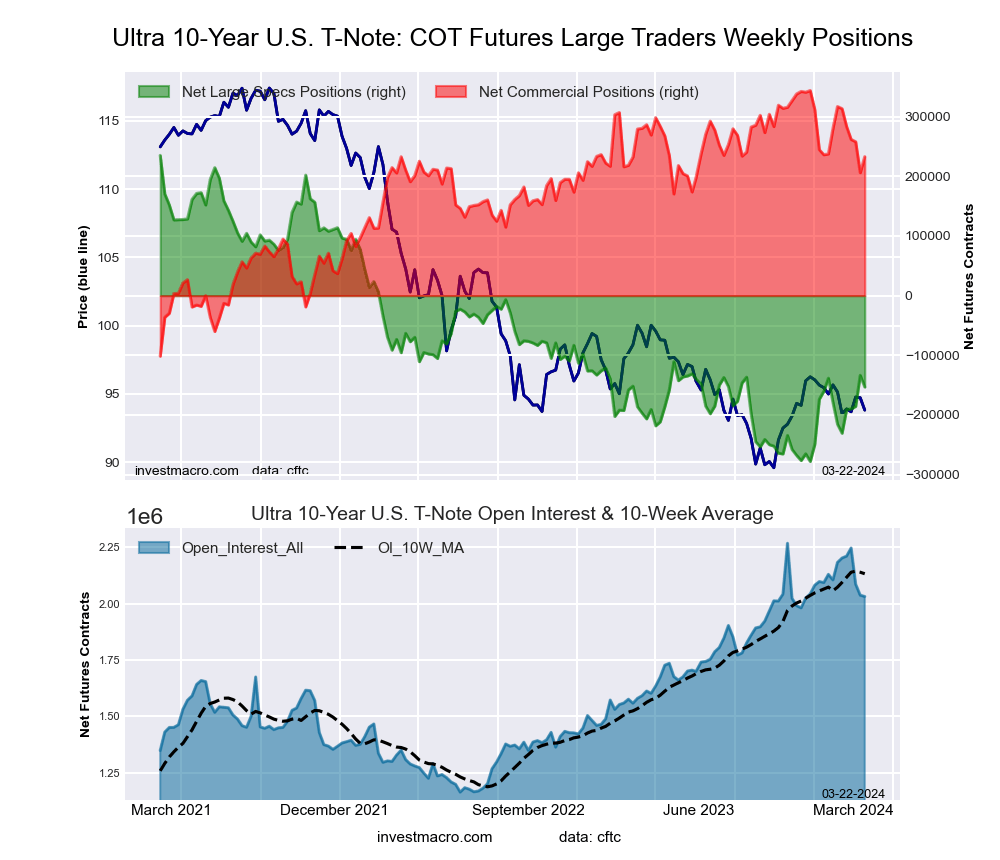
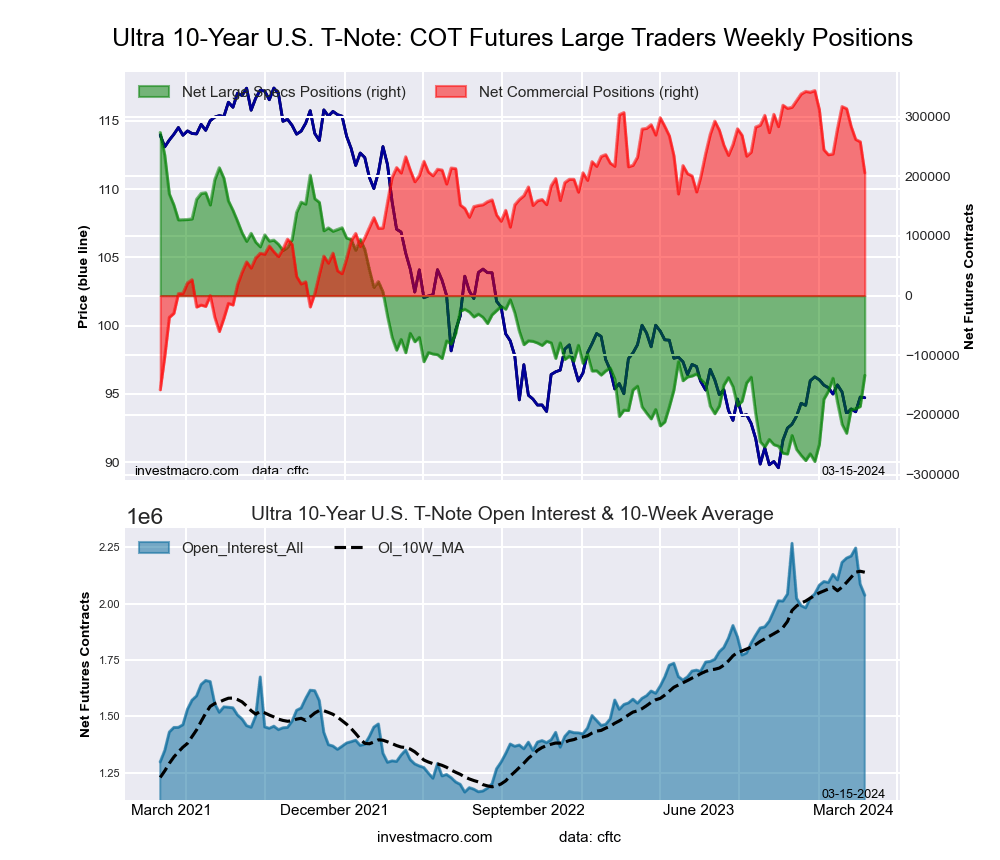
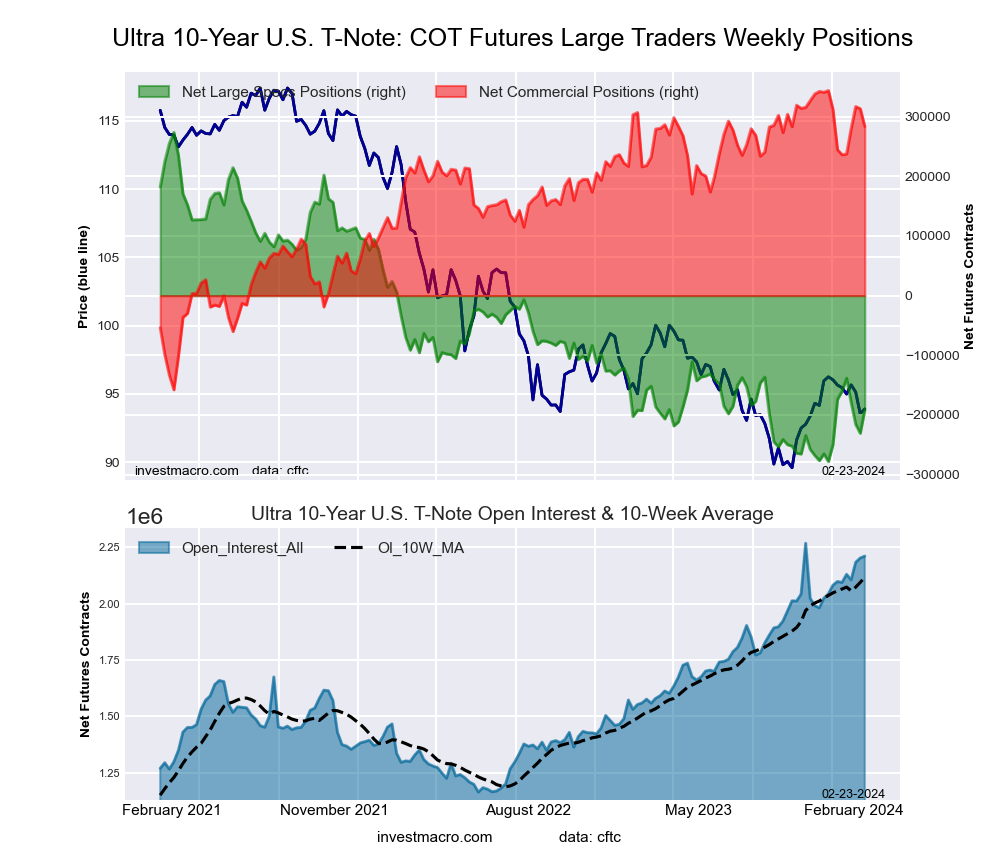
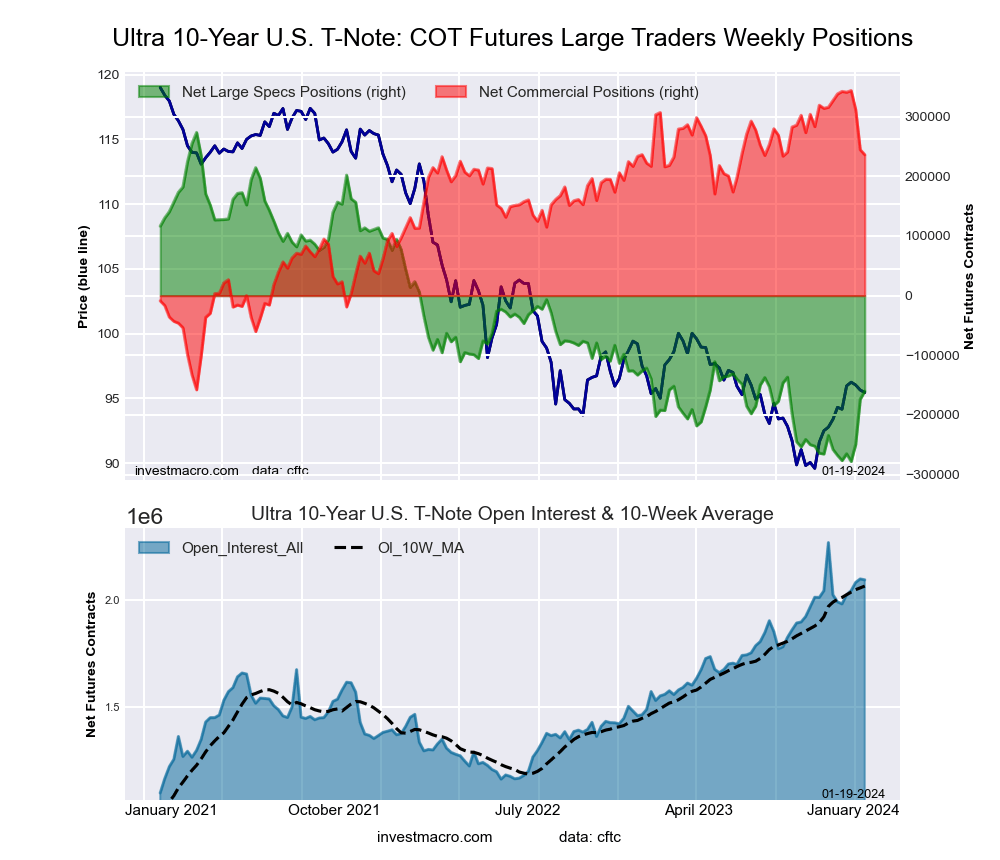
Ultra 10-Year Notes Futures:
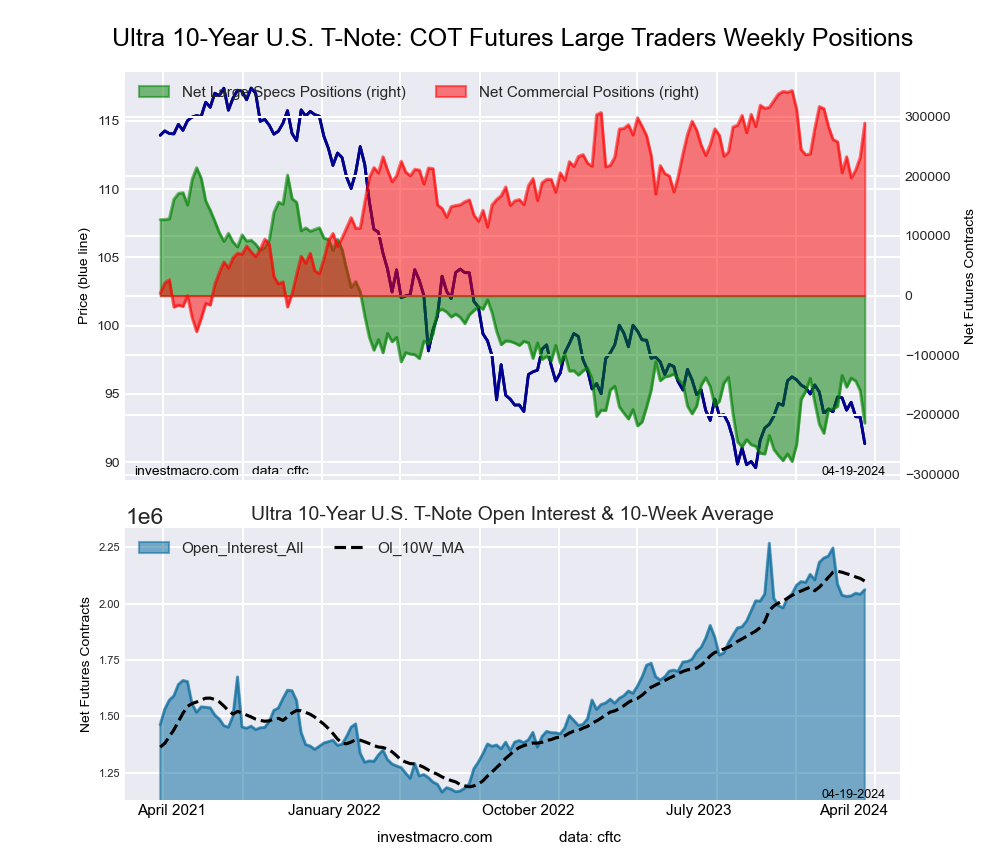 The Ultra 10-Year Notes large speculator standing this week was a net position of -213,599 contracts in the data reported through Tuesday. This was a weekly lowering of -54,176 contracts from the previous week which had a total of -159,423 net contracts.
This week’s current strength score (the trader positioning range over the past three years, measured from 0 to 100) shows the speculators are currently Bearish-Extreme with a score of 13.1 percent. The commercials are Bullish-Extreme with a score of 86.5 percent and the small traders (not shown in chart) are Bullish with a score of 69.1 percent.
Price Trend-Following Model: Weak Uptrend
Our weekly trend-following model classifies the current market price position as: Weak Uptrend. The current action for the model is considered to be: Hold – Maintain Long Position.
| Ultra 10-Year Notes Statistics | SPECULATORS | COMMERCIALS | SMALL TRADERS |
| – Percent of Open Interest Longs: | 13.0 | 75.4 | 10.2 |
| – Percent of Open Interest Shorts: | 23.3 | 61.3 | 13.8 |
| – Net Position: | -213,599 | 289,264 | -75,665 |
| – Gross Longs: | 267,202 | 1,553,846 | 209,827 |
| – Gross Shorts: | 480,801 | 1,264,582 | 285,492 |
| – Long to Short Ratio: | 0.6 to 1 | 1.2 to 1 | 0.7 to 1 |
| NET POSITION TREND: | |||
| – Strength Index Score (3 Year Range Pct): | 13.1 | 86.5 | 69.1 |
| – Strength Index Reading (3 Year Range): | Bearish-Extreme | Bullish-Extreme | Bullish |
| NET POSITION MOVEMENT INDEX: | |||
| – 6-Week Change in Strength Index: | -5.7 | 7.7 | -1.9 |
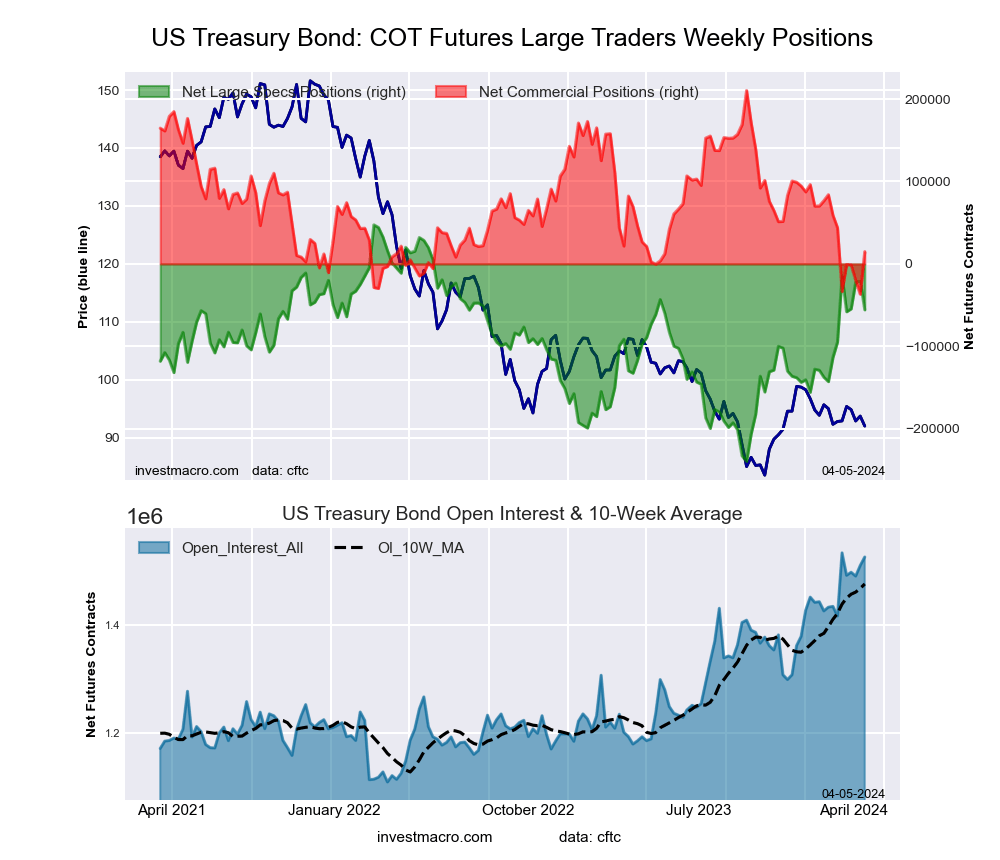
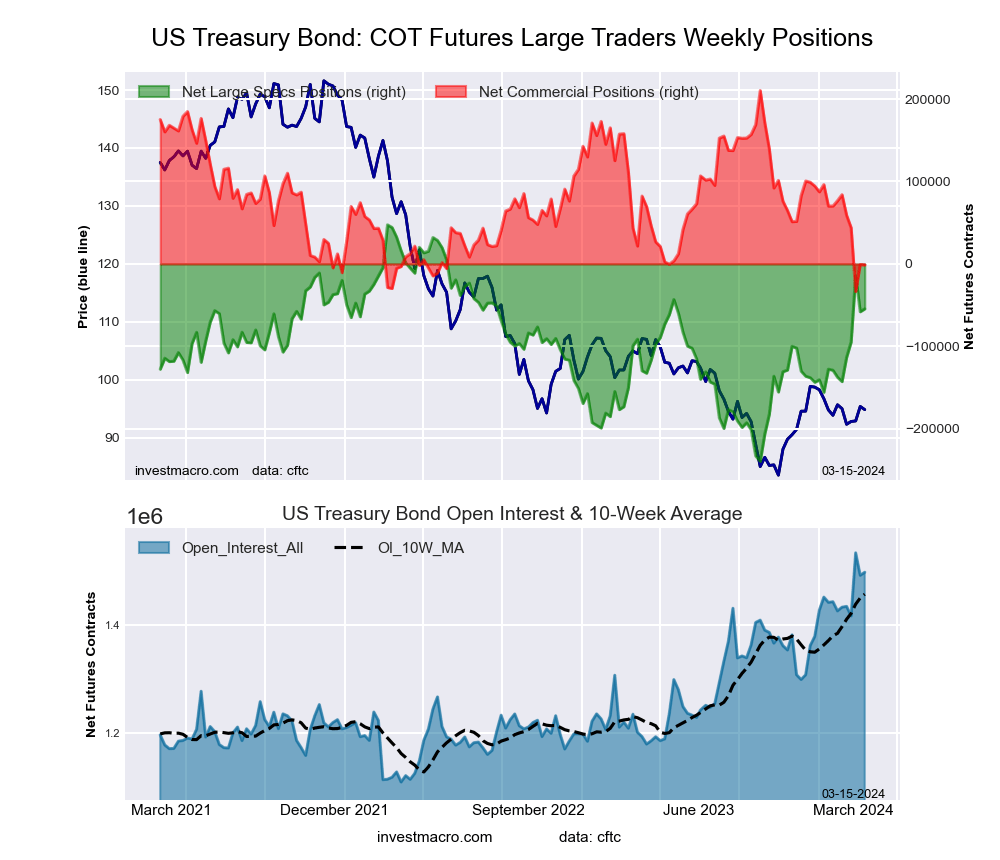
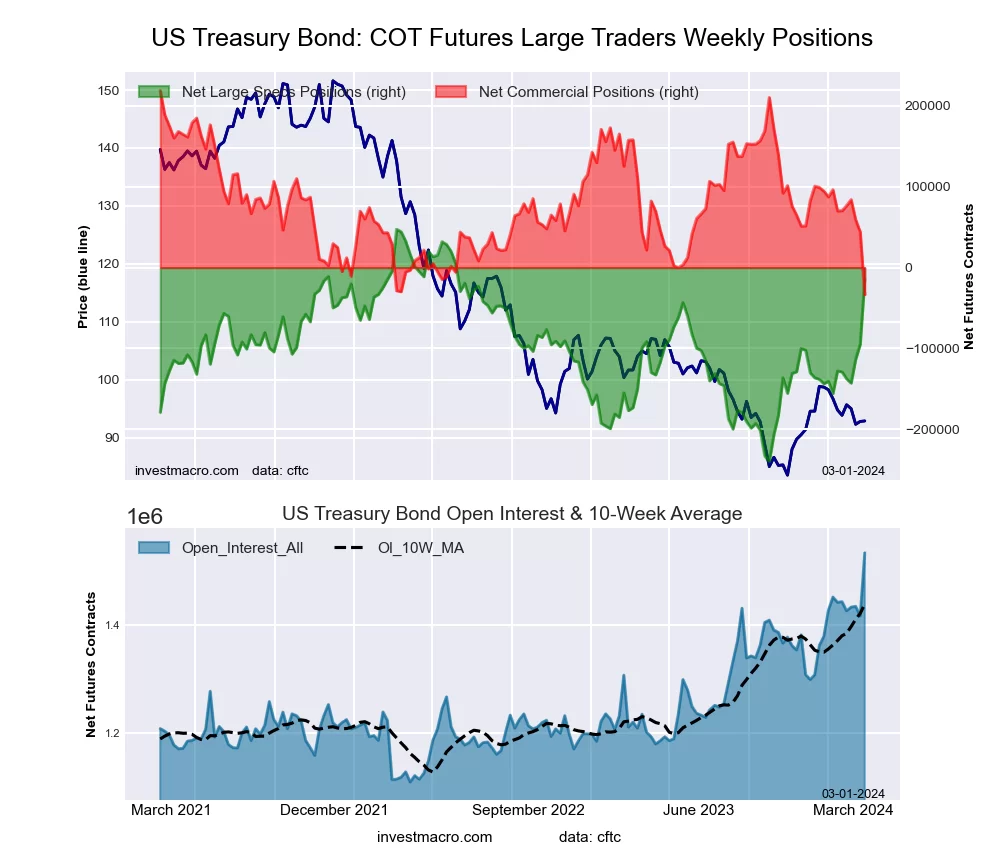
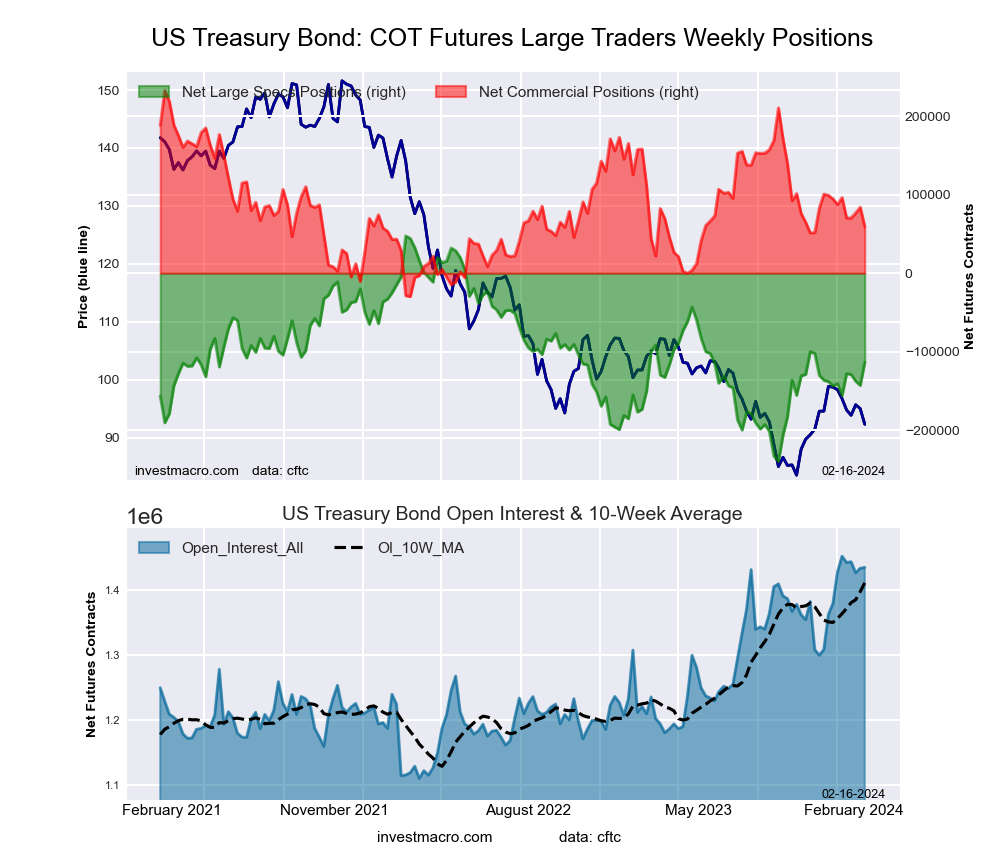
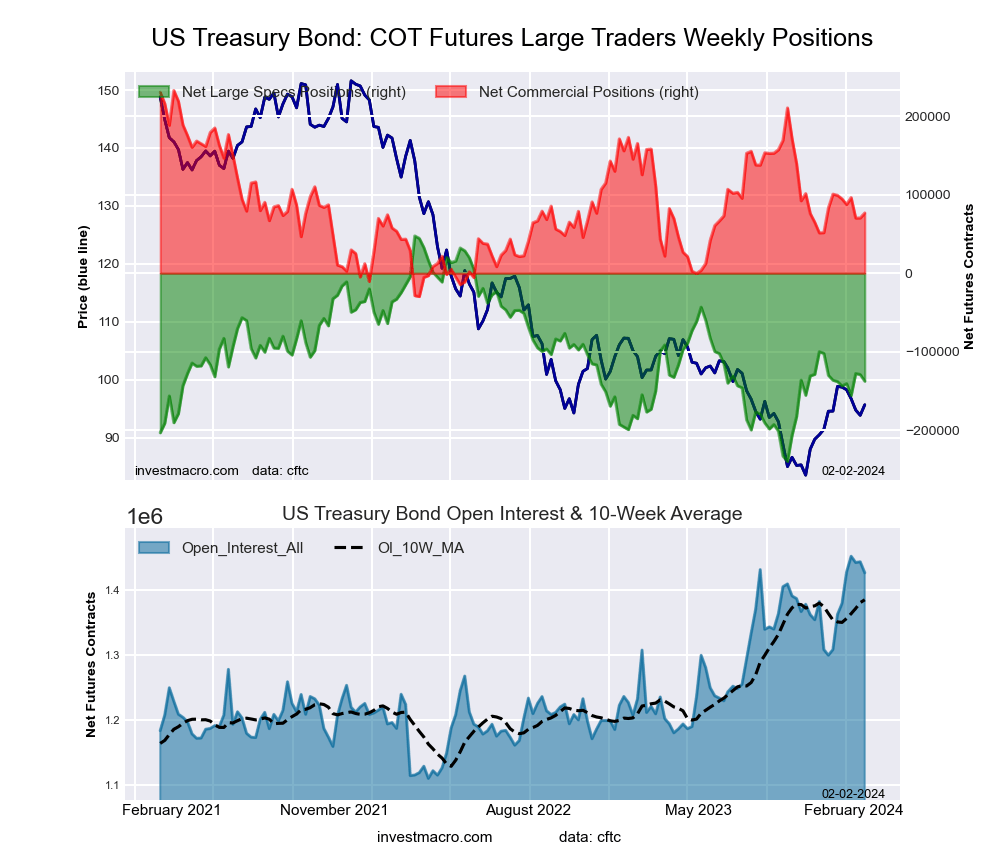
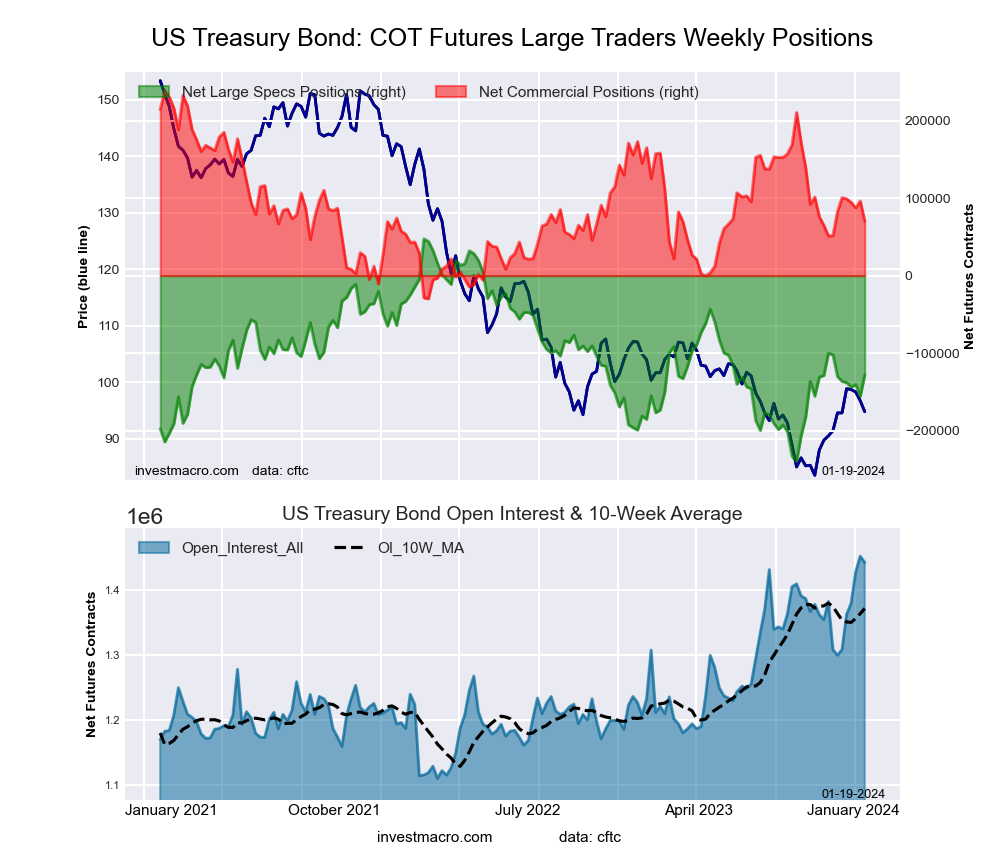
US Treasury Bonds Futures:
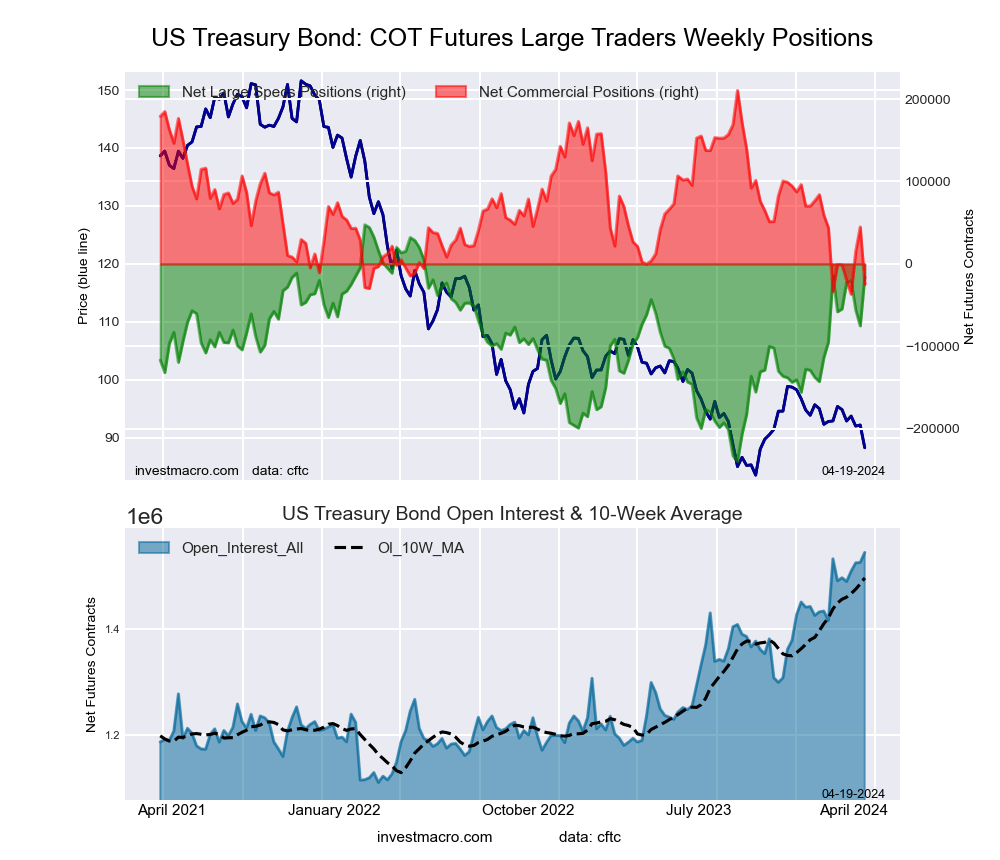 The US Treasury Bonds large speculator standing this week was a net position of -15,764 contracts in the data reported through Tuesday. This was a weekly increase of 59,426 contracts from the previous week which had a total of -75,190 net contracts.
This week’s current strength score (the trader positioning range over the past three years, measured from 0 to 100) shows the speculators are currently Bullish with a score of 78.0 percent. The commercials are Bearish-Extreme with a score of 4.9 percent and the small traders (not shown in chart) are Bullish with a score of 77.8 percent.
Price Trend-Following Model: Strong Downtrend
Our weekly trend-following model classifies the current market price position as: Strong Downtrend. The current action for the model is considered to be: Hold – Maintain Short Position.
| US Treasury Bonds Statistics | SPECULATORS | COMMERCIALS | SMALL TRADERS |
| – Percent of Open Interest Longs: | 16.7 | 69.7 | 12.7 |
| – Percent of Open Interest Shorts: | 17.7 | 71.3 | 10.1 |
| – Net Position: | -15,764 | -24,594 | 40,358 |
| – Gross Longs: | 257,665 | 1,077,192 | 195,936 |
| – Gross Shorts: | 273,429 | 1,101,786 | 155,578 |
| – Long to Short Ratio: | 0.9 to 1 | 1.0 to 1 | 1.3 to 1 |
| NET POSITION TREND: | |||
| – Strength Index Score (3 Year Range Pct): | 78.0 | 4.9 | 77.8 |
| – Strength Index Reading (3 Year Range): | Bullish | Bearish-Extreme | Bullish |
| NET POSITION MOVEMENT INDEX: | |||
| – 6-Week Change in Strength Index: | 14.7 | -9.6 | -13.5 |
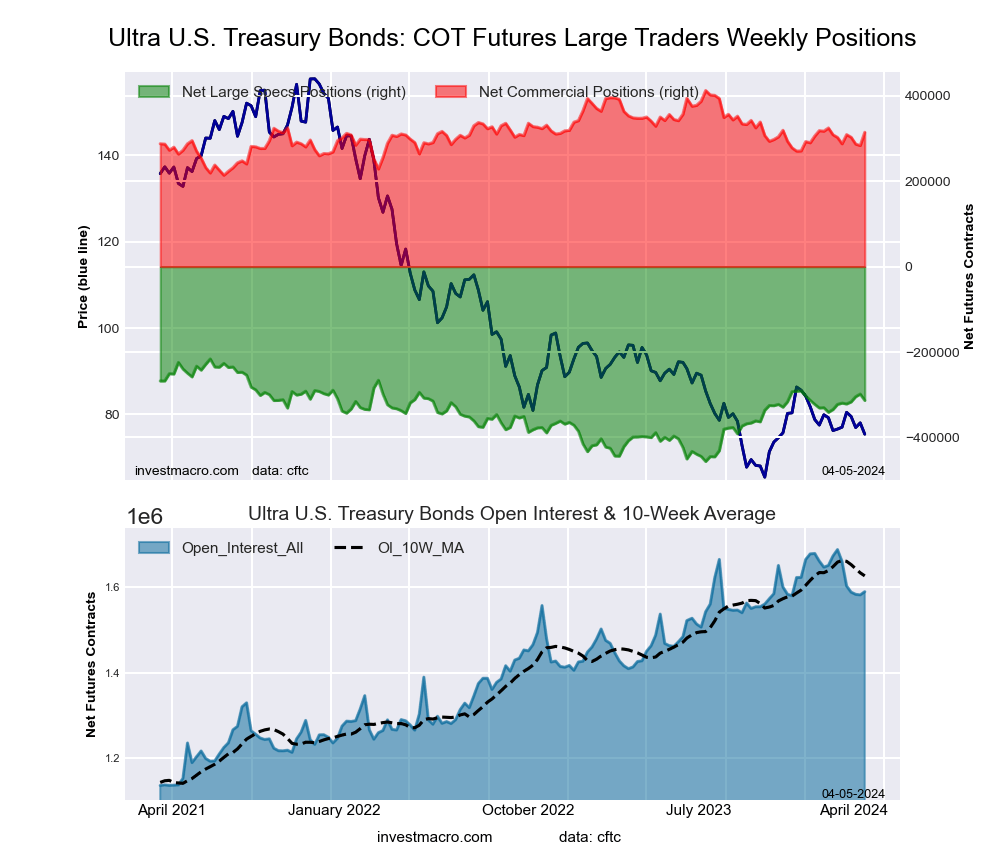
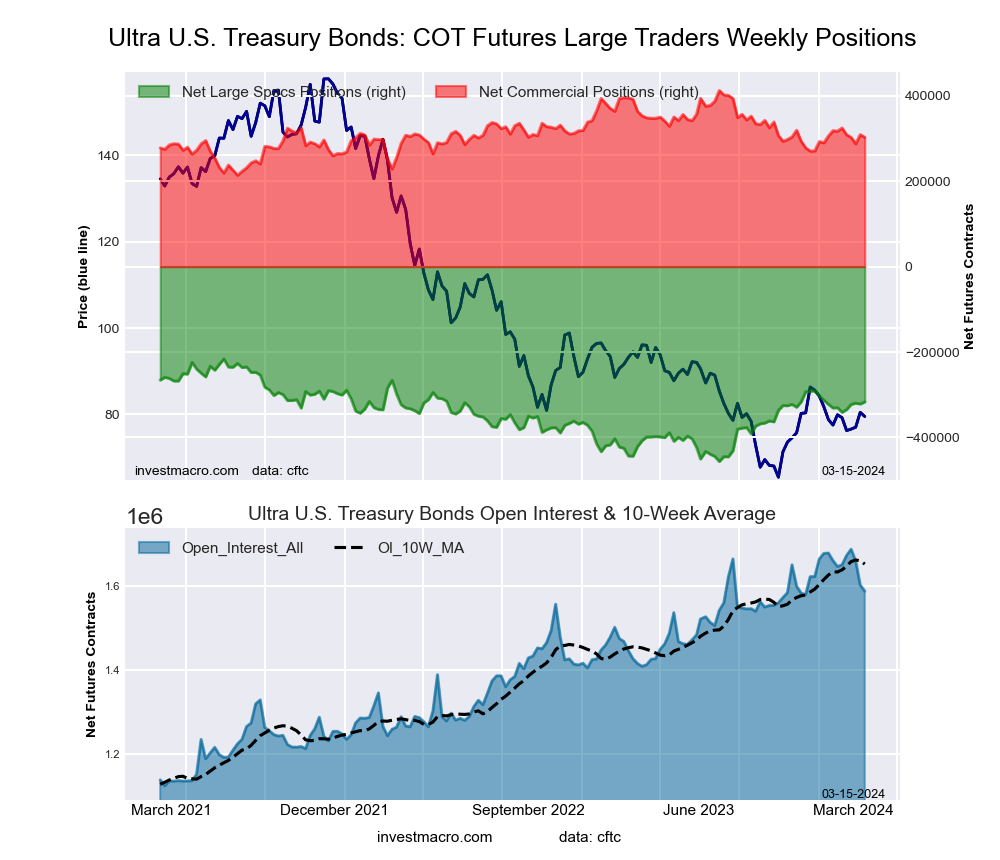
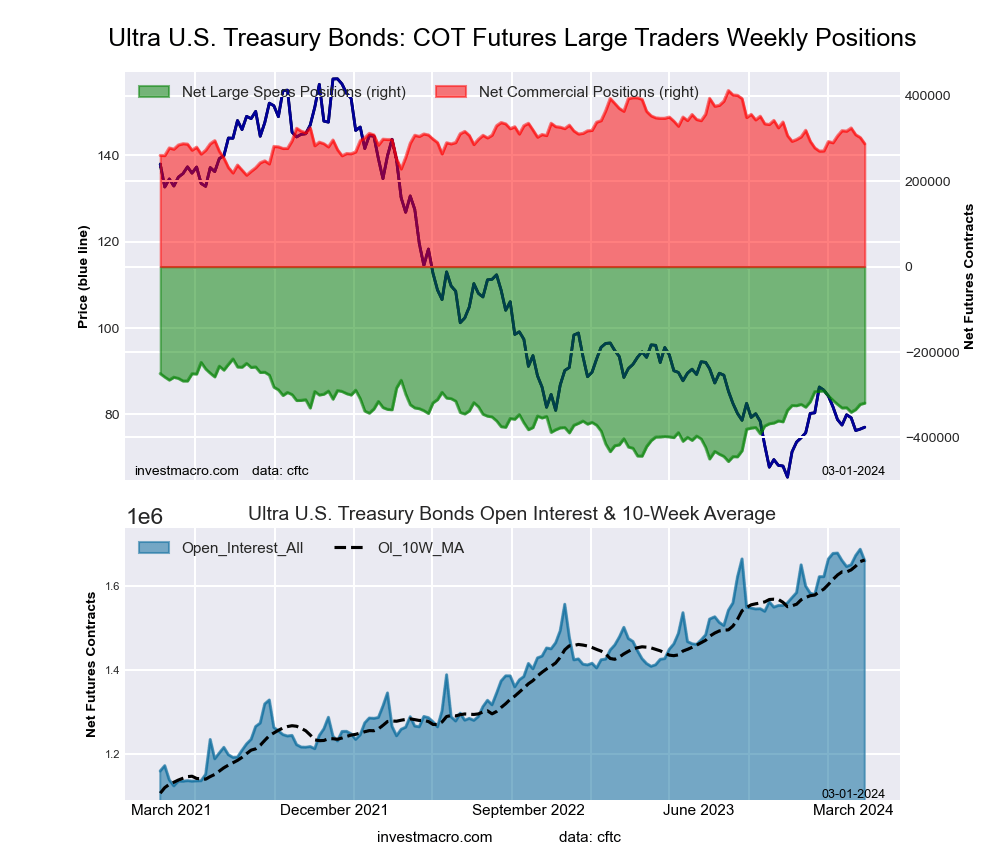
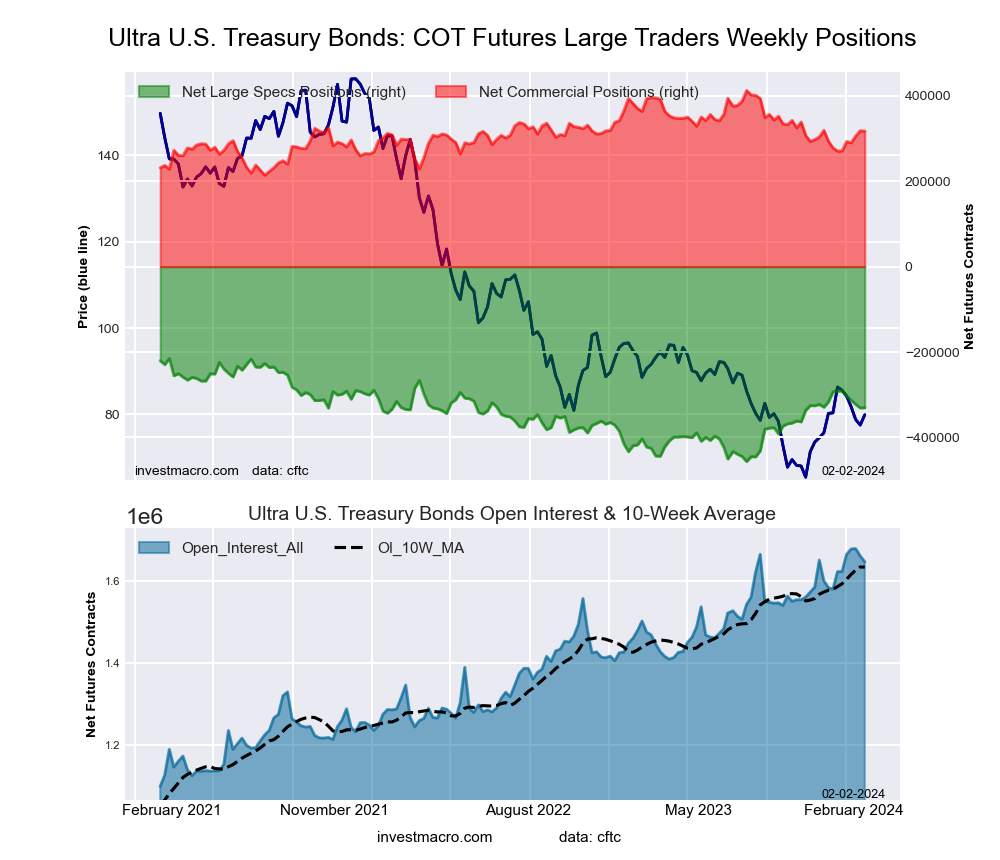
Ultra US Treasury Bonds Futures:
 The Ultra US Treasury Bonds large speculator standing this week was a net position of -294,800 contracts in the data reported through Tuesday. This was a weekly gain of 1,055 contracts from the previous week which had a total of -295,855 net contracts.
This week’s current strength score (the trader positioning range over the past three years, measured from 0 to 100) shows the speculators are currently Bullish with a score of 67.3 percent. The commercials are Bearish with a score of 39.7 percent and the small traders (not shown in chart) are Bearish with a score of 38.8 percent.
Price Trend-Following Model: Strong Downtrend
Our weekly trend-following model classifies the current market price position as: Strong Downtrend. The current action for the model is considered to be: Hold – Maintain Short Position.
| Ultra US Treasury Bonds Statistics | SPECULATORS | COMMERCIALS | SMALL TRADERS |
| – Percent of Open Interest Longs: | 8.6 | 80.3 | 10.9 |
| – Percent of Open Interest Shorts: | 26.9 | 62.1 | 10.8 |
| – Net Position: | -294,800 | 293,080 | 1,720 |
| – Gross Longs: | 138,661 | 1,291,687 | 175,118 |
| – Gross Shorts: | 433,461 | 998,607 | 173,398 |
| – Long to Short Ratio: | 0.3 to 1 | 1.3 to 1 | 1.0 to 1 |
| NET POSITION TREND: | |||
| – Strength Index Score (3 Year Range Pct): | 67.3 | 39.7 | 38.8 |
| – Strength Index Reading (3 Year Range): | Bullish | Bearish | Bearish |
| NET POSITION MOVEMENT INDEX: | |||
| – 6-Week Change in Strength Index: | 11.2 | -8.1 | -10.2 |
Article By InvestMacro – Receive our weekly COT Newsletter
*COT Report: The COT data, released weekly to the public each Friday, is updated through the most recent Tuesday (data is 3 days old) and shows a quick view of how large speculators or non-commercials (for-profit traders) were positioned in the futures markets.
The CFTC categorizes trader positions according to commercial hedgers (traders who use futures contracts for hedging as part of the business), non-commercials (large traders who speculate to realize trading profits) and nonreportable traders (usually small traders/speculators) as well as their open interest (contracts open in the market at time of reporting). See CFTC criteria here.