
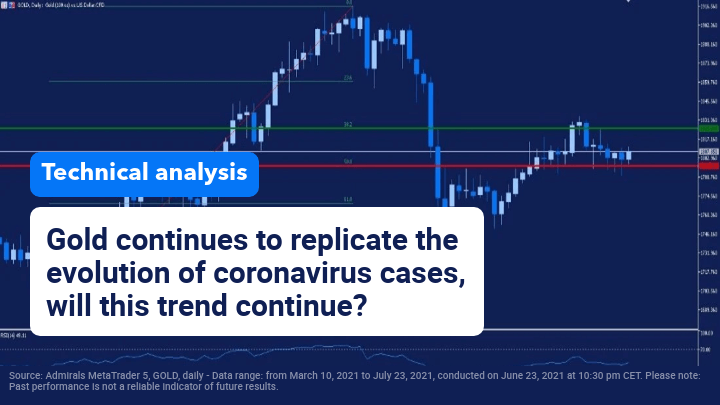
Gold is one of the world’s main safe haven assets. Its price tends to rise in times of crisis and high volatility, as has been seen in the coronavirus crisis.
In recent months there has been a staggering correlation between the number of coronavirus cases worldwide and the evolution of the price of gold, as can be seen from the following charts.
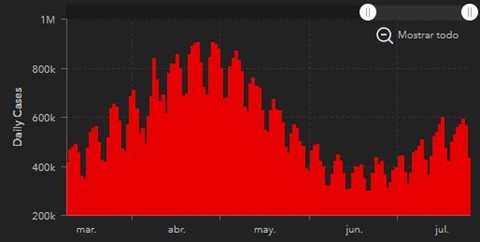
Source: Daily coronavirus cases, Center for systems for science and Engineering at John Hopkins University. Data range: From March 9, 2021 to July 23, 2021, capture made on July 26, 2021 at 10:00 pm.
Free Reports:
 Get our Weekly Commitment of Traders Reports - See where the biggest traders (Hedge Funds and Commercial Hedgers) are positioned in the futures markets on a weekly basis.
 Sign Up for Our Stock Market Newsletter – Get updated on News, Charts & Rankings of Public Companies when you join our Stocks Newsletter
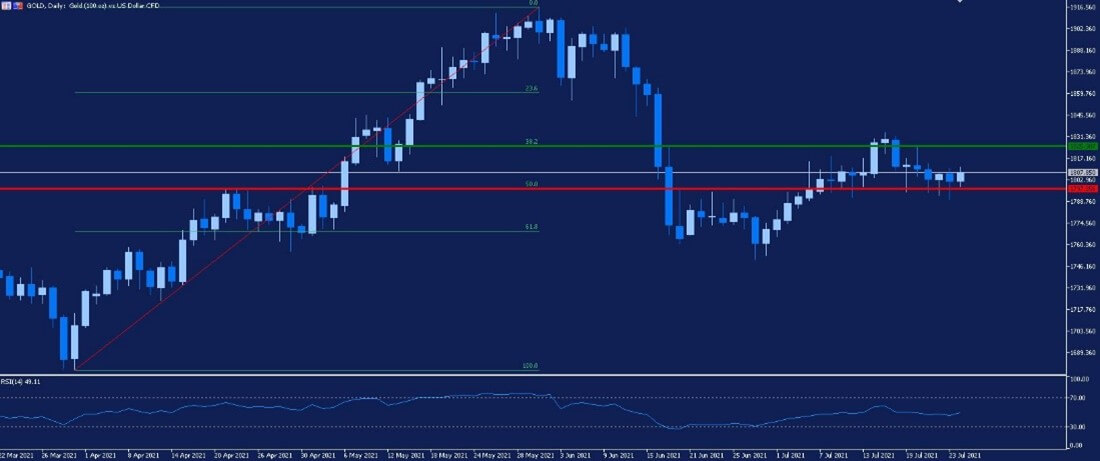 Source: Admirals MetaTrader 5, GOLD, daily – Data range: from March 10, 2021 to July 23, 2021, conducted on June 23, 2021 at 10:30 pm CET. Please note: Past performance is not a reliable indicator of future results.
The chart above measures the evolution of the price of gold on a daily basis.
In it, you can see the strong bullish rally in the price of gold from the beginning of April 2021 to the end of May.
This rally took the price from $1675 per ounce of troy to 1915, representing an advance of more than 14% in less than two months.
Although, since mid-May the RSI indicator warned that the asset was entering the overbought zone, which anticipated a possible fall.
Trades took the opportunity to collect profits causing a sharp decline in the price and re-entering the market in the support formed around the 61.8 Fibonacci retracement level.
After a first phase of stabilization, the asset is consolidating between the 38.2 and 50 levels of the Fibonacci retracement.
It seems that finally, the coronavirus pandemic has stabilized and the decline in the number of daily cases begins. Will the same thing happen with the price of gold?
Did you know that you can use the Trading Central Technical Ideas Lookup indicator to find actionable trading ideas on thousands of different markets?
Start your free download by clicking on the banner below:
INFORMATION ABOUT ANALYTICAL MATERIALS:
The given data provides additional information regarding all analysis, estimates, prognosis, forecasts, market reviews, weekly outlooks or other similar assessments or information (hereinafter “Analysis”) published on the websites of Admiral Markets investment firms operating under the Admiral Markets trademark (hereinafter “Admiral Markets”) Before making any investment decisions please pay close attention to the following:
- This is a marketing communication. The content is published for informative purposes only and is in no way to be construed as investment advice or recommendation. It has not been prepared in accordance with legal requirements designed to promote the independence of investment research, and that it is not subject to any prohibition on dealing ahead of the dissemination of investment research.
- Any investment decision is made by each client alone whereas Admiral Markets shall not be responsible for any loss or damage arising from any such decision, whether or not based on the content.
- With view to protecting the interests of our clients and the objectivity of the Analysis, Admiral Markets has established relevant internal procedures for prevention and management of conflicts of interest.
- The Analysis is prepared by an independent analyst, Javier Olivan (analyst), (hereinafter “Author”) based on their personal estimations.
- Whilst every reasonable effort is taken to ensure that all sources of the content are reliable and that all information is presented, as much as possible, in an understandable, timely, precise and complete manner, Admiral Markets does not guarantee the accuracy or completeness of any information contained within the Analysis.
- Any kind of past or modeled performance of financial instruments indicated within the content should not be construed as an express or implied promise, guarantee or implication by Admiral Markets for any future performance. The value of the financial instrument may both increase and decrease and the preservation of the asset value is not guaranteed.
- Leveraged products (including contracts for difference) are speculative in nature and may result in losses or profit. Before you start trading, please ensure that you fully understand the risks involved.

- Target Thursdays: NAS100, Robusta Coffee, USDCHF Apr 25, 2024
- QCOM wants to create competition in the AI chip market. Hong Kong index hits five-month high Apr 25, 2024
- Japanese yen hits all-time low as BoJ meeting commences Apr 25, 2024
- TSLA shares rose on a weak report. Inflationary pressures are easing in Australia Apr 24, 2024
- USDJPY: On intervention watch Apr 24, 2024
- Euro gains against the dollar amid mixed economic signals Apr 24, 2024
- PMI data is the focus of investors’ attention today. Turkey, Iraq, Qatar, and UAE signed a transportation agreement Apr 23, 2024
- Australian dollar rises on strong economic indicators Apr 23, 2024
- Geopolitical risks in the Middle East are declining. China kept interest rates at lows Apr 22, 2024
- Brent crude dips to four-week low amid easing geopolitical tensions Apr 22, 2024