
Article By RoboForex.com
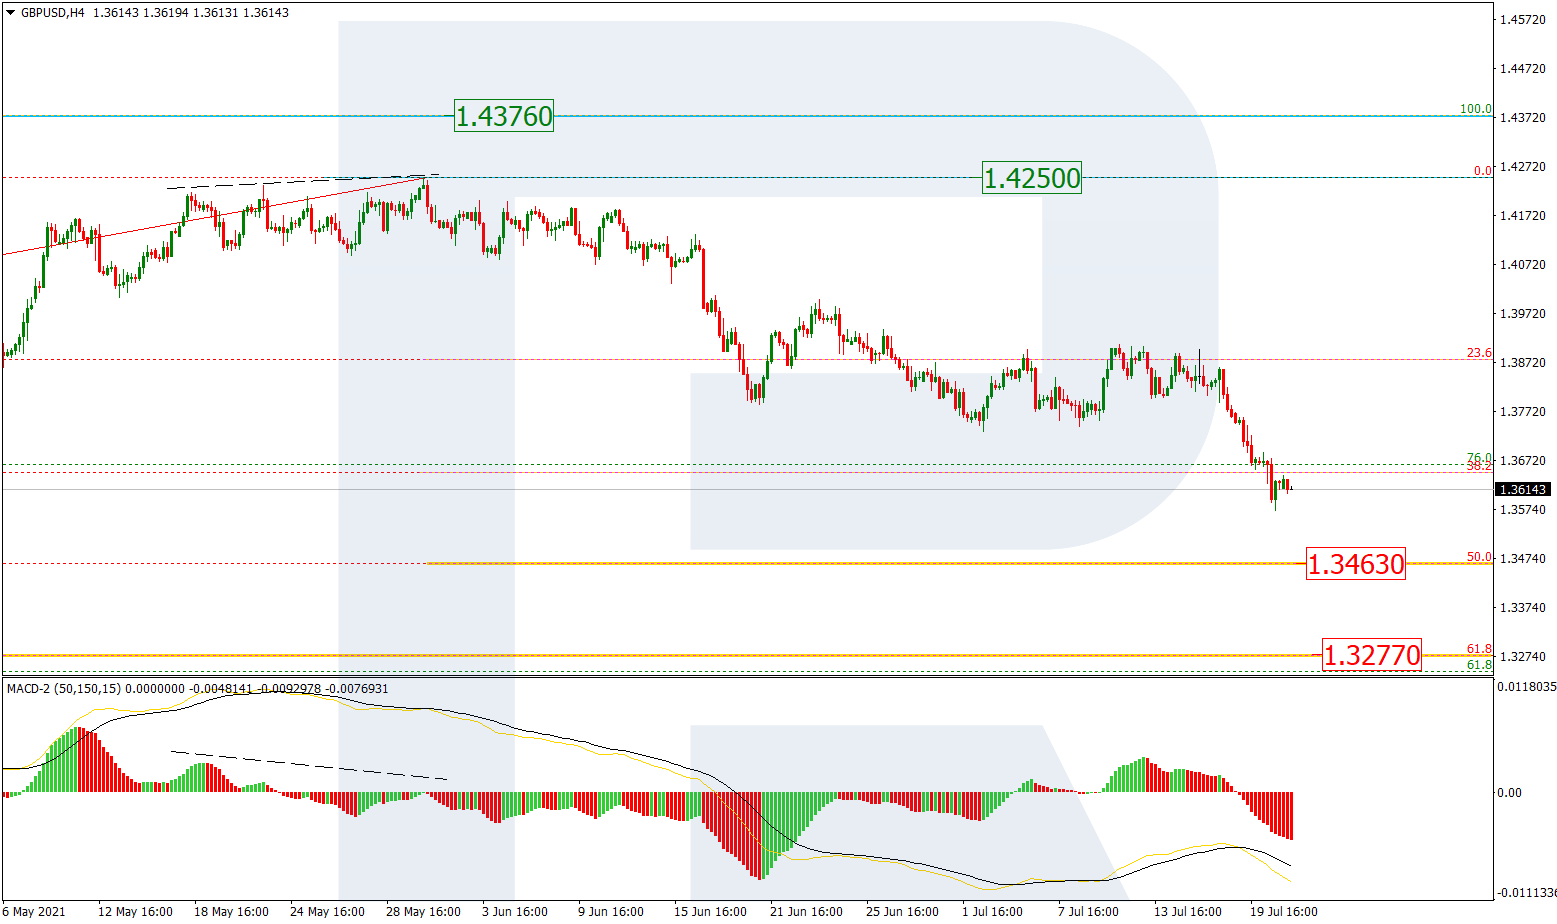
GBPUSD, “Great Britain Pound vs US Dollar”
As we can see in the H4 chart, after completing the correction not far from 23.6% fibo, GBPUSD is moving downwards and has already broken 38.2% fibo. Later, the market may continue trading downwards to reach 50.0% and 61.8% fibo at 1.3463 and 1.3277 respectively. The resistance remains the same, 1.4250. The asset may reach this level but only after testing 61.8% fibo at 1.3277.

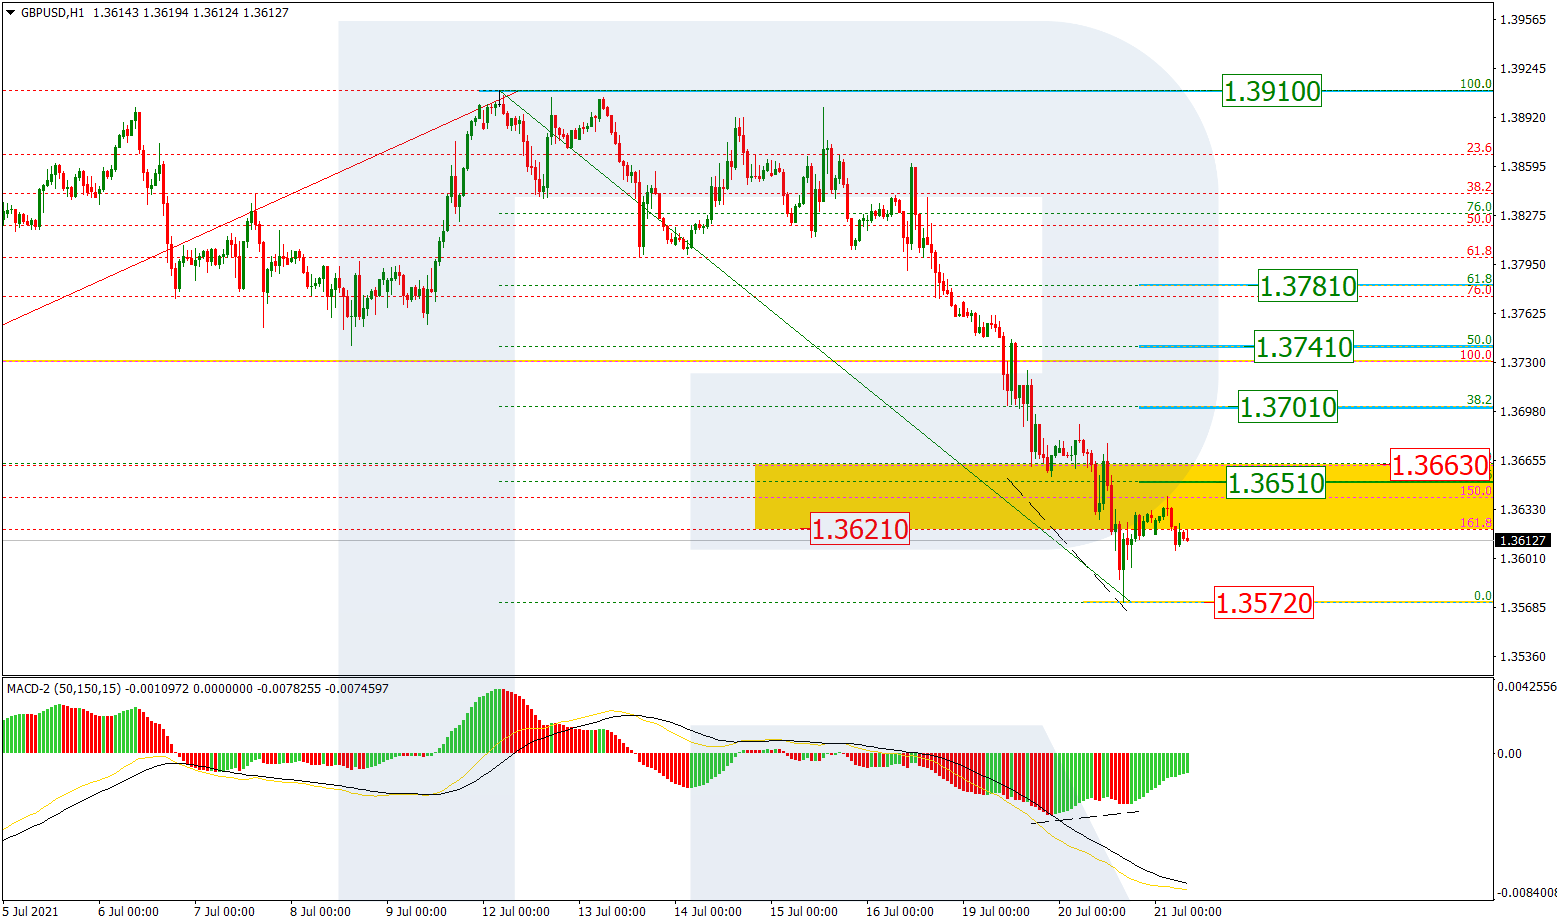
The H1 chart shows a potential of the current correction after convergence on MACD and a breakout of the post-correctional extension area. The first rising wave is heading towards 23.6% fibo at 1.3651, while the next ones may reach 38.2%, 50.0%, and 61.8% fibo at 1.3701, 1.3741, and 1.3781 respectively. The support is the low at 1.3572.
Free Reports:
 Get our Weekly Commitment of Traders Reports - See where the biggest traders (Hedge Funds and Commercial Hedgers) are positioned in the futures markets on a weekly basis.
 Sign Up for Our Stock Market Newsletter – Get updated on News, Charts & Rankings of Public Companies when you join our Stocks Newsletter
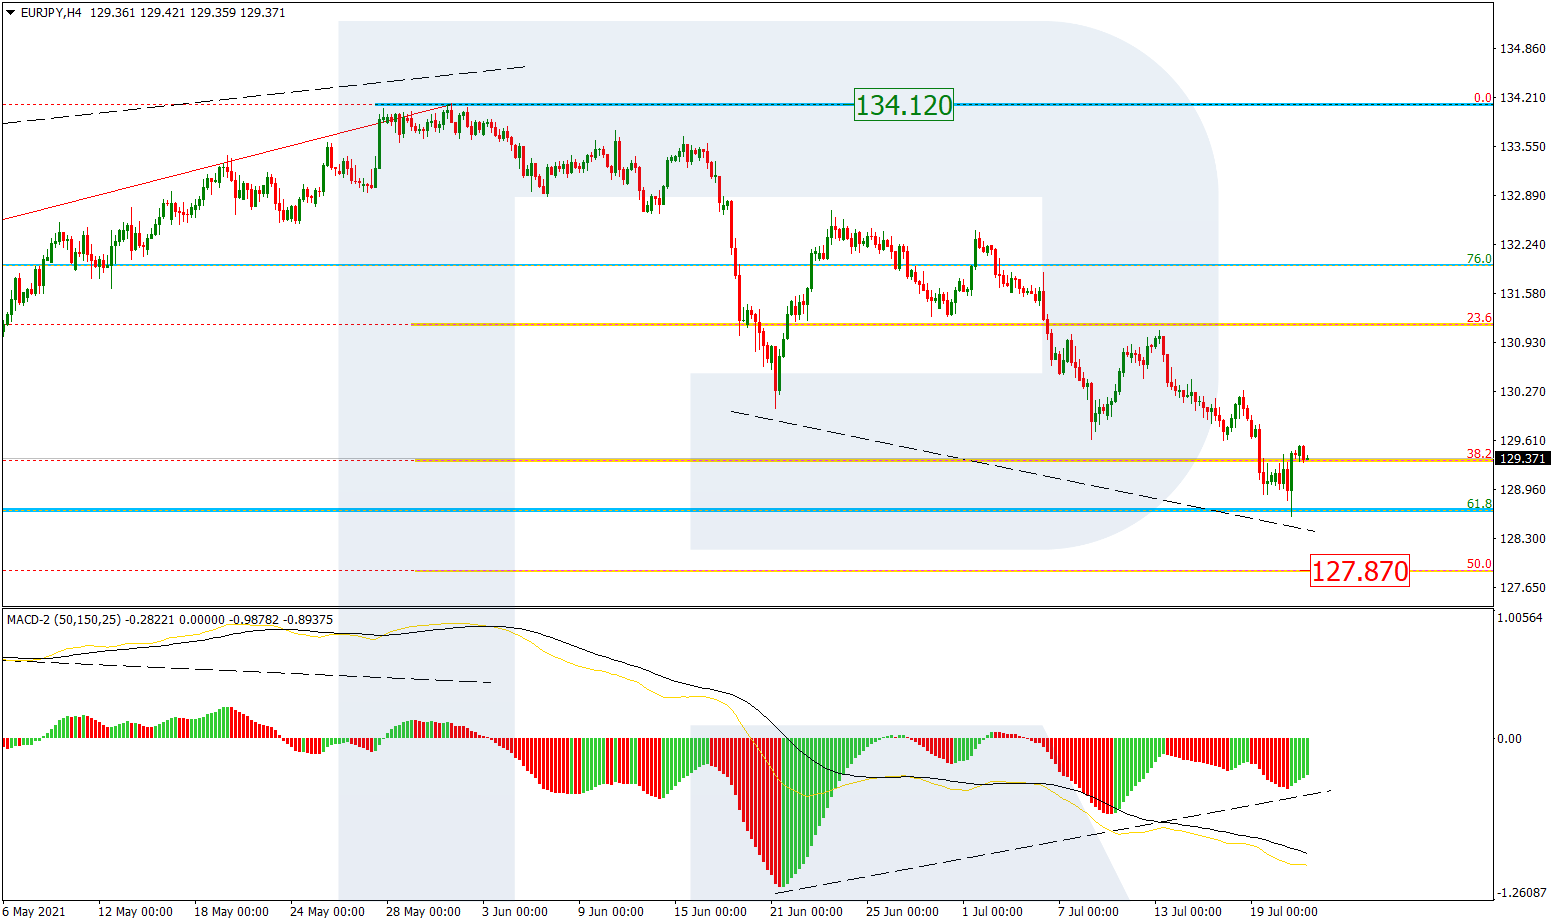
EURJPY, “Euro vs. Japanese Yen”
In the H4 chart, after breaking 38.1% fibo, EURJPY has returned to it, probably due to convergence on MACD. However, so far this movement should be considered as a short-term pullback and the market may later resume falling to reach and test 50.0% fibo at 127.87. After that, the instrument may reverse and start a wave to the upside towards the high at 134.12.
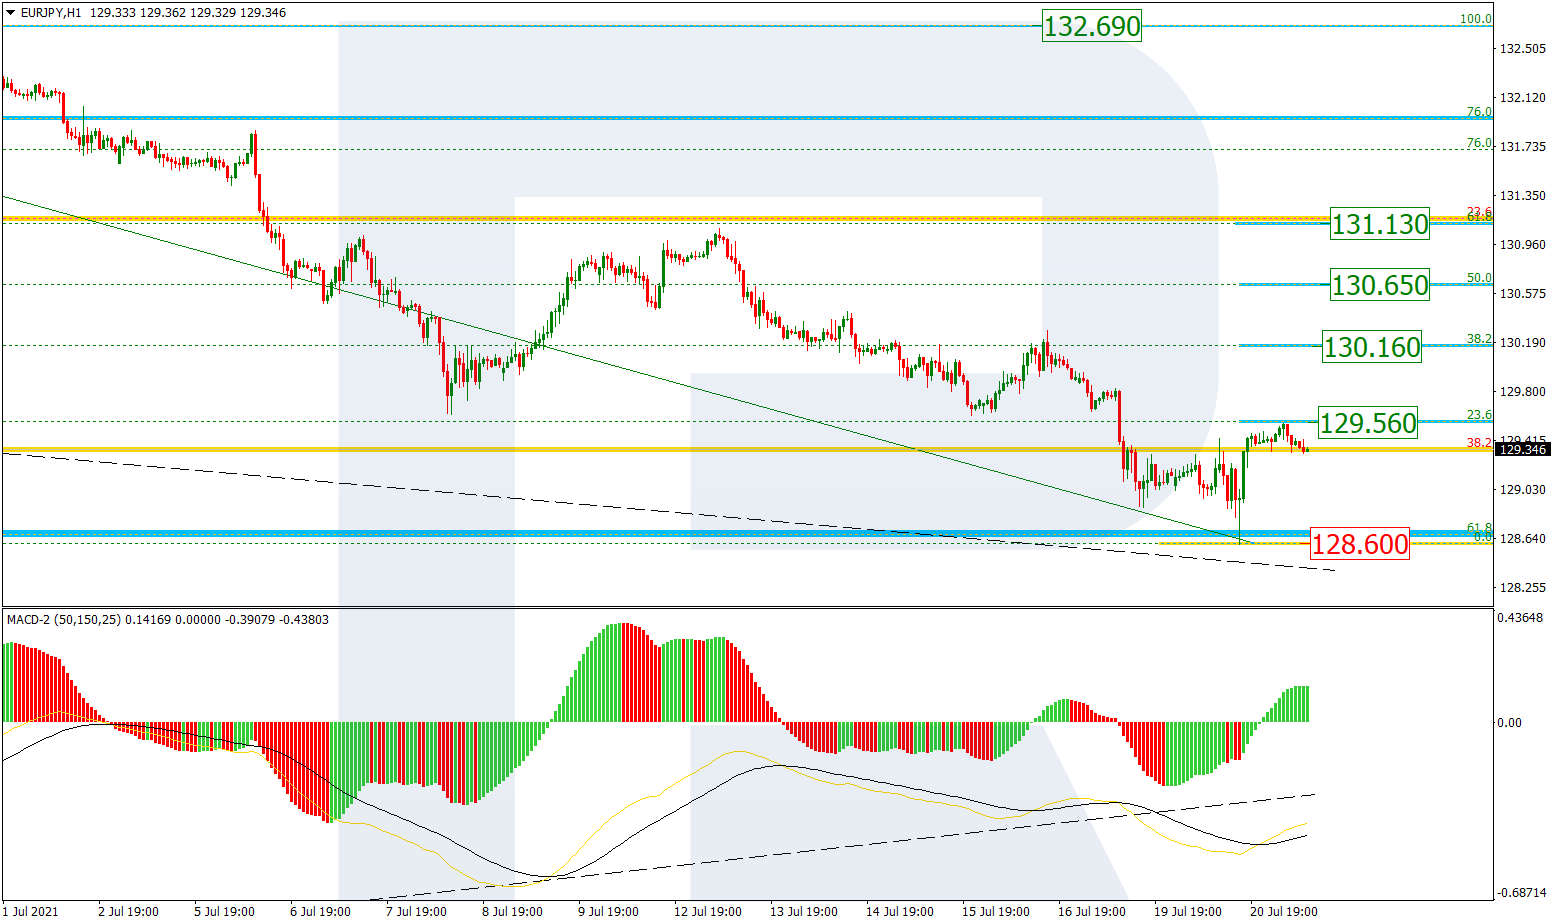
As we can see in the H1 chart, the asset is forming a pullback and testing 23.6% fibo at 129.56. The next rising wave may reach 38.2%, 50.0%, and 61.8% fibo at 130.16, 130.65, and 131.13 respectively. On the other hand, a breakout of the low at 128.60 will lead to a further mid-term downtrend.
Article By RoboForex.com
Attention!
Forecasts presented in this section only reflect the author’s private opinion and should not be considered as guidance for trading. RoboForex LP bears no responsibility for trading results based on trading recommendations described in these analytical reviews.

- COT Metals Charts: Speculator bets led by Copper & Silver Apr 20, 2024
- COT Bonds Charts: Speculator bets led by 10-Year Bonds & Fed Funds Apr 20, 2024
- COT Stock Market Charts: Speculator bets led by S&P500-Mini Apr 20, 2024
- COT Soft Commodities Charts: Speculator bets led by Soybean Meal & Lean Hogs Apr 20, 2024
- 3 Signs of Developing U.S. Economic Slowdown Apr 19, 2024
- Israel has retaliated against Iran. Investors run to safe assets Apr 19, 2024
- Gold hits record high amid growing geopolitical tensions Apr 19, 2024
- The US natural gas prices fell to a 2-month low. A drop in the technology sector on Wednesday had a negative impact on the broad market Apr 18, 2024
- Target Thursdays: Cocoa, Bitcoin and USDCHF hit targets! Apr 18, 2024
- British Pound shows signs of recovery amid favourable inflation data Apr 18, 2024