
By CountingPips.com COT Home | Data Tables | Data Downloads | Newsletter
Here are the latest charts and statistics for the Commitment of Traders (COT) data published by the Commodities Futures Trading Commission (CFTC).
The latest COT data is updated through Tuesday July 20 2021 and shows a quick view of how large traders (for-profit speculators and commercial entities) were positioned in the futures markets.
WTI Crude Oil Futures :
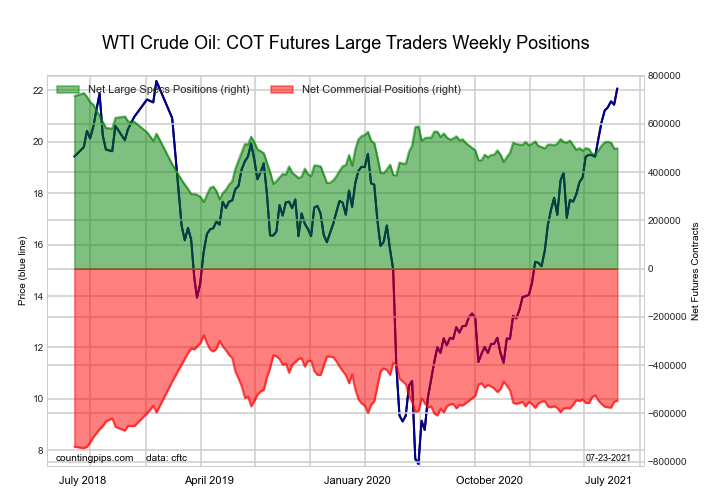 The WTI Crude Oil Futures large speculator standing this week came in at a net position of 448,740 contracts in the data reported through Tuesday. This was a weekly decrease of -50,356 contracts from the previous week which had a total of 499,096 net contracts.
This week’s current strength score (the trader positioning range over the past three years, measured from 0 to 100) shows the speculators are currently Bullish with a score of 51.0 percent. The commercials are Bearish with a score of 40.3 percent and the small traders (not shown in chart) are Bullish-Extreme with a score of 88.0 percent.
| WTI Crude Oil Futures Statistics | SPECULATORS | COMMERCIALS | SMALL TRADERS |
| – Percent of Open Interest Longs: | 26.4 | 33.3 | 4.6 |
| – Percent of Open Interest Shorts: | 6.4 | 55.6 | 2.3 |
| – Net Position: | 448,740 | -500,536 | 51,796 |
| – Gross Longs: | 593,046 | 747,511 | 102,949 |
| – Gross Shorts: | 144,306 | 1,248,047 | 51,153 |
| – Long to Short Ratio: | 4.1 to 1 | 0.6 to 1 | 2.0 to 1 |
| NET POSITION TREND: | |||
| – COT Index Score (3 Year Range Pct): | 51.0 | 40.3 | 88.0 |
| – COT Index Reading (3 Year Range): | Bullish | Bearish | Bullish-Extreme |
| NET POSITION MOVEMENT INDEX: | |||
| – 6-Week Change in Strength Index: | -18.4 | 16.0 | 1.9 |
Free Reports:
 Get our Weekly Commitment of Traders Reports - See where the biggest traders (Hedge Funds and Commercial Hedgers) are positioned in the futures markets on a weekly basis.
 Sign Up for Our Stock Market Newsletter – Get updated on News, Charts & Rankings of Public Companies when you join our Stocks Newsletter
Brent Crude Oil Futures :
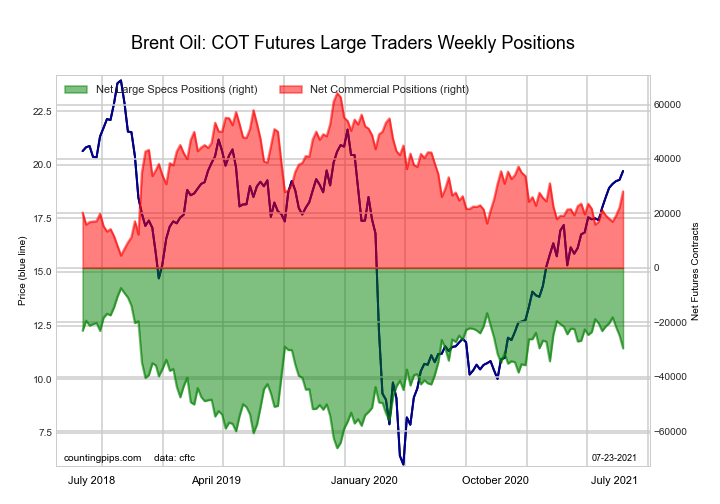 The Brent Crude Oil Futures large speculator standing this week came in at a net position of -26,027 contracts in the data reported through Tuesday. This was a weekly gain of 3,520 contracts from the previous week which had a total of -29,547 net contracts.
This week’s current strength score (the trader positioning range over the past three years, measured from 0 to 100) shows the speculators are currently Bullish with a score of 68.3 percent. The commercials are Bearish with a score of 35.2 percent and the small traders (not shown in chart) are Bearish with a score of 40.0 percent.
| Brent Crude Oil Futures Statistics | SPECULATORS | COMMERCIALS | SMALL TRADERS |
| – Percent of Open Interest Longs: | 17.6 | 54.2 | 3.3 |
| – Percent of Open Interest Shorts: | 30.4 | 41.6 | 3.1 |
| – Net Position: | -26,027 | 25,504 | 523 |
| – Gross Longs: | 35,587 | 109,840 | 6,725 |
| – Gross Shorts: | 61,614 | 84,336 | 6,202 |
| – Long to Short Ratio: | 0.6 to 1 | 1.3 to 1 | 1.1 to 1 |
| NET POSITION TREND: | |||
| – COT Index Score (3 Year Range Pct): | 68.3 | 35.2 | 40.0 |
| – COT Index Reading (3 Year Range): | Bullish | Bearish | Bearish |
| NET POSITION MOVEMENT INDEX: | |||
| – 6-Week Change in Strength Index: | -7.7 | 10.4 | -14.8 |
Natural Gas Futures :
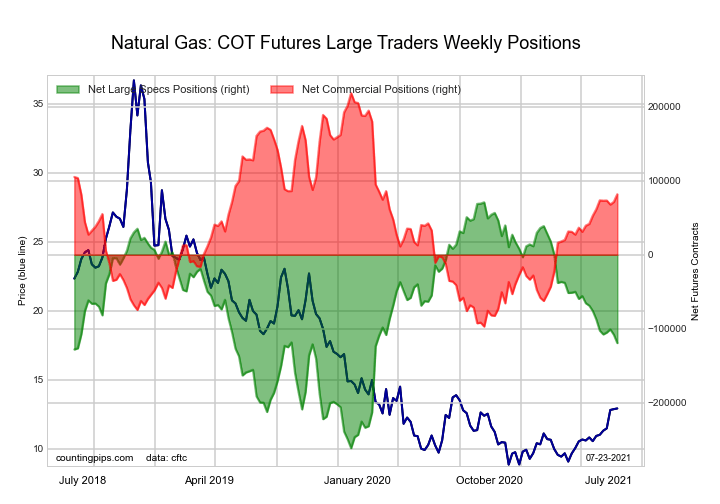 The Natural Gas Futures large speculator standing this week came in at a net position of -127,542 contracts in the data reported through Tuesday. This was a weekly fall of -8,138 contracts from the previous week which had a total of -119,404 net contracts.
This week’s current strength score (the trader positioning range over the past three years, measured from 0 to 100) shows the speculators are currently Bearish with a score of 40.3 percent. The commercials are Bullish with a score of 59.7 percent and the small traders (not shown in chart) are Bullish with a score of 62.7 percent.
| Natural Gas Futures Statistics | SPECULATORS | COMMERCIALS | SMALL TRADERS |
| – Percent of Open Interest Longs: | 24.5 | 40.6 | 4.4 |
| – Percent of Open Interest Shorts: | 33.3 | 34.2 | 1.9 |
| – Net Position: | -127,542 | 91,453 | 36,089 |
| – Gross Longs: | 354,142 | 587,351 | 63,222 |
| – Gross Shorts: | 481,684 | 495,898 | 27,133 |
| – Long to Short Ratio: | 0.7 to 1 | 1.2 to 1 | 2.3 to 1 |
| NET POSITION TREND: | |||
| – COT Index Score (3 Year Range Pct): | 40.3 | 59.7 | 62.7 |
| – COT Index Reading (3 Year Range): | Bearish | Bullish | Bullish |
| NET POSITION MOVEMENT INDEX: | |||
| – 6-Week Change in Strength Index: | -7.5 | 5.7 | 22.9 |
Gasoline Blendstock Futures :
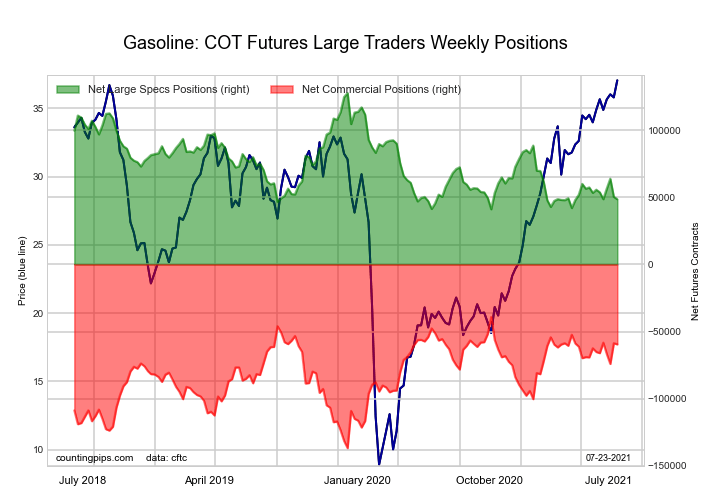 The Gasoline Blendstock Futures large speculator standing this week came in at a net position of 29,337 contracts in the data reported through Tuesday. This was a weekly fall of -19,233 contracts from the previous week which had a total of 48,570 net contracts.
This week’s current strength score (the trader positioning range over the past three years, measured from 0 to 100) shows the speculators are currently Bearish-Extreme with a score of 0.0 percent. The commercials are Bullish-Extreme with a score of 100.0 percent and the small traders (not shown in chart) are Bullish with a score of 57.6 percent.
| Nasdaq Mini Futures Statistics | SPECULATORS | COMMERCIALS | SMALL TRADERS |
| – Percent of Open Interest Longs: | 20.6 | 51.9 | 6.3 |
| – Percent of Open Interest Shorts: | 12.8 | 61.8 | 4.2 |
| – Net Position: | 29,337 | -37,040 | 7,703 |
| – Gross Longs: | 76,719 | 192,737 | 23,331 |
| – Gross Shorts: | 47,382 | 229,777 | 15,628 |
| – Long to Short Ratio: | 1.6 to 1 | 0.8 to 1 | 1.5 to 1 |
| NET POSITION TREND: | |||
| – COT Index Score (3 Year Range Pct): | 0.0 | 100.0 | 57.6 |
| – COT Index Reading (3 Year Range): | Bearish-Extreme | Bullish-Extreme | Bullish |
| NET POSITION MOVEMENT INDEX: | |||
| – 6-Week Change in Strength Index: | -24.8 | 29.1 | -27.8 |
#2 Heating Oil NY-Harbor Futures :
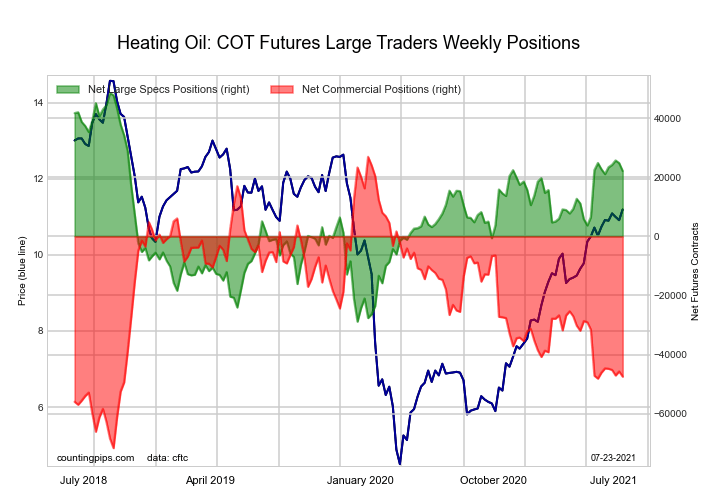 The #2 Heating Oil NY-Harbor Futures large speculator standing this week came in at a net position of 24,249 contracts in the data reported through Tuesday. This was a weekly rise of 2,109 contracts from the previous week which had a total of 22,140 net contracts.
This week’s current strength score (the trader positioning range over the past three years, measured from 0 to 100) shows the speculators are currently Bullish with a score of 68.6 percent. The commercials are Bearish with a score of 30.3 percent and the small traders (not shown in chart) are Bullish with a score of 68.6 percent.
| Heating Oil Futures Statistics | SPECULATORS | COMMERCIALS | SMALL TRADERS |
| – Percent of Open Interest Longs: | 15.4 | 53.1 | 10.4 |
| – Percent of Open Interest Shorts: | 9.6 | 63.0 | 6.2 |
| – Net Position: | 24,249 | -41,789 | 17,540 |
| – Gross Longs: | 64,555 | 221,913 | 43,332 |
| – Gross Shorts: | 40,306 | 263,702 | 25,792 |
| – Long to Short Ratio: | 1.6 to 1 | 0.8 to 1 | 1.7 to 1 |
| NET POSITION TREND: | |||
| – COT Index Score (3 Year Range Pct): | 68.6 | 30.3 | 68.6 |
| – COT Index Reading (3 Year Range): | Bullish | Bearish | Bullish |
| NET POSITION MOVEMENT INDEX: | |||
| – 6-Week Change in Strength Index: | 4.1 | 2.9 | -24.4 |
Bloomberg Commodity Index Futures :
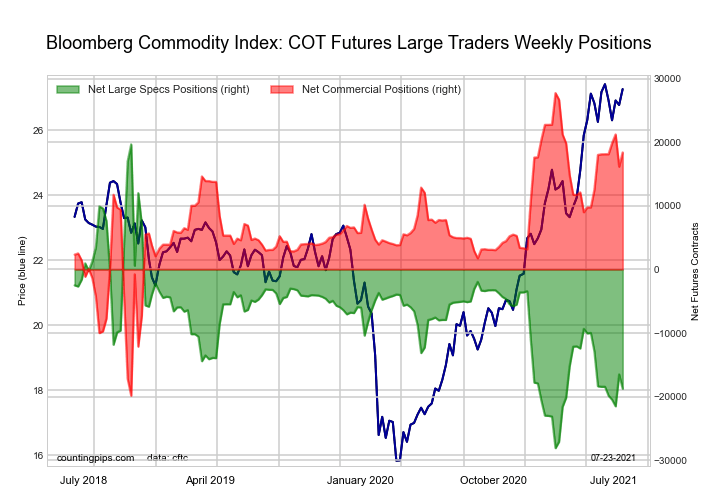 The Bloomberg Commodity Index Futures large speculator standing this week came in at a net position of -8,130 contracts in the data reported through Tuesday. This was a weekly boost of 10,632 contracts from the previous week which had a total of -18,762 net contracts.
This week’s current strength score (the trader positioning range over the past three years, measured from 0 to 100) shows the speculators are currently Bearish with a score of 41.8 percent. The commercials are Bullish with a score of 58.0 percent and the small traders (not shown in chart) are Bearish with a score of 41.5 percent.
| Bloomberg Index Futures Statistics | SPECULATORS | COMMERCIALS | SMALL TRADERS |
| – Percent of Open Interest Longs: | 67.8 | 30.4 | 1.3 |
| – Percent of Open Interest Shorts: | 90.0 | 9.3 | 0.3 |
| – Net Position: | -8,130 | 7,738 | 392 |
| – Gross Longs: | 24,795 | 11,138 | 484 |
| – Gross Shorts: | 32,925 | 3,400 | 92 |
| – Long to Short Ratio: | 0.8 to 1 | 3.3 to 1 | 5.3 to 1 |
| NET POSITION TREND: | |||
| – COT Index Score (3 Year Range Pct): | 41.8 | 58.0 | 41.5 |
| – COT Index Reading (3 Year Range): | Bearish | Bullish | Bearish |
| NET POSITION MOVEMENT INDEX: | |||
| – 6-Week Change in Strength Index: | 21.6 | -21.8 | 3.1 |
Article By CountingPips.com – Receive our weekly COT Reports by Email
*COT Report: The COT data, released weekly to the public each Friday, is updated through the most recent Tuesday (data is 3 days old) and shows a quick view of how large speculators or non-commercials (for-profit traders) were positioned in the futures markets.
The CFTC categorizes trader positions according to commercial hedgers (traders who use futures contracts for hedging as part of the business), non-commercials (large traders who speculate to realize trading profits) and nonreportable traders (usually small traders/speculators).
Find CFTC criteria here: (http://www.cftc.gov/MarketReports/CommitmentsofTraders/ExplanatoryNotes/index.htm).

- TSLA shares rose on a weak report. Inflationary pressures are easing in Australia Apr 24, 2024
- USDJPY: On intervention watch Apr 24, 2024
- Euro gains against the dollar amid mixed economic signals Apr 24, 2024
- PMI data is the focus of investors’ attention today. Turkey, Iraq, Qatar, and UAE signed a transportation agreement Apr 23, 2024
- Australian dollar rises on strong economic indicators Apr 23, 2024
- Geopolitical risks in the Middle East are declining. China kept interest rates at lows Apr 22, 2024
- Brent crude dips to four-week low amid easing geopolitical tensions Apr 22, 2024
- COT Metals Charts: Speculator bets led by Copper & Silver Apr 20, 2024
- COT Bonds Charts: Speculator bets led by 10-Year Bonds & Fed Funds Apr 20, 2024
- COT Stock Market Charts: Speculator bets led by S&P500-Mini Apr 20, 2024