
By CountingPips.com COT Home | Data Tables | Data Downloads | Newsletter
Here are the latest charts and statistics for the Commitment of Traders (COT) data published by the Commodities Futures Trading Commission (CFTC).
The latest COT data is updated through Tuesday July 6th 2021 and shows a quick view of how large traders (for-profit speculators and commercial entities) were positioned in the futures markets.
WTI Crude Oil Futures :
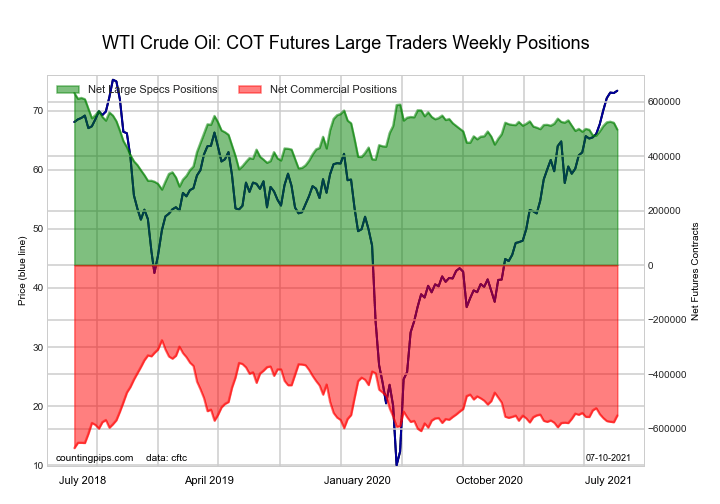 The WTI Crude Oil Futures large speculator standing this week reached a net position of 497,351 contracts in the data reported through Tuesday. This was a weekly decline of -25,139 contracts from the previous week which had a total of 522,490 net contracts.
This week’s current strength score (the trader positioning range over the past three years, measured from 0 to 100) shows the speculators are currently Bullish with a score of 62.2 percent. The commercials are Bearish with a score of 30.3 percent and the small traders (not shown in chart) are Bullish-Extreme with a score of 91.1 percent.
| WTI Crude Oil Futures Statistics | SPECULATORS | COMMERCIALS | SMALL TRADERS |
| – Percent of Open Interest Longs: | 26.5 | 34.1 | 4.6 |
| – Percent of Open Interest Shorts: | 5.9 | 56.9 | 2.4 |
| – Net Position: | 497,351 | -551,362 | 54,011 |
| – Gross Longs: | 640,068 | 822,892 | 110,952 |
| – Gross Shorts: | 142,717 | 1,374,254 | 56,941 |
| – Long to Short Ratio: | 4.5 to 1 | 0.6 to 1 | 1.9 to 1 |
| NET POSITION TREND: | |||
| – COT Index Score (3 Year Range Pct): | 62.2 | 30.3 | 91.1 |
| – COT Index Reading (3 Year Range): | Bullish | Bearish | Bullish-Extreme |
| NET POSITION MOVEMENT INDEX: | |||
| – 6-Week Change in Strength Index: | 6.2 | -6.8 | 7.0 |
Free Reports:
 Download Our Metatrader 4 Indicators – Put Our Free MetaTrader 4 Custom Indicators on your charts when you join our Weekly Newsletter
 Get our Weekly Commitment of Traders Reports - See where the biggest traders (Hedge Funds and Commercial Hedgers) are positioned in the futures markets on a weekly basis.
Brent Crude Oil Futures :
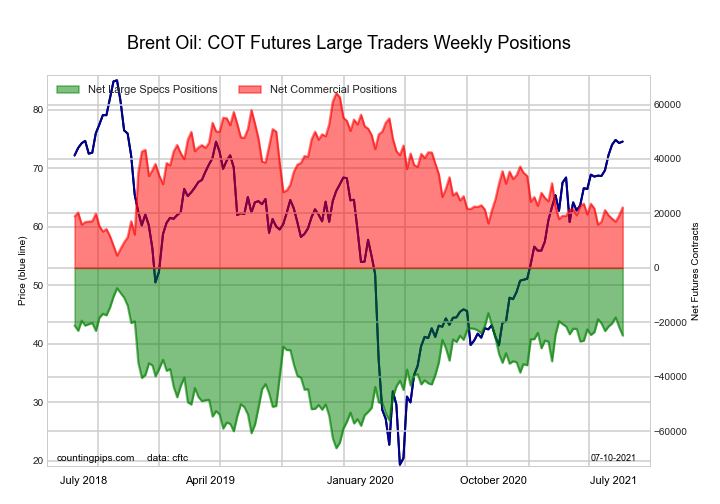 The Brent Crude Oil Futures large speculator standing this week reached a net position of -24,846 contracts in the data reported through Tuesday. This was a weekly fall of -3,101 contracts from the previous week which had a total of -21,745 net contracts.
This week’s current strength score (the trader positioning range over the past three years, measured from 0 to 100) shows the speculators are currently Bullish with a score of 70.4 percent. The commercials are Bearish with a score of 29.7 percent and the small traders (not shown in chart) are Bullish with a score of 58.4 percent.
| Brent Crude Oil Futures Statistics | SPECULATORS | COMMERCIALS | SMALL TRADERS |
| – Percent of Open Interest Longs: | 17.1 | 52.7 | 4.9 |
| – Percent of Open Interest Shorts: | 29.9 | 41.3 | 3.5 |
| – Net Position: | -24,846 | 22,222 | 2,624 |
| – Gross Longs: | 33,083 | 102,271 | 9,427 |
| – Gross Shorts: | 57,929 | 80,049 | 6,803 |
| – Long to Short Ratio: | 0.6 to 1 | 1.3 to 1 | 1.4 to 1 |
| NET POSITION TREND: | |||
| – COT Index Score (3 Year Range Pct): | 70.4 | 29.7 | 58.4 |
| – COT Index Reading (3 Year Range): | Bullish | Bearish | Bullish |
| NET POSITION MOVEMENT INDEX: | |||
| – 6-Week Change in Strength Index: | -7.6 | 8.8 | -6.8 |
Natural Gas Futures :
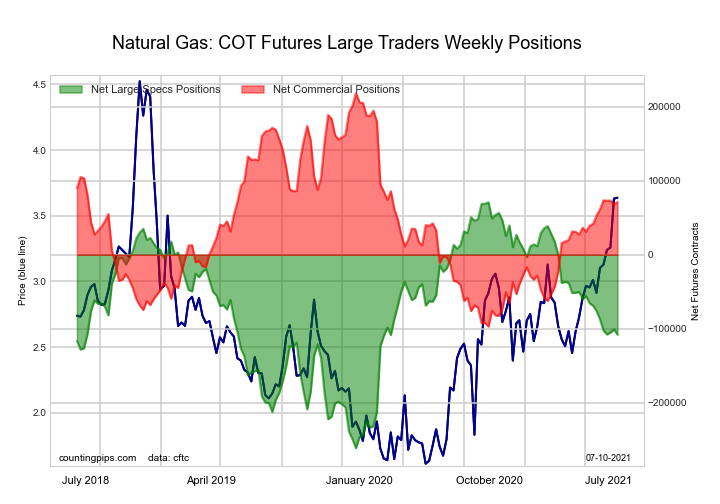 The Natural Gas Futures large speculator standing this week reached a net position of -108,054 contracts in the data reported through Tuesday. This was a weekly fall of -7,207 contracts from the previous week which had a total of -100,847 net contracts.
This week’s current strength score (the trader positioning range over the past three years, measured from 0 to 100) shows the speculators are currently Bearish with a score of 46.2 percent. The commercials are Bullish with a score of 53.4 percent and the small traders (not shown in chart) are Bullish with a score of 64.2 percent.
| Natural Gas Futures Statistics | SPECULATORS | COMMERCIALS | SMALL TRADERS |
| – Percent of Open Interest Longs: | 24.9 | 39.8 | 4.4 |
| – Percent of Open Interest Shorts: | 32.4 | 34.8 | 1.9 |
| – Net Position: | -108,054 | 71,476 | 36,578 |
| – Gross Longs: | 360,454 | 574,894 | 63,570 |
| – Gross Shorts: | 468,508 | 503,418 | 26,992 |
| – Long to Short Ratio: | 0.8 to 1 | 1.1 to 1 | 2.4 to 1 |
| NET POSITION TREND: | |||
| – COT Index Score (3 Year Range Pct): | 46.2 | 53.4 | 64.2 |
| – COT Index Reading (3 Year Range): | Bearish | Bullish | Bullish |
| NET POSITION MOVEMENT INDEX: | |||
| – 6-Week Change in Strength Index: | -9.6 | 5.9 | 43.0 |
Gasoline Blendstock Futures :
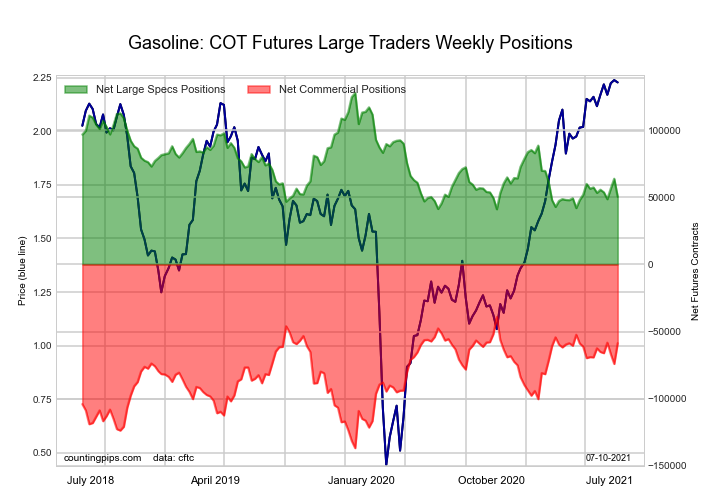 The Gasoline Blendstock Futures large speculator standing this week reached a net position of 50,417 contracts in the data reported through Tuesday. This was a weekly reduction of -13,442 contracts from the previous week which had a total of 63,859 net contracts.
This week’s current strength score (the trader positioning range over the past three years, measured from 0 to 100) shows the speculators are currently Bearish-Extreme with a score of 10.7 percent. The commercials are Bullish-Extreme with a score of 80.1 percent and the small traders (not shown in chart) are Bullish with a score of 61.1 percent.
| Nasdaq Mini Futures Statistics | SPECULATORS | COMMERCIALS | SMALL TRADERS |
| – Percent of Open Interest Longs: | 24.2 | 44.9 | 6.1 |
| – Percent of Open Interest Shorts: | 10.7 | 60.6 | 3.8 |
| – Net Position: | 50,417 | -58,710 | 8,293 |
| – Gross Longs: | 90,182 | 167,149 | 22,562 |
| – Gross Shorts: | 39,765 | 225,859 | 14,269 |
| – Long to Short Ratio: | 2.3 to 1 | 0.7 to 1 | 1.6 to 1 |
| NET POSITION TREND: | |||
| – COT Index Score (3 Year Range Pct): | 10.7 | 80.1 | 61.1 |
| – COT Index Reading (3 Year Range): | Bearish-Extreme | Bullish-Extreme | Bullish |
| NET POSITION MOVEMENT INDEX: | |||
| – 6-Week Change in Strength Index: | -3.4 | 3.9 | -5.0 |
#2 Heating Oil NY-Harbor Futures :
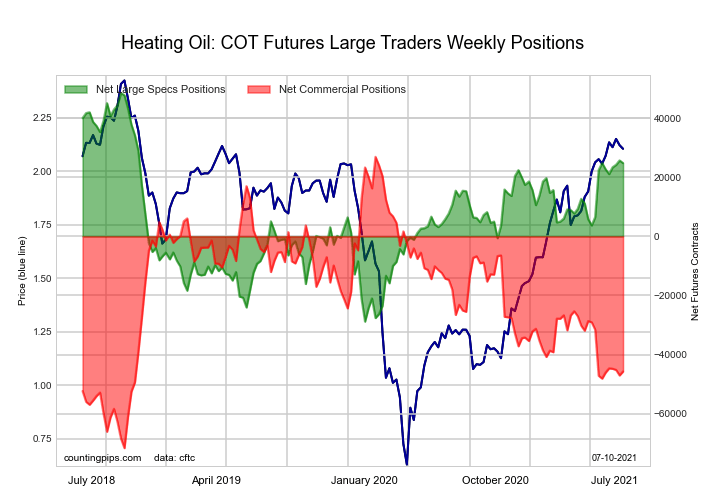 The #2 Heating Oil NY-Harbor Futures large speculator standing this week reached a net position of 24,821 contracts in the data reported through Tuesday. This was a weekly decrease of -876 contracts from the previous week which had a total of 25,697 net contracts.
This week’s current strength score (the trader positioning range over the past three years, measured from 0 to 100) shows the speculators are currently Bullish with a score of 69.4 percent. The commercials are Bearish with a score of 26.3 percent and the small traders (not shown in chart) are Bullish-Extreme with a score of 82.1 percent.
| Heating Oil Futures Statistics | SPECULATORS | COMMERCIALS | SMALL TRADERS |
| – Percent of Open Interest Longs: | 16.1 | 49.6 | 11.0 |
| – Percent of Open Interest Shorts: | 10.0 | 60.7 | 5.9 |
| – Net Position: | 24,821 | -45,718 | 20,897 |
| – Gross Longs: | 66,038 | 203,312 | 45,136 |
| – Gross Shorts: | 41,217 | 249,030 | 24,239 |
| – Long to Short Ratio: | 1.6 to 1 | 0.8 to 1 | 1.9 to 1 |
| NET POSITION TREND: | |||
| – COT Index Score (3 Year Range Pct): | 69.4 | 26.3 | 82.1 |
| – COT Index Reading (3 Year Range): | Bullish | Bearish | Bullish-Extreme |
| NET POSITION MOVEMENT INDEX: | |||
| – 6-Week Change in Strength Index: | -0.0 | 2.5 | -9.7 |
Bloomberg Commodity Index Futures :
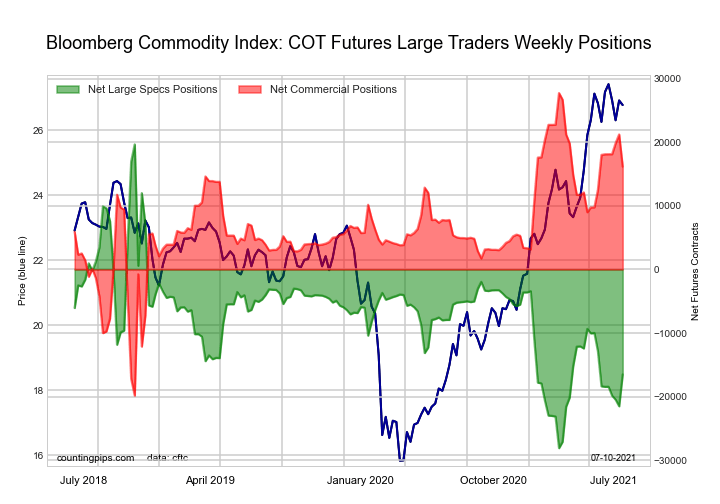 The Bloomberg Commodity Index Futures large speculator standing this week reached a net position of -16,513 contracts in the data reported through Tuesday. This was a weekly advance of 5,008 contracts from the previous week which had a total of -21,521 net contracts.
This week’s current strength score (the trader positioning range over the past three years, measured from 0 to 100) shows the speculators are currently Bearish with a score of 24.3 percent. The commercials are Bullish with a score of 75.7 percent and the small traders (not shown in chart) are Bearish with a score of 39.3 percent.
| Bloomberg Index Futures Statistics | SPECULATORS | COMMERCIALS | SMALL TRADERS |
| – Percent of Open Interest Longs: | 50.4 | 48.2 | 1.1 |
| – Percent of Open Interest Shorts: | 91.1 | 8.4 | 0.3 |
| – Net Position: | -16,513 | 16,170 | 343 |
| – Gross Longs: | 20,459 | 19,570 | 457 |
| – Gross Shorts: | 36,972 | 3,400 | 114 |
| – Long to Short Ratio: | 0.6 to 1 | 5.8 to 1 | 4.0 to 1 |
| NET POSITION TREND: | |||
| – COT Index Score (3 Year Range Pct): | 24.3 | 75.7 | 39.3 |
| – COT Index Reading (3 Year Range): | Bearish | Bullish | Bearish |
| NET POSITION MOVEMENT INDEX: | |||
| – 6-Week Change in Strength Index: | 3.9 | -3.9 | -0.9 |
Article By CountingPips.com – Receive our weekly COT Reports by Email
*COT Report: The COT data, released weekly to the public each Friday, is updated through the most recent Tuesday (data is 3 days old) and shows a quick view of how large speculators or non-commercials (for-profit traders) were positioned in the futures markets.
The CFTC categorizes trader positions according to commercial hedgers (traders who use futures contracts for hedging as part of the business), non-commercials (large traders who speculate to realize trading profits) and nonreportable traders (usually small traders/speculators).
Find CFTC criteria here: (http://www.cftc.gov/MarketReports/CommitmentsofTraders/ExplanatoryNotes/index.htm).

- 3 Signs of Developing U.S. Economic Slowdown Apr 19, 2024
- Israel has retaliated against Iran. Investors run to safe assets Apr 19, 2024
- Gold hits record high amid growing geopolitical tensions Apr 19, 2024
- The US natural gas prices fell to a 2-month low. A drop in the technology sector on Wednesday had a negative impact on the broad market Apr 18, 2024
- Target Thursdays: Cocoa, Bitcoin and USDCHF hit targets! Apr 18, 2024
- British Pound shows signs of recovery amid favourable inflation data Apr 18, 2024
- Indices decline amid hawkish comments from the Fed. Investors are waiting for Israel’s answer Apr 17, 2024
- EURGBP: Slams into support on hot UK inflation Apr 17, 2024
- Brent crude prices dip amid concerns over global demand Apr 17, 2024
- Stock indices sell-off amid rising geopolitical tensions in the Middle East. China’s GDP grew the most in a year Apr 16, 2024