
By CountingPips.com COT Home | Data Tables | Data Downloads | Newsletter
Here are the latest charts and statistics for the Commitment of Traders (COT) data published by the Commodities Futures Trading Commission (CFTC).
The latest COT data is updated through Tuesday July 27 2021 and shows a quick view of how large traders (for-profit speculators and commercial entities) were positioned in the futures markets.
WTI Crude Oil Futures :
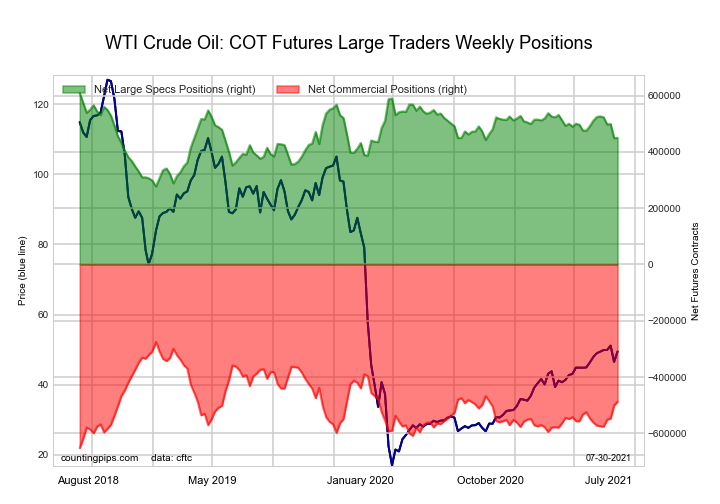 The WTI Crude Oil Futures large speculator standing this week recorded a net position of 449,764 contracts in the data reported through Tuesday. This was a weekly gain of 1,024 contracts from the previous week which had a total of 448,740 net contracts.
This week’s current strength score (the trader positioning range over the past three years, measured from 0 to 100) shows the speculators are currently Bullish with a score of 52.0 percent. The commercials are Bearish with a score of 43.6 percent and the small traders (not shown in chart) are Bullish with a score of 68.7 percent.
| WTI Crude Oil Futures Statistics | SPECULATORS | COMMERCIALS | SMALL TRADERS |
| – Percent of Open Interest Longs: | 25.8 | 35.6 | 3.9 |
| – Percent of Open Interest Shorts: | 6.5 | 56.5 | 2.3 |
| – Net Position: | 449,764 | -487,889 | 38,125 |
| – Gross Longs: | 601,411 | 827,518 | 91,243 |
| – Gross Shorts: | 151,647 | 1,315,407 | 53,118 |
| – Long to Short Ratio: | 4.0 to 1 | 0.6 to 1 | 1.7 to 1 |
| NET POSITION TREND: | |||
| – COT Index Score (3 Year Range Pct): | 52.0 | 43.6 | 68.7 |
| – COT Index Reading (3 Year Range): | Bullish | Bearish | Bullish |
| NET POSITION MOVEMENT INDEX: | |||
| – 6-Week Change in Strength Index: | -22.4 | 22.3 | -13.8 |
Free Reports:
 Sign Up for Our Stock Market Newsletter – Get updated on News, Charts & Rankings of Public Companies when you join our Stocks Newsletter
 Get our Weekly Commitment of Traders Reports - See where the biggest traders (Hedge Funds and Commercial Hedgers) are positioned in the futures markets on a weekly basis.
Brent Crude Oil Futures :
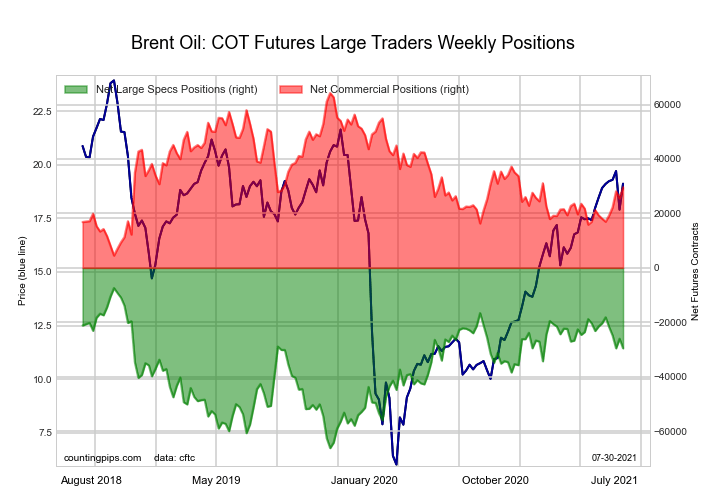 The Brent Crude Oil Futures large speculator standing this week recorded a net position of -29,547 contracts in the data reported through Tuesday. This was a weekly decline of -3,520 contracts from the previous week which had a total of -26,027 net contracts.
This week’s current strength score (the trader positioning range over the past three years, measured from 0 to 100) shows the speculators are currently Bullish with a score of 62.4 percent. The commercials are Bearish with a score of 42.0 percent and the small traders (not shown in chart) are Bearish with a score of 34.9 percent.
| Brent Crude Oil Futures Statistics | SPECULATORS | COMMERCIALS | SMALL TRADERS |
| – Percent of Open Interest Longs: | 16.8 | 53.7 | 3.1 |
| – Percent of Open Interest Shorts: | 31.4 | 39.0 | 3.1 |
| – Net Position: | -29,547 | 29,604 | -57 |
| – Gross Longs: | 33,832 | 108,260 | 6,157 |
| – Gross Shorts: | 63,379 | 78,656 | 6,214 |
| – Long to Short Ratio: | 0.5 to 1 | 1.4 to 1 | 1.0 to 1 |
| NET POSITION TREND: | |||
| – COT Index Score (3 Year Range Pct): | 62.4 | 42.0 | 34.9 |
| – COT Index Reading (3 Year Range): | Bullish | Bearish | Bearish |
| NET POSITION MOVEMENT INDEX: | |||
| – 6-Week Change in Strength Index: | -15.6 | 19.3 | -20.5 |
Natural Gas Futures :
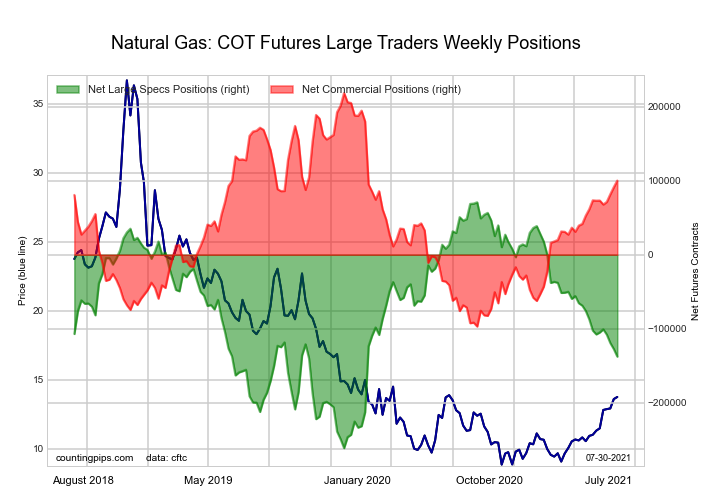 The Natural Gas Futures large speculator standing this week recorded a net position of -137,758 contracts in the data reported through Tuesday. This was a weekly decline of -10,216 contracts from the previous week which had a total of -127,542 net contracts.
This week’s current strength score (the trader positioning range over the past three years, measured from 0 to 100) shows the speculators are currently Bearish with a score of 37.2 percent. The commercials are Bullish with a score of 62.5 percent and the small traders (not shown in chart) are Bullish with a score of 67.0 percent.
| Natural Gas Futures Statistics | SPECULATORS | COMMERCIALS | SMALL TRADERS |
| – Percent of Open Interest Longs: | 24.2 | 41.1 | 4.3 |
| – Percent of Open Interest Shorts: | 33.8 | 34.1 | 1.7 |
| – Net Position: | -137,758 | 100,303 | 37,455 |
| – Gross Longs: | 347,610 | 590,146 | 62,370 |
| – Gross Shorts: | 485,368 | 489,843 | 24,915 |
| – Long to Short Ratio: | 0.7 to 1 | 1.2 to 1 | 2.5 to 1 |
| NET POSITION TREND: | |||
| – COT Index Score (3 Year Range Pct): | 37.2 | 62.5 | 67.0 |
| – COT Index Reading (3 Year Range): | Bearish | Bullish | Bullish |
| NET POSITION MOVEMENT INDEX: | |||
| – 6-Week Change in Strength Index: | -9.0 | 8.6 | 9.3 |
Gasoline Blendstock Futures :
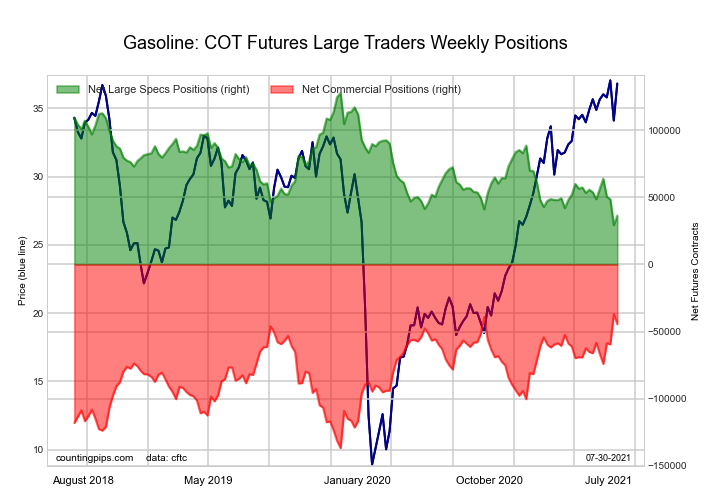 The Gasoline Blendstock Futures large speculator standing this week recorded a net position of 36,351 contracts in the data reported through Tuesday. This was a weekly rise of 7,014 contracts from the previous week which had a total of 29,337 net contracts.
This week’s current strength score (the trader positioning range over the past three years, measured from 0 to 100) shows the speculators are currently Bearish-Extreme with a score of 7.1 percent. The commercials are Bullish-Extreme with a score of 92.5 percent and the small traders (not shown in chart) are Bullish with a score of 60.2 percent.
| Nasdaq Mini Futures Statistics | SPECULATORS | COMMERCIALS | SMALL TRADERS |
| – Percent of Open Interest Longs: | 25.1 | 48.7 | 6.4 |
| – Percent of Open Interest Shorts: | 14.7 | 61.5 | 4.0 |
| – Net Position: | 36,351 | -44,496 | 8,145 |
| – Gross Longs: | 87,397 | 169,307 | 22,193 |
| – Gross Shorts: | 51,046 | 213,803 | 14,048 |
| – Long to Short Ratio: | 1.7 to 1 | 0.8 to 1 | 1.6 to 1 |
| NET POSITION TREND: | |||
| – COT Index Score (3 Year Range Pct): | 7.1 | 92.5 | 60.2 |
| – COT Index Reading (3 Year Range): | Bearish-Extreme | Bullish-Extreme | Bullish |
| NET POSITION MOVEMENT INDEX: | |||
| – 6-Week Change in Strength Index: | -12.5 | 13.8 | -9.1 |
#2 Heating Oil NY-Harbor Futures :
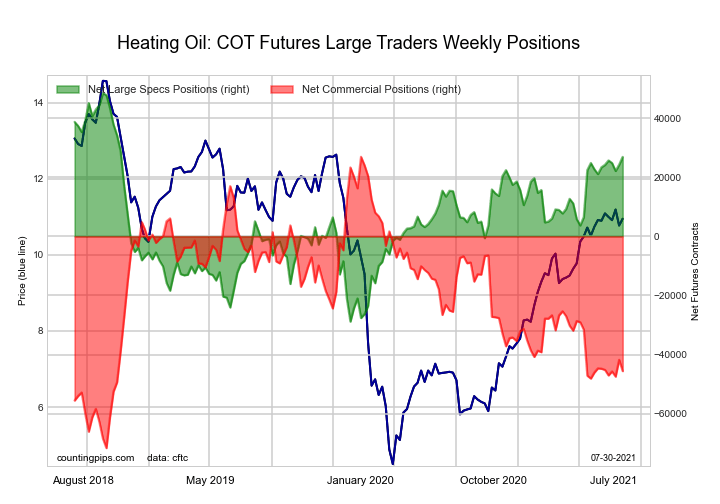 The #2 Heating Oil NY-Harbor Futures large speculator standing this week recorded a net position of 26,895 contracts in the data reported through Tuesday. This was a weekly gain of 2,646 contracts from the previous week which had a total of 24,249 net contracts.
This week’s current strength score (the trader positioning range over the past three years, measured from 0 to 100) shows the speculators are currently Bullish with a score of 72.1 percent. The commercials are Bearish with a score of 26.4 percent and the small traders (not shown in chart) are Bullish with a score of 73.3 percent.
| Heating Oil Futures Statistics | SPECULATORS | COMMERCIALS | SMALL TRADERS |
| – Percent of Open Interest Longs: | 17.5 | 50.1 | 10.8 |
| – Percent of Open Interest Shorts: | 10.8 | 61.4 | 6.1 |
| – Net Position: | 26,895 | -45,608 | 18,713 |
| – Gross Longs: | 70,760 | 202,895 | 43,552 |
| – Gross Shorts: | 43,865 | 248,503 | 24,839 |
| – Long to Short Ratio: | 1.6 to 1 | 0.8 to 1 | 1.8 to 1 |
| NET POSITION TREND: | |||
| – COT Index Score (3 Year Range Pct): | 72.1 | 26.4 | 73.3 |
| – COT Index Reading (3 Year Range): | Bullish | Bearish | Bullish |
| NET POSITION MOVEMENT INDEX: | |||
| – 6-Week Change in Strength Index: | 4.5 | -0.8 | -10.8 |
Bloomberg Commodity Index Futures :
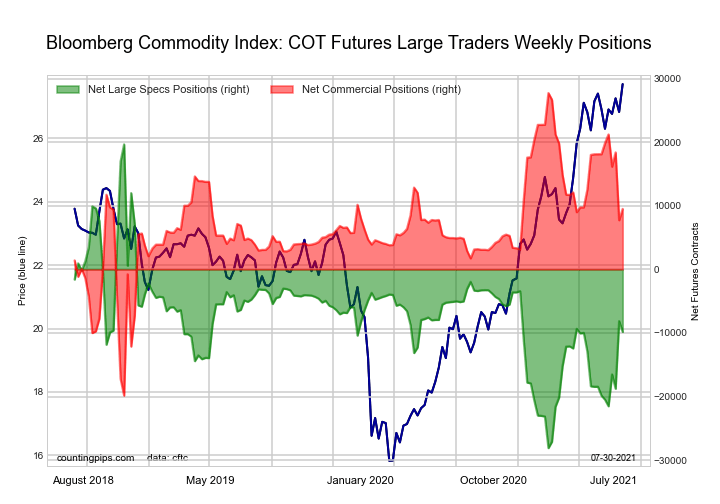 The Bloomberg Commodity Index Futures large speculator standing this week recorded a net position of -9,827 contracts in the data reported through Tuesday. This was a weekly reduction of -1,697 contracts from the previous week which had a total of -8,130 net contracts.
This week’s current strength score (the trader positioning range over the past three years, measured from 0 to 100) shows the speculators are currently Bearish with a score of 38.3 percent. The commercials are Bullish with a score of 61.7 percent and the small traders (not shown in chart) are Bearish with a score of 37.9 percent.
| Bloomberg Index Futures Statistics | SPECULATORS | COMMERCIALS | SMALL TRADERS |
| – Percent of Open Interest Longs: | 63.4 | 35.0 | 1.1 |
| – Percent of Open Interest Shorts: | 90.0 | 9.2 | 0.3 |
| – Net Position: | -9,827 | 9,516 | 311 |
| – Gross Longs: | 23,399 | 12,916 | 418 |
| – Gross Shorts: | 33,226 | 3,400 | 107 |
| – Long to Short Ratio: | 0.7 to 1 | 3.8 to 1 | 3.9 to 1 |
| NET POSITION TREND: | |||
| – COT Index Score (3 Year Range Pct): | 38.3 | 61.7 | 37.9 |
| – COT Index Reading (3 Year Range): | Bearish | Bullish | Bearish |
| NET POSITION MOVEMENT INDEX: | |||
| – 6-Week Change in Strength Index: | 21.0 | -18.1 | -62.1 |
Article By CountingPips.com – Receive our weekly COT Reports by Email
*COT Report: The COT data, released weekly to the public each Friday, is updated through the most recent Tuesday (data is 3 days old) and shows a quick view of how large speculators or non-commercials (for-profit traders) were positioned in the futures markets.
The CFTC categorizes trader positions according to commercial hedgers (traders who use futures contracts for hedging as part of the business), non-commercials (large traders who speculate to realize trading profits) and nonreportable traders (usually small traders/speculators).
Find CFTC criteria here: (http://www.cftc.gov/MarketReports/CommitmentsofTraders/ExplanatoryNotes/index.htm).

- The US natural gas prices fell to a 2-month low. A drop in the technology sector on Wednesday had a negative impact on the broad market Apr 18, 2024
- Target Thursdays: Cocoa, Bitcoin and USDCHF hit targets! Apr 18, 2024
- British Pound shows signs of recovery amid favourable inflation data Apr 18, 2024
- Indices decline amid hawkish comments from the Fed. Investors are waiting for Israel’s answer Apr 17, 2024
- EURGBP: Slams into support on hot UK inflation Apr 17, 2024
- Brent crude prices dip amid concerns over global demand Apr 17, 2024
- Stock indices sell-off amid rising geopolitical tensions in the Middle East. China’s GDP grew the most in a year Apr 16, 2024
- New FXTM commodity hits all-time high! Apr 16, 2024
- NZD hits five-month low against strong US dollar Apr 16, 2024
- Escalating conflict in the Middle East is forcing investors to shift funds to safe assets Apr 15, 2024