
By CountingPips.com COT Home | Data Tables | Data Downloads | Newsletter
Here are the latest charts and statistics for the Commitment of Traders (COT) data published by the Commodities Futures Trading Commission (CFTC).
The latest COT data is updated through Tuesday July 6th 2021 and shows a quick view of how large traders (for-profit speculators and commercial entities) were positioned in the futures markets.
3-Month Eurodollars Futures:
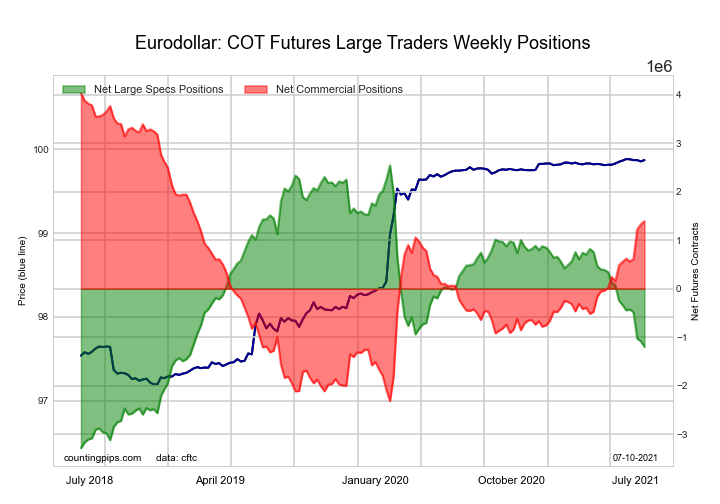 The 3-Month Eurodollars large speculator standing this week came in at a net position of -1,197,398 contracts in the data reported through Tuesday. This was a weekly reduction of -116,804 contracts from the previous week which had a total of -1,080,594 net contracts.
This week’s current strength score (the trader positioning range over the past three years, measured from 0 to 100) shows the speculators are currently Bearish with a score of 35.9 percent. The commercials are Bullish with a score of 58.4 percent and the small traders (not shown in chart) are Bullish with a score of 77.7 percent.
| 3-Month Eurodollars Statistics | SPECULATORS | COMMERCIALS | SMALL TRADERS |
| – Percent of Open Interest Longs: | 13.3 | 61.0 | 5.0 |
| – Percent of Open Interest Shorts: | 23.0 | 49.7 | 6.6 |
| – Net Position: | -1,197,398 | 1,390,291 | -192,893 |
| – Gross Longs: | 1,639,947 | 7,524,901 | 617,224 |
| – Gross Shorts: | 2,837,345 | 6,134,610 | 810,117 |
| – Long to Short Ratio: | 0.6 to 1 | 1.2 to 1 | 0.8 to 1 |
| NET POSITION TREND: | |||
| – COT Index Score (3 Year Range Pct): | 35.9 | 58.4 | 77.7 |
| – COT Index Reading (3 Year Range): | Bearish | Bullish | Bullish |
| NET POSITION MOVEMENT INDEX: | |||
| – 6-Week Change in Strength Index: | -14.8 | 13.1 | 3.3 |
Free Reports:
 Sign Up for Our Stock Market Newsletter – Get updated on News, Charts & Rankings of Public Companies when you join our Stocks Newsletter
 Get our Weekly Commitment of Traders Reports - See where the biggest traders (Hedge Funds and Commercial Hedgers) are positioned in the futures markets on a weekly basis.
30-Day Federal Funds Futures:
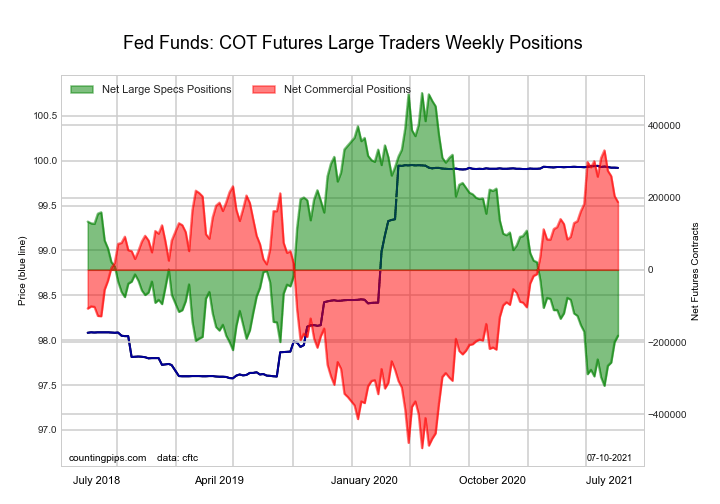 The 30-Day Federal Funds large speculator standing this week came in at a net position of -182,471 contracts in the data reported through Tuesday. This was a weekly lift of 17,559 contracts from the previous week which had a total of -200,030 net contracts.
This week’s current strength score (the trader positioning range over the past three years, measured from 0 to 100) shows the speculators are currently Bearish-Extreme with a score of 17.1 percent. The commercials are Bullish-Extreme with a score of 82.6 percent and the small traders (not shown in chart) are Bullish with a score of 62.0 percent.
| 30-Day Federal Funds Statistics | SPECULATORS | COMMERCIALS | SMALL TRADERS |
| – Percent of Open Interest Longs: | 4.4 | 74.8 | 3.0 |
| – Percent of Open Interest Shorts: | 22.3 | 56.4 | 3.5 |
| – Net Position: | -182,471 | 187,461 | -4,990 |
| – Gross Longs: | 45,200 | 762,577 | 30,387 |
| – Gross Shorts: | 227,671 | 575,116 | 35,377 |
| – Long to Short Ratio: | 0.2 to 1 | 1.3 to 1 | 0.9 to 1 |
| NET POSITION TREND: | |||
| – COT Index Score (3 Year Range Pct): | 17.1 | 82.6 | 62.0 |
| – COT Index Reading (3 Year Range): | Bearish-Extreme | Bullish-Extreme | Bullish |
| NET POSITION MOVEMENT INDEX: | |||
| – 6-Week Change in Strength Index: | 8.1 | -8.5 | 8.8 |
2-Year Treasury Note Futures:
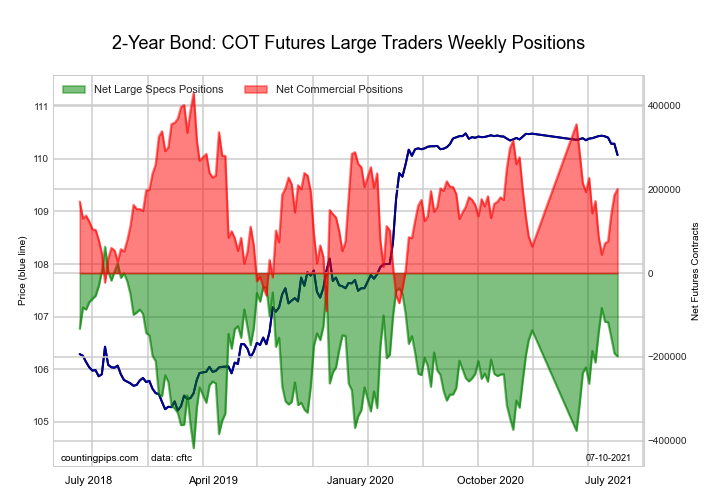 The 2-Year Treasury Note large speculator standing this week came in at a net position of -198,362 contracts in the data reported through Tuesday. This was a weekly fall of -7,106 contracts from the previous week which had a total of -191,256 net contracts.
This week’s current strength score (the trader positioning range over the past three years, measured from 0 to 100) shows the speculators are currently Bullish with a score of 55.0 percent. The commercials are Bullish with a score of 56.0 percent and the small traders (not shown in chart) are Bearish with a score of 33.6 percent.
| 2-Year Treasury Note Statistics | SPECULATORS | COMMERCIALS | SMALL TRADERS |
| – Percent of Open Interest Longs: | 17.7 | 72.9 | 6.8 |
| – Percent of Open Interest Shorts: | 27.2 | 63.3 | 6.9 |
| – Net Position: | -198,362 | 200,657 | -2,295 |
| – Gross Longs: | 367,372 | 1,516,655 | 140,979 |
| – Gross Shorts: | 565,734 | 1,315,998 | 143,274 |
| – Long to Short Ratio: | 0.6 to 1 | 1.2 to 1 | 1.0 to 1 |
| NET POSITION TREND: | |||
| – COT Index Score (3 Year Range Pct): | 55.0 | 56.0 | 33.6 |
| – COT Index Reading (3 Year Range): | Bullish | Bullish | Bearish |
| NET POSITION MOVEMENT INDEX: | |||
| – 6-Week Change in Strength Index: | -14.2 | 21.8 | -29.9 |
5-Year Treasury Note Futures:
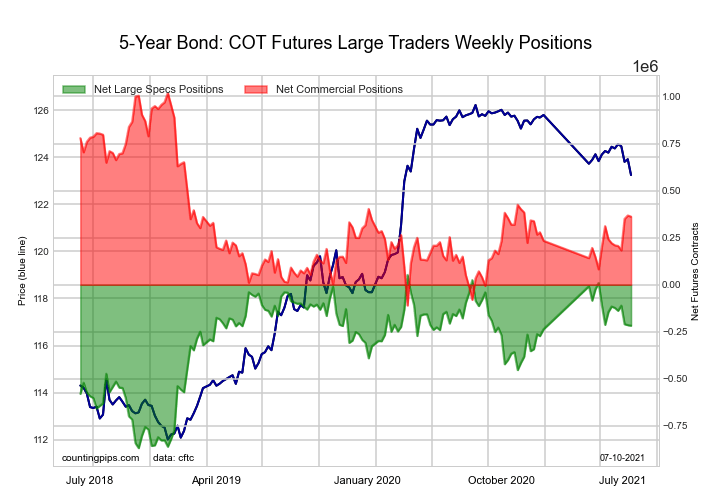 The 5-Year Treasury Note large speculator standing this week came in at a net position of -217,303 contracts in the data reported through Tuesday. This was a weekly fall of -2,948 contracts from the previous week which had a total of -214,355 net contracts.
This week’s current strength score (the trader positioning range over the past three years, measured from 0 to 100) shows the speculators are currently Bullish with a score of 67.5 percent. The commercials are Bearish with a score of 41.8 percent and the small traders (not shown in chart) are Bearish-Extreme with a score of 6.0 percent.
| 5-Year Treasury Note Statistics | SPECULATORS | COMMERCIALS | SMALL TRADERS |
| – Percent of Open Interest Longs: | 10.7 | 79.8 | 8.1 |
| – Percent of Open Interest Shorts: | 17.0 | 69.4 | 12.2 |
| – Net Position: | -217,303 | 361,799 | -144,496 |
| – Gross Longs: | 374,520 | 2,782,568 | 282,444 |
| – Gross Shorts: | 591,823 | 2,420,769 | 426,940 |
| – Long to Short Ratio: | 0.6 to 1 | 1.1 to 1 | 0.7 to 1 |
| NET POSITION TREND: | |||
| – COT Index Score (3 Year Range Pct): | 67.5 | 41.8 | 6.0 |
| – COT Index Reading (3 Year Range): | Bullish | Bearish | Bearish-Extreme |
| NET POSITION MOVEMENT INDEX: | |||
| – 6-Week Change in Strength Index: | -10.5 | 12.5 | -17.3 |
10-Year Treasury Note Futures:
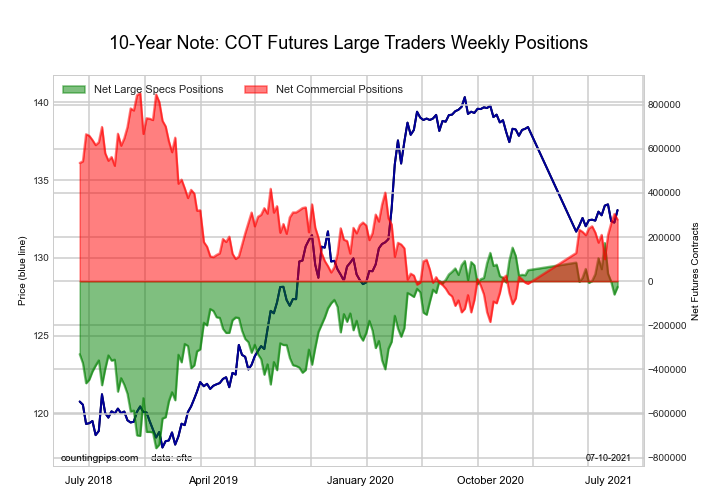 The 10-Year Treasury Note large speculator standing this week came in at a net position of -25,593 contracts in the data reported through Tuesday. This was a weekly boost of 34,367 contracts from the previous week which had a total of -59,960 net contracts.
This week’s current strength score (the trader positioning range over the past three years, measured from 0 to 100) shows the speculators are currently Bullish with a score of 78.6 percent. The commercials are Bearish with a score of 44.7 percent and the small traders (not shown in chart) are Bearish-Extreme with a score of 6.9 percent.
| 10-Year Treasury Note Statistics | SPECULATORS | COMMERCIALS | SMALL TRADERS |
| – Percent of Open Interest Longs: | 21.9 | 68.4 | 7.9 |
| – Percent of Open Interest Shorts: | 22.5 | 61.9 | 13.8 |
| – Net Position: | -25,593 | 279,342 | -253,749 |
| – Gross Longs: | 937,436 | 2,921,071 | 337,117 |
| – Gross Shorts: | 963,029 | 2,641,729 | 590,866 |
| – Long to Short Ratio: | 1.0 to 1 | 1.1 to 1 | 0.6 to 1 |
| NET POSITION TREND: | |||
| – COT Index Score (3 Year Range Pct): | 78.6 | 44.7 | 6.9 |
| – COT Index Reading (3 Year Range): | Bullish | Bearish | Bearish-Extreme |
| NET POSITION MOVEMENT INDEX: | |||
| – 6-Week Change in Strength Index: | -14.0 | 10.1 | 6.9 |
Ultra 10-Year Notes Futures:
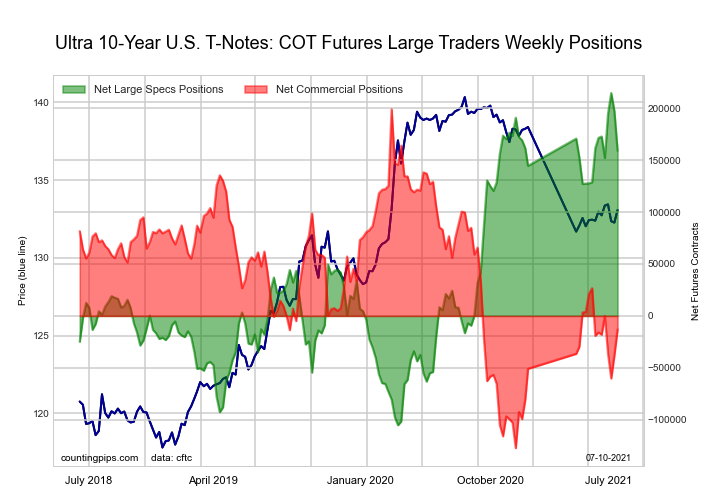 The Ultra 10-Year Notes large speculator standing this week came in at a net position of 158,913 contracts in the data reported through Tuesday. This was a weekly decline of -38,070 contracts from the previous week which had a total of 196,983 net contracts.
This week’s current strength score (the trader positioning range over the past three years, measured from 0 to 100) shows the speculators are currently Bullish with a score of 69.7 percent. The commercials are Bearish with a score of 40.6 percent and the small traders (not shown in chart) are Bearish-Extreme with a score of 9.8 percent.
| Ultra 10-Year Notes Statistics | SPECULATORS | COMMERCIALS | SMALL TRADERS |
| – Percent of Open Interest Longs: | 16.6 | 75.4 | 7.6 |
| – Percent of Open Interest Shorts: | 6.3 | 76.2 | 17.1 |
| – Net Position: | 158,913 | -12,998 | -145,915 |
| – Gross Longs: | 255,942 | 1,161,377 | 117,138 |
| – Gross Shorts: | 97,029 | 1,174,375 | 263,053 |
| – Long to Short Ratio: | 2.6 to 1 | 1.0 to 1 | 0.4 to 1 |
| NET POSITION TREND: | |||
| – COT Index Score (3 Year Range Pct): | 69.7 | 40.6 | 9.8 |
| – COT Index Reading (3 Year Range): | Bullish | Bearish | Bearish-Extreme |
| NET POSITION MOVEMENT INDEX: | |||
| – 6-Week Change in Strength Index: | -3.3 | 0.8 | 7.2 |
US Treasury Bonds Futures:
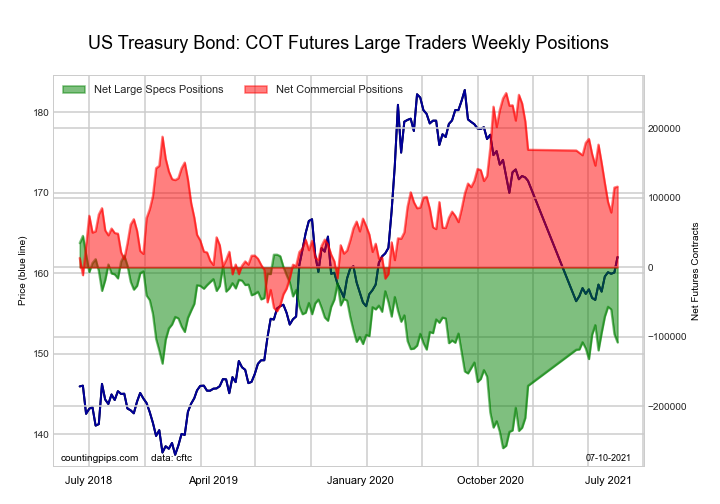 The US Treasury Bonds large speculator standing this week came in at a net position of -107,911 contracts in the data reported through Tuesday. This was a weekly reduction of -11,932 contracts from the previous week which had a total of -95,979 net contracts.
This week’s current strength score (the trader positioning range over the past three years, measured from 0 to 100) shows the speculators are currently Bullish with a score of 54.6 percent. The commercials are Bullish with a score of 57.1 percent and the small traders (not shown in chart) are Bearish with a score of 46.1 percent.
| US Treasury Bonds Statistics | SPECULATORS | COMMERCIALS | SMALL TRADERS |
| – Percent of Open Interest Longs: | 8.7 | 73.9 | 15.1 |
| – Percent of Open Interest Shorts: | 17.9 | 64.0 | 15.8 |
| – Net Position: | -107,911 | 116,135 | -8,224 |
| – Gross Longs: | 101,780 | 866,067 | 176,987 |
| – Gross Shorts: | 209,691 | 749,932 | 185,211 |
| – Long to Short Ratio: | 0.5 to 1 | 1.2 to 1 | 1.0 to 1 |
| NET POSITION TREND: | |||
| – COT Index Score (3 Year Range Pct): | 54.6 | 57.1 | 46.1 |
| – COT Index Reading (3 Year Range): | Bullish | Bullish | Bearish |
| NET POSITION MOVEMENT INDEX: | |||
| – 6-Week Change in Strength Index: | 4.1 | -19.2 | 38.8 |
Ultra US Treasury Bonds Futures:
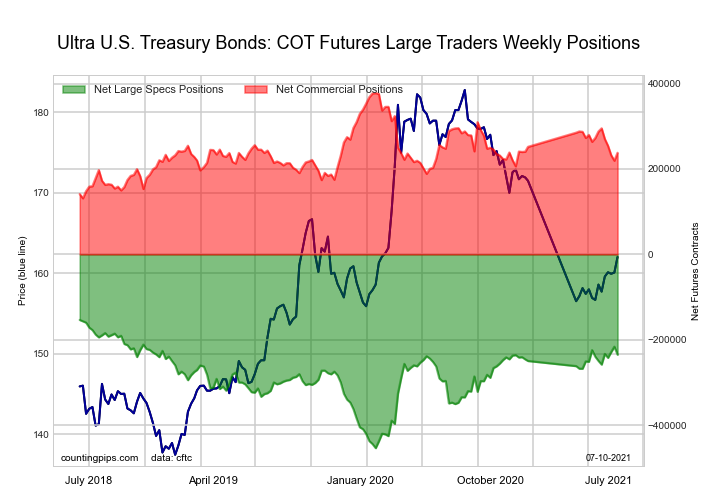 The Ultra US Treasury Bonds large speculator standing this week came in at a net position of -235,067 contracts in the data reported through Tuesday. This was a weekly decline of -18,678 contracts from the previous week which had a total of -216,389 net contracts.
This week’s current strength score (the trader positioning range over the past three years, measured from 0 to 100) shows the speculators are currently Bullish-Extreme with a score of 89.3 percent. The commercials are Bearish with a score of 37.7 percent and the small traders (not shown in chart) are Bearish with a score of 26.2 percent.
| Ultra US Treasury Bonds Statistics | SPECULATORS | COMMERCIALS | SMALL TRADERS |
| – Percent of Open Interest Longs: | 9.3 | 78.3 | 12.0 |
| – Percent of Open Interest Shorts: | 29.0 | 58.4 | 12.2 |
| – Net Position: | -235,067 | 237,915 | -2,848 |
| – Gross Longs: | 110,783 | 934,337 | 143,245 |
| – Gross Shorts: | 345,850 | 696,422 | 146,093 |
| – Long to Short Ratio: | 0.3 to 1 | 1.3 to 1 | 1.0 to 1 |
| NET POSITION TREND: | |||
| – COT Index Score (3 Year Range Pct): | 89.3 | 37.7 | 26.2 |
| – COT Index Reading (3 Year Range): | Bullish-Extreme | Bearish | Bearish |
| NET POSITION MOVEMENT INDEX: | |||
| – 6-Week Change in Strength Index: | 5.9 | -22.2 | 25.3 |
Article By CountingPips.com – Receive our weekly COT Reports by Email
*COT Report: The COT data, released weekly to the public each Friday, is updated through the most recent Tuesday (data is 3 days old) and shows a quick view of how large speculators or non-commercials (for-profit traders) were positioned in the futures markets.
The CFTC categorizes trader positions according to commercial hedgers (traders who use futures contracts for hedging as part of the business), non-commercials (large traders who speculate to realize trading profits) and nonreportable traders (usually small traders/speculators).
Find CFTC criteria here: (http://www.cftc.gov/MarketReports/CommitmentsofTraders/ExplanatoryNotes/index.htm).

- Geopolitical risks in the Middle East are declining. China kept interest rates at lows Apr 22, 2024
- Brent crude dips to four-week low amid easing geopolitical tensions Apr 22, 2024
- COT Metals Charts: Speculator bets led by Copper & Silver Apr 20, 2024
- COT Bonds Charts: Speculator bets led by 10-Year Bonds & Fed Funds Apr 20, 2024
- COT Stock Market Charts: Speculator bets led by S&P500-Mini Apr 20, 2024
- COT Soft Commodities Charts: Speculator bets led by Soybean Meal & Lean Hogs Apr 20, 2024
- 3 Signs of Developing U.S. Economic Slowdown Apr 19, 2024
- Israel has retaliated against Iran. Investors run to safe assets Apr 19, 2024
- Gold hits record high amid growing geopolitical tensions Apr 19, 2024
- The US natural gas prices fell to a 2-month low. A drop in the technology sector on Wednesday had a negative impact on the broad market Apr 18, 2024