
By CountingPips.com COT Home | Data Tables | Data Downloads | Newsletter
Here are the latest charts and statistics for the Commitment of Traders (COT) data published by the Commodities Futures Trading Commission (CFTC).
The latest COT data is updated through Tuesday June 01 2021 and shows a quick view of how large traders (for-profit speculators and commercial entities) were positioned in the futures markets.
VIX Volatility Futures Futures:
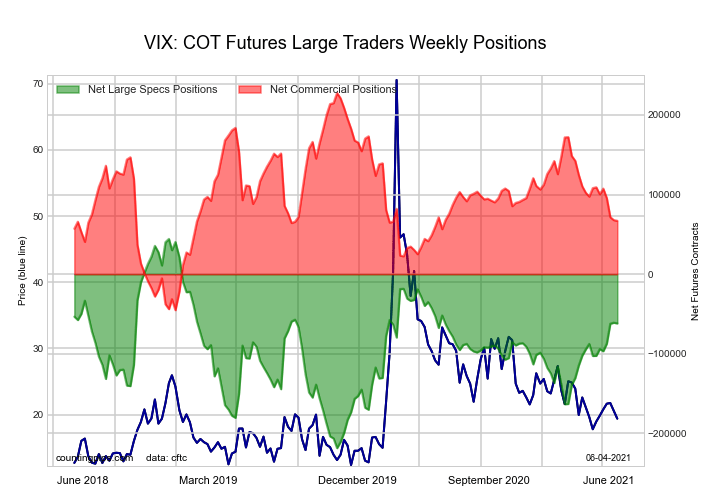
The VIX Volatility Futures large speculator standing this week recorded a net position of -61,782 contracts in the data reported through Tuesday. This was a weekly decrease of -850 contracts from the previous week which had a total of -60,932 net contracts.
This week’s current strength score (the trader positioning range over the past three years, measured from 0 to 100) shows the speculators are currently Bullish with a score of 59.6 percent. The commercials are Bearish with a score of 41.1 percent and the small traders (not shown in chart) are Bearish with a score of 36.6 percent.
Free Reports:
 Download Our Metatrader 4 Indicators – Put Our Free MetaTrader 4 Custom Indicators on your charts when you join our Weekly Newsletter
 Get our Weekly Commitment of Traders Reports - See where the biggest traders (Hedge Funds and Commercial Hedgers) are positioned in the futures markets on a weekly basis.
| VIX Volatility Futures Statistics | SPECULATORS | COMMERCIALS | SMALL TRADERS |
| – Percent of Open Interest Longs: | 23.5 | 50.6 | 6.2 |
| – Percent of Open Interest Shorts: | 41.9 | 30.6 | 7.7 |
| – Net Position: | -61,782 | 66,995 | -5,213 |
| – Gross Longs: | 78,637 | 169,612 | 20,736 |
| – Gross Shorts: | 140,419 | 102,617 | 25,949 |
| – Long to Short Ratio: | 0.6 to 1 | 1.7 to 1 | 0.8 to 1 |
| NET POSITION TREND: | |||
| – COT Index Score (3 Year Range Pct): | 59.6 | 41.1 | 36.6 |
| – COT Index Reading (3 Year Range): | Bullish | Bearish | Bearish |
| NET POSITION MOVEMENT INDEX: | |||
| – 6-Week Change in Strength Index: | 15.5 | -15.5 | 5.3 |
S&P500 Mini Futures Futures:
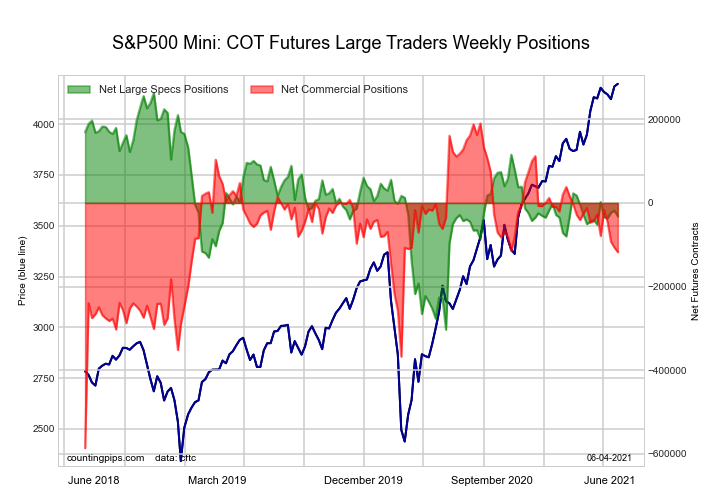
The S&P500 Mini Futures large speculator standing this week recorded a net position of -32,075 contracts in the data reported through Tuesday. This was a weekly lowering of -13,587 contracts from the previous week which had a total of -18,488 net contracts.
This week’s current strength score (the trader positioning range over the past three years, measured from 0 to 100) shows the speculators are currently Bearish with a score of 47.9 percent. The commercials are Bullish with a score of 60.4 percent and the small traders (not shown in chart) are Bullish with a score of 50.7 percent.
| S&P500 Mini Futures Statistics | SPECULATORS | COMMERCIALS | SMALL TRADERS |
| – Percent of Open Interest Longs: | 14.1 | 69.4 | 13.7 |
| – Percent of Open Interest Shorts: | 15.3 | 73.6 | 8.3 |
| – Net Position: | -32,075 | -117,612 | 149,687 |
| – Gross Longs: | 390,376 | 1,920,377 | 379,225 |
| – Gross Shorts: | 422,451 | 2,037,989 | 229,538 |
| – Long to Short Ratio: | 0.9 to 1 | 0.9 to 1 | 1.7 to 1 |
| NET POSITION TREND: | |||
| – COT Index Score (3 Year Range Pct): | 47.9 | 60.4 | 50.7 |
| – COT Index Reading (3 Year Range): | Bearish | Bullish | Bullish |
| NET POSITION MOVEMENT INDEX: | |||
| – 6-Week Change in Strength Index: | 3.5 | -11.6 | 12.9 |
Dow Jones Mini Futures Futures:
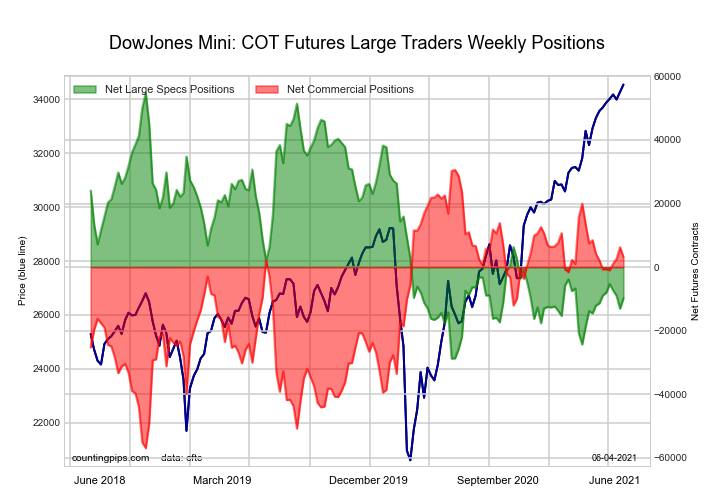
The Dow Jones Mini Futures large speculator standing this week recorded a net position of -9,765 contracts in the data reported through Tuesday. This was a weekly lift of 3,279 contracts from the previous week which had a total of -13,044 net contracts.
This week’s current strength score (the trader positioning range over the past three years, measured from 0 to 100) shows the speculators are currently Bearish with a score of 22.7 percent. The commercials are Bullish with a score of 68.7 percent and the small traders (not shown in chart) are Bullish-Extreme with a score of 82.0 percent.
| Dow Jones Mini Futures Statistics | SPECULATORS | COMMERCIALS | SMALL TRADERS |
| – Percent of Open Interest Longs: | 33.2 | 46.8 | 17.6 |
| – Percent of Open Interest Shorts: | 42.7 | 43.7 | 11.2 |
| – Net Position: | -9,765 | 3,168 | 6,597 |
| – Gross Longs: | 34,280 | 48,335 | 18,192 |
| – Gross Shorts: | 44,045 | 45,167 | 11,595 |
| – Long to Short Ratio: | 0.8 to 1 | 1.1 to 1 | 1.6 to 1 |
| NET POSITION TREND: | |||
| – COT Index Score (3 Year Range Pct): | 22.7 | 68.7 | 82.0 |
| – COT Index Reading (3 Year Range): | Bearish | Bullish | Bullish-Extreme |
| NET POSITION MOVEMENT INDEX: | |||
| – 6-Week Change in Strength Index: | -1.1 | 4.5 | -18.0 |
Nasdaq Mini Futures Futures:
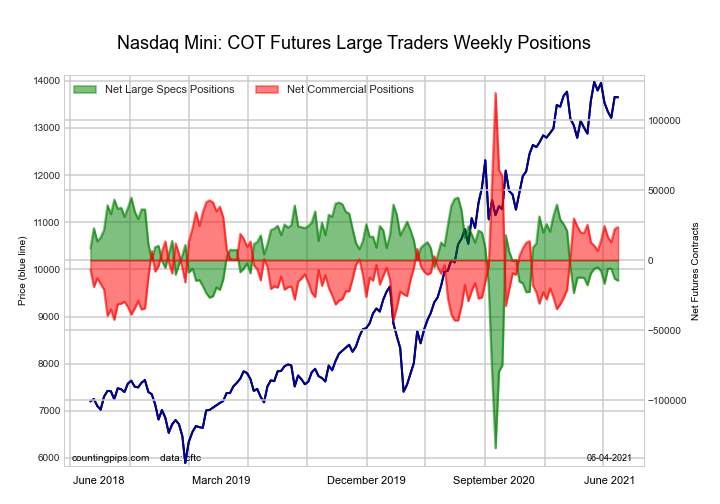
The Nasdaq Mini Futures large speculator standing this week recorded a net position of -14,549 contracts in the data reported through Tuesday. This was a weekly decline of -1,254 contracts from the previous week which had a total of -13,295 net contracts.
This week’s current strength score (the trader positioning range over the past three years, measured from 0 to 100) shows the speculators are currently Bullish with a score of 66.9 percent. The commercials are Bearish with a score of 41.0 percent and the small traders (not shown in chart) are Bearish with a score of 23.8 percent.
| Nasdaq Mini Futures Statistics | SPECULATORS | COMMERCIALS | SMALL TRADERS |
| – Percent of Open Interest Longs: | 22.3 | 60.1 | 15.6 |
| – Percent of Open Interest Shorts: | 28.4 | 50.2 | 19.4 |
| – Net Position: | -14,549 | 23,564 | -9,015 |
| – Gross Longs: | 53,160 | 143,253 | 37,164 |
| – Gross Shorts: | 67,709 | 119,689 | 46,179 |
| – Long to Short Ratio: | 0.8 to 1 | 1.2 to 1 | 0.8 to 1 |
| NET POSITION TREND: | |||
| – COT Index Score (3 Year Range Pct): | 66.9 | 41.0 | 23.8 |
| – COT Index Reading (3 Year Range): | Bullish | Bearish | Bearish |
| NET POSITION MOVEMENT INDEX: | |||
| – 6-Week Change in Strength Index: | -5.3 | 10.4 | -16.8 |
Russell 2000 Mini Futures Futures:
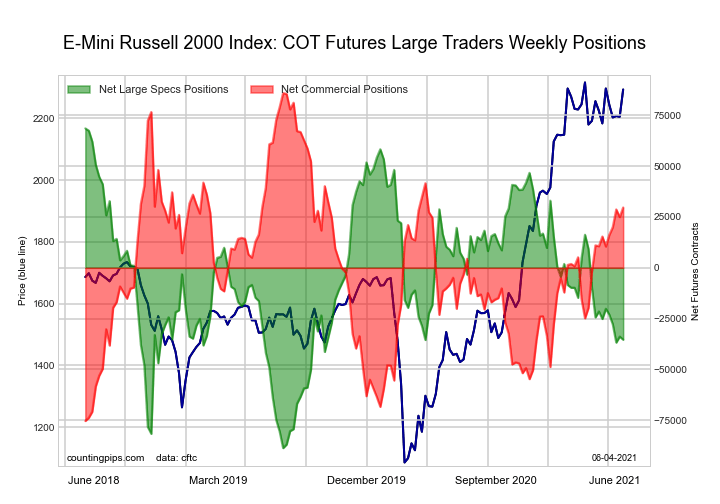
The Russell 2000 Mini Futures large speculator standing this week recorded a net position of -35,386 contracts in the data reported through Tuesday. This was a weekly decrease of -1,526 contracts from the previous week which had a total of -33,860 net contracts.
This week’s current strength score (the trader positioning range over the past three years, measured from 0 to 100) shows the speculators are currently Bearish with a score of 33.9 percent. The commercials are Bullish with a score of 65.1 percent and the small traders (not shown in chart) are Bearish with a score of 49.2 percent.
| Russell 2000 Mini Futures Statistics | SPECULATORS | COMMERCIALS | SMALL TRADERS |
| – Percent of Open Interest Longs: | 15.4 | 77.9 | 5.8 |
| – Percent of Open Interest Shorts: | 23.2 | 71.4 | 4.5 |
| – Net Position: | -35,386 | 29,674 | 5,712 |
| – Gross Longs: | 70,310 | 355,620 | 26,460 |
| – Gross Shorts: | 105,696 | 325,946 | 20,748 |
| – Long to Short Ratio: | 0.7 to 1 | 1.1 to 1 | 1.3 to 1 |
| NET POSITION TREND: | |||
| – COT Index Score (3 Year Range Pct): | 33.9 | 65.1 | 49.2 |
| – COT Index Reading (3 Year Range): | Bearish | Bullish | Bearish |
| NET POSITION MOVEMENT INDEX: | |||
| – 6-Week Change in Strength Index: | -6.5 | 8.8 | -11.5 |
Nikkei Stock Average (USD) Futures Futures:
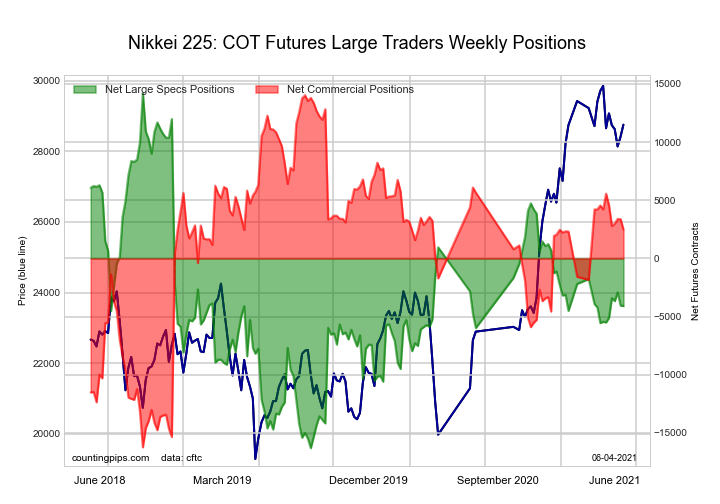
The Nikkei Stock Average (USD) Futures large speculator standing this week recorded a net position of -4,091 contracts in the data reported through Tuesday. This was a weekly lowering of -45 contracts from the previous week which had a total of -4,046 net contracts.
This week’s current strength score (the trader positioning range over the past three years, measured from 0 to 100) shows the speculators are currently Bearish with a score of 40.0 percent. The commercials are Bullish with a score of 61.9 percent and the small traders (not shown in chart) are Bearish with a score of 37.5 percent.
| Nikkei Stock Average Futures Statistics | SPECULATORS | COMMERCIALS | SMALL TRADERS |
| – Percent of Open Interest Longs: | 15.9 | 53.4 | 30.4 |
| – Percent of Open Interest Shorts: | 39.9 | 38.8 | 21.0 |
| – Net Position: | -4,091 | 2,488 | 1,603 |
| – Gross Longs: | 2,699 | 9,092 | 5,171 |
| – Gross Shorts: | 6,790 | 6,604 | 3,568 |
| – Long to Short Ratio: | 0.4 to 1 | 1.4 to 1 | 1.4 to 1 |
| NET POSITION TREND: | |||
| – COT Index Score (3 Year Range Pct): | 40.0 | 61.9 | 37.5 |
| – COT Index Reading (3 Year Range): | Bearish | Bullish | Bearish |
| NET POSITION MOVEMENT INDEX: | |||
| – 6-Week Change in Strength Index: | 4.6 | -10.1 | 19.7 |
MSCI EAFE Mini Futures Futures:
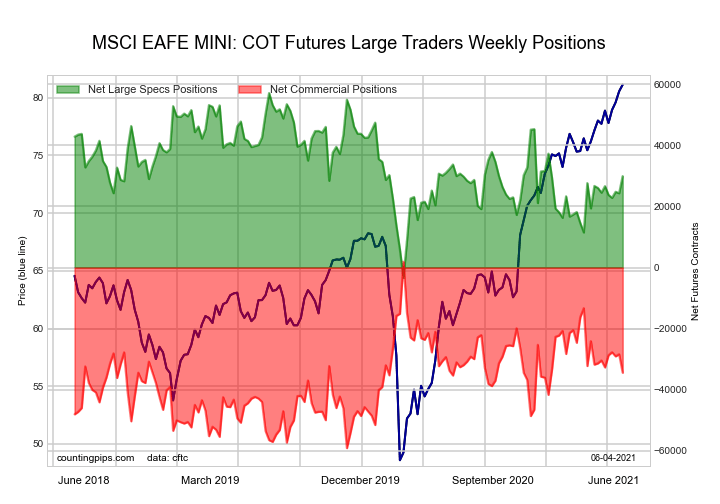
The MSCI EAFE Mini Futures large speculator standing this week recorded a net position of 29,956 contracts in the data reported through Tuesday. This was a weekly lift of 5,602 contracts from the previous week which had a total of 24,354 net contracts.
This week’s current strength score (the trader positioning range over the past three years, measured from 0 to 100) shows the speculators are currently Bullish with a score of 55.1 percent. The commercials are Bearish with a score of 40.5 percent and the small traders (not shown in chart) are Bullish with a score of 56.9 percent.
| MSCI EAFE Mini Futures Statistics | SPECULATORS | COMMERCIALS | SMALL TRADERS |
| – Percent of Open Interest Longs: | 9.5 | 87.7 | 2.5 |
| – Percent of Open Interest Shorts: | 2.1 | 96.3 | 1.3 |
| – Net Position: | 29,956 | -34,474 | 4,518 |
| – Gross Longs: | 38,312 | 353,090 | 9,883 |
| – Gross Shorts: | 8,356 | 387,564 | 5,365 |
| – Long to Short Ratio: | 4.6 to 1 | 0.9 to 1 | 1.8 to 1 |
| NET POSITION TREND: | |||
| – COT Index Score (3 Year Range Pct): | 55.1 | 40.5 | 56.9 |
| – COT Index Reading (3 Year Range): | Bullish | Bearish | Bullish |
| NET POSITION MOVEMENT INDEX: | |||
| – 6-Week Change in Strength Index: | 8.9 | -6.6 | -12.8 |
MSCI Emerging Mkts Mini Futures Futures:
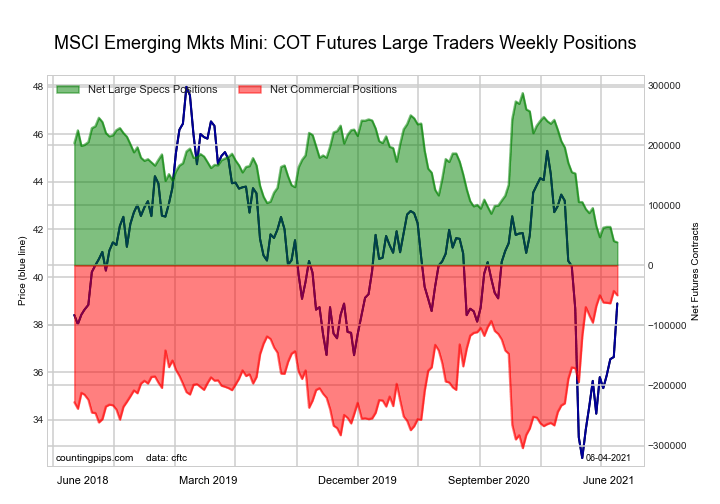
The MSCI Emerging Mkts Mini Futures large speculator standing this week recorded a net position of 38,211 contracts in the data reported through Tuesday. This was a weekly lowering of -2,219 contracts from the previous week which had a total of 40,430 net contracts.
This week’s current strength score (the trader positioning range over the past three years, measured from 0 to 100) shows the speculators are currently Bearish-Extreme with a score of 0.0 percent. The commercials are Bullish-Extreme with a score of 97.2 percent and the small traders (not shown in chart) are Bearish with a score of 40.4 percent.
| MSCI Emerging Mkts Mini Futures Statistics | SPECULATORS | COMMERCIALS | SMALL TRADERS |
| – Percent of Open Interest Longs: | 14.3 | 82.2 | 2.4 |
| – Percent of Open Interest Shorts: | 11.0 | 86.5 | 1.3 |
| – Net Position: | 38,211 | -49,886 | 11,675 |
| – Gross Longs: | 165,150 | 950,685 | 27,250 |
| – Gross Shorts: | 126,939 | 1,000,571 | 15,575 |
| – Long to Short Ratio: | 1.3 to 1 | 1.0 to 1 | 1.7 to 1 |
| NET POSITION TREND: | |||
| – COT Index Score (3 Year Range Pct): | 0.0 | 97.2 | 40.4 |
| – COT Index Reading (3 Year Range): | Bearish-Extreme | Bullish-Extreme | Bearish |
| NET POSITION MOVEMENT INDEX: | |||
| – 6-Week Change in Strength Index: | -11.0 | 6.8 | 7.3 |
Article By CountingPips.com – Receive our weekly COT Reports by Email
*COT Report: The COT data, released weekly to the public each Friday, is updated through the most recent Tuesday (data is 3 days old) and shows a quick view of how large speculators or non-commercials (for-profit traders) were positioned in the futures markets.
The CFTC categorizes trader positions according to commercial hedgers (traders who use futures contracts for hedging as part of the business), non-commercials (large traders who speculate to realize trading profits) and nonreportable traders (usually small traders/speculators).
Find CFTC criteria here: (http://www.cftc.gov/MarketReports/CommitmentsofTraders/ExplanatoryNotes/index.htm).

- TSLA shares rose on a weak report. Inflationary pressures are easing in Australia Apr 24, 2024
- USDJPY: On intervention watch Apr 24, 2024
- Euro gains against the dollar amid mixed economic signals Apr 24, 2024
- PMI data is the focus of investors’ attention today. Turkey, Iraq, Qatar, and UAE signed a transportation agreement Apr 23, 2024
- Australian dollar rises on strong economic indicators Apr 23, 2024
- Geopolitical risks in the Middle East are declining. China kept interest rates at lows Apr 22, 2024
- Brent crude dips to four-week low amid easing geopolitical tensions Apr 22, 2024
- COT Metals Charts: Speculator bets led by Copper & Silver Apr 20, 2024
- COT Bonds Charts: Speculator bets led by 10-Year Bonds & Fed Funds Apr 20, 2024
- COT Stock Market Charts: Speculator bets led by S&P500-Mini Apr 20, 2024