
By CountingPips.com COT Home | Data Tables | Data Downloads | Newsletter
Here are the latest charts and statistics for the Commitment of Traders (COT) data published by the Commodities Futures Trading Commission (CFTC).
The latest COT data is updated through Tuesday June 08 2021 and shows a quick view of how large traders (for-profit speculators and commercial entities) were positioned in the futures markets.
CORN Futures:
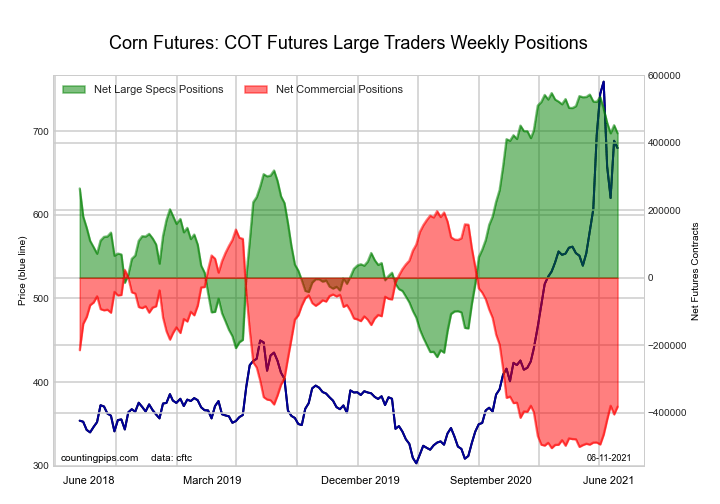
The CORN large speculator standing this week was a net position of 428,428 contracts in the data reported through Tuesday. This was a weekly reduction of -23,948 contracts from the previous week which had a total of 452,376 net contracts.
This week’s current strength score (the trader positioning range over the past three years, measured from 0 to 100) shows the speculators are currently Bullish-Extreme with a score of 84.8 percent. The commercials are Bearish-Extreme with a score of 17.5 percent and the small traders (not shown in chart) are Bearish-Extreme with a score of 10.2 percent.
Free Reports:
 Sign Up for Our Stock Market Newsletter – Get updated on News, Charts & Rankings of Public Companies when you join our Stocks Newsletter
 Get our Weekly Commitment of Traders Reports - See where the biggest traders (Hedge Funds and Commercial Hedgers) are positioned in the futures markets on a weekly basis.
| CORN Futures Statistics | SPECULATORS | COMMERCIALS | SMALL TRADERS |
| – Percent of Open Interest Longs: | 30.1 | 48.9 | 8.7 |
| – Percent of Open Interest Shorts: | 5.3 | 71.1 | 11.4 |
| – Net Position: | 428,428 | -382,167 | -46,261 |
| – Gross Longs: | 519,602 | 845,730 | 150,034 |
| – Gross Shorts: | 91,174 | 1,227,897 | 196,295 |
| – Long to Short Ratio: | 5.7 to 1 | 0.7 to 1 | 0.8 to 1 |
| NET POSITION TREND: | |||
| – COT Index Score (3 Year Range Pct): | 84.8 | 17.5 | 10.2 |
| – COT Index Reading (3 Year Range): | Bullish-Extreme | Bearish-Extreme | Bearish-Extreme |
| NET POSITION MOVEMENT INDEX: | |||
| – 6-Week Change in Strength Index: | -11.9 | 15.1 | -8.1 |
SUGAR Futures:
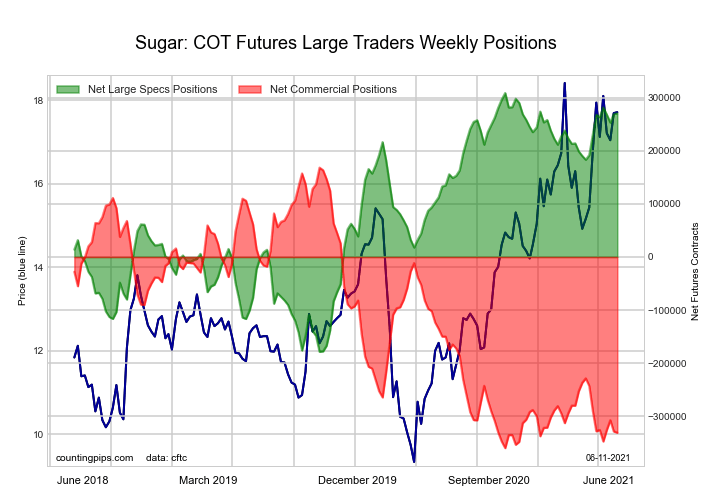
The SUGAR large speculator standing this week was a net position of 270,109 contracts in the data reported through Tuesday. This was a weekly lift of 883 contracts from the previous week which had a total of 269,226 net contracts.
This week’s current strength score (the trader positioning range over the past three years, measured from 0 to 100) shows the speculators are currently Bullish-Extreme with a score of 92.1 percent. The commercials are Bearish-Extreme with a score of 5.5 percent and the small traders (not shown in chart) are Bullish-Extreme with a score of 82.6 percent.
| SUGAR Futures Statistics | SPECULATORS | COMMERCIALS | SMALL TRADERS |
| – Percent of Open Interest Longs: | 30.6 | 44.3 | 9.9 |
| – Percent of Open Interest Shorts: | 4.1 | 76.8 | 3.9 |
| – Net Position: | 270,109 | -330,549 | 60,440 |
| – Gross Longs: | 311,503 | 451,021 | 100,335 |
| – Gross Shorts: | 41,394 | 781,570 | 39,895 |
| – Long to Short Ratio: | 7.5 to 1 | 0.6 to 1 | 2.5 to 1 |
| NET POSITION TREND: | |||
| – COT Index Score (3 Year Range Pct): | 92.1 | 5.5 | 82.6 |
| – COT Index Reading (3 Year Range): | Bullish-Extreme | Bearish-Extreme | Bullish-Extreme |
| NET POSITION MOVEMENT INDEX: | |||
| – 6-Week Change in Strength Index: | 0.5 | -0.5 | 0.3 |
COFFEE Futures:
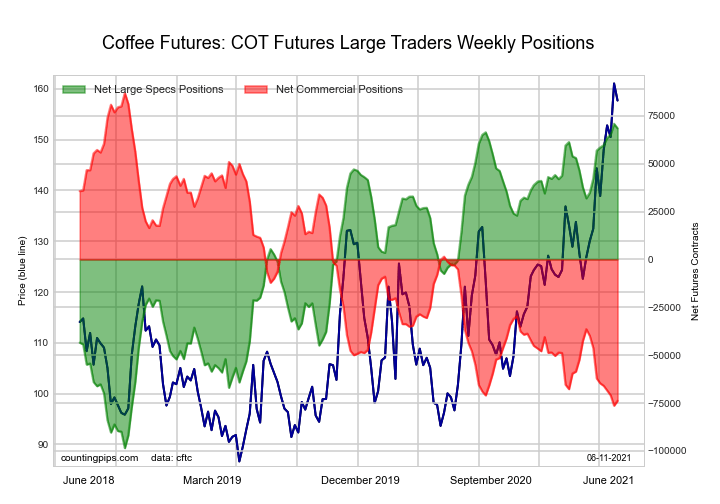
The COFFEE large speculator standing this week was a net position of 68,404 contracts in the data reported through Tuesday. This was a weekly decrease of -2,369 contracts from the previous week which had a total of 70,773 net contracts.
This week’s current strength score (the trader positioning range over the past three years, measured from 0 to 100) shows the speculators are currently Bullish-Extreme with a score of 98.6 percent. The commercials are Bearish-Extreme with a score of 1.5 percent and the small traders (not shown in chart) are Bearish with a score of 25.6 percent.
| COFFEE Futures Statistics | SPECULATORS | COMMERCIALS | SMALL TRADERS |
| – Percent of Open Interest Longs: | 31.4 | 44.5 | 4.5 |
| – Percent of Open Interest Shorts: | 8.1 | 69.6 | 2.7 |
| – Net Position: | 68,404 | -73,792 | 5,388 |
| – Gross Longs: | 92,148 | 130,866 | 13,302 |
| – Gross Shorts: | 23,744 | 204,658 | 7,914 |
| – Long to Short Ratio: | 3.9 to 1 | 0.6 to 1 | 1.7 to 1 |
| NET POSITION TREND: | |||
| – COT Index Score (3 Year Range Pct): | 98.6 | 1.5 | 25.6 |
| – COT Index Reading (3 Year Range): | Bullish-Extreme | Bearish-Extreme | Bearish |
| NET POSITION MOVEMENT INDEX: | |||
| – 6-Week Change in Strength Index: | 6.9 | -7.1 | 0.5 |
SOYBEANS Futures:

The SOYBEANS large speculator standing this week was a net position of 226,688 contracts in the data reported through Tuesday. This was a weekly boost of 2,612 contracts from the previous week which had a total of 224,076 net contracts.
This week’s current strength score (the trader positioning range over the past three years, measured from 0 to 100) shows the speculators are currently Bullish-Extreme with a score of 86.3 percent. The commercials are Bearish-Extreme with a score of 13.4 percent and the small traders (not shown in chart) are Bullish with a score of 65.0 percent.
| SOYBEANS Futures Statistics | SPECULATORS | COMMERCIALS | SMALL TRADERS |
| – Percent of Open Interest Longs: | 34.5 | 44.6 | 7.8 |
| – Percent of Open Interest Shorts: | 6.7 | 71.9 | 8.3 |
| – Net Position: | 226,688 | -222,616 | -4,072 |
| – Gross Longs: | 281,347 | 362,913 | 63,392 |
| – Gross Shorts: | 54,659 | 585,529 | 67,464 |
| – Long to Short Ratio: | 5.1 to 1 | 0.6 to 1 | 0.9 to 1 |
| NET POSITION TREND: | |||
| – COT Index Score (3 Year Range Pct): | 86.3 | 13.4 | 65.0 |
| – COT Index Reading (3 Year Range): | Bullish-Extreme | Bearish-Extreme | Bullish |
| NET POSITION MOVEMENT INDEX: | |||
| – 6-Week Change in Strength Index: | -5.9 | 6.1 | -3.2 |
SOYBEAN OIL Futures:
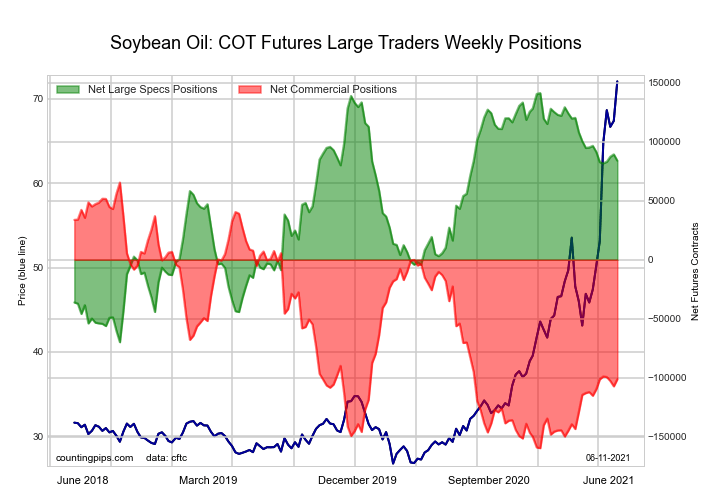
The SOYBEAN OIL large speculator standing this week was a net position of 83,891 contracts in the data reported through Tuesday. This was a weekly reduction of -5,342 contracts from the previous week which had a total of 89,233 net contracts.
This week’s current strength score (the trader positioning range over the past three years, measured from 0 to 100) shows the speculators are currently Bullish with a score of 72.9 percent. The commercials are Bearish with a score of 25.9 percent and the small traders (not shown in chart) are Bullish with a score of 78.0 percent.
| SOYBEAN OIL Futures Statistics | SPECULATORS | COMMERCIALS | SMALL TRADERS |
| – Percent of Open Interest Longs: | 22.1 | 46.3 | 8.5 |
| – Percent of Open Interest Shorts: | 6.5 | 65.2 | 5.3 |
| – Net Position: | 83,891 | -101,202 | 17,311 |
| – Gross Longs: | 118,634 | 248,684 | 45,724 |
| – Gross Shorts: | 34,743 | 349,886 | 28,413 |
| – Long to Short Ratio: | 3.4 to 1 | 0.7 to 1 | 1.6 to 1 |
| NET POSITION TREND: | |||
| – COT Index Score (3 Year Range Pct): | 72.9 | 25.9 | 78.0 |
| – COT Index Reading (3 Year Range): | Bullish | Bearish | Bullish |
| NET POSITION MOVEMENT INDEX: | |||
| – 6-Week Change in Strength Index: | -3.5 | 3.8 | -4.3 |
SOYBEAN MEAL Futures:
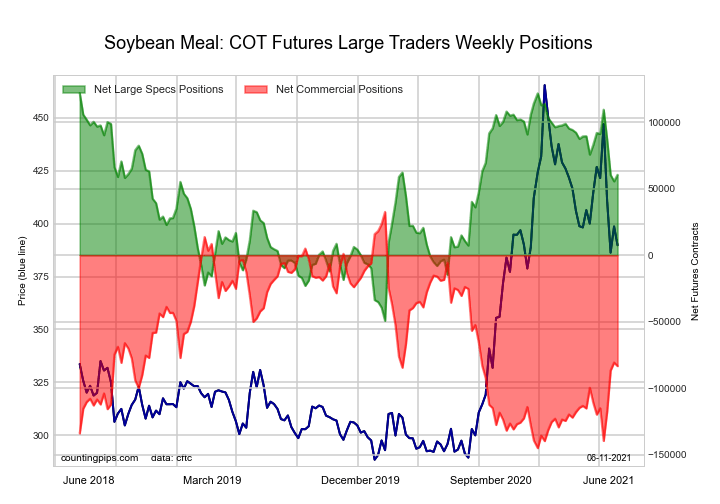
The SOYBEAN MEAL large speculator standing this week was a net position of 60,422 contracts in the data reported through Tuesday. This was a weekly gain of 4,886 contracts from the previous week which had a total of 55,536 net contracts.
This week’s current strength score (the trader positioning range over the past three years, measured from 0 to 100) shows the speculators are currently Bullish with a score of 64.1 percent. The commercials are Bearish with a score of 34.7 percent and the small traders (not shown in chart) are Bullish with a score of 62.6 percent.
| SOYBEAN MEAL Futures Statistics | SPECULATORS | COMMERCIALS | SMALL TRADERS |
| – Percent of Open Interest Longs: | 22.0 | 51.5 | 12.3 |
| – Percent of Open Interest Shorts: | 7.0 | 72.2 | 6.6 |
| – Net Position: | 60,422 | -83,369 | 22,947 |
| – Gross Longs: | 88,799 | 208,229 | 49,525 |
| – Gross Shorts: | 28,377 | 291,598 | 26,578 |
| – Long to Short Ratio: | 3.1 to 1 | 0.7 to 1 | 1.9 to 1 |
| NET POSITION TREND: | |||
| – COT Index Score (3 Year Range Pct): | 64.1 | 34.7 | 62.6 |
| – COT Index Reading (3 Year Range): | Bullish | Bearish | Bullish |
| NET POSITION MOVEMENT INDEX: | |||
| – 6-Week Change in Strength Index: | -18.4 | 20.5 | -19.8 |
LIVE CATTLE Futures:
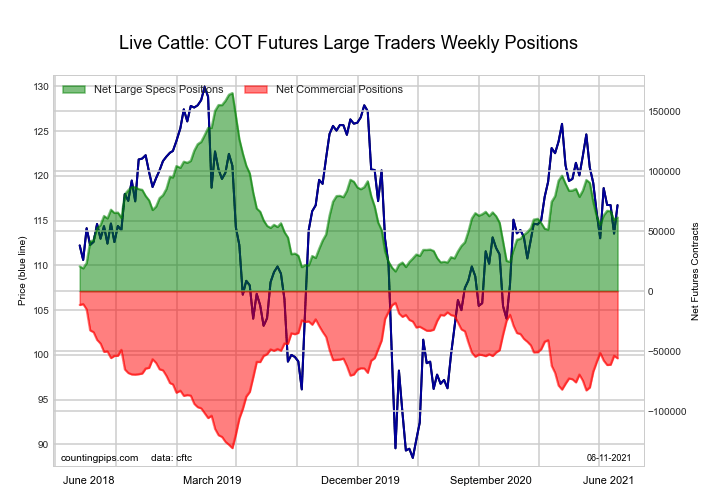
The LIVE CATTLE large speculator standing this week was a net position of 61,488 contracts in the data reported through Tuesday. This was a weekly rise of 2,002 contracts from the previous week which had a total of 59,486 net contracts.
This week’s current strength score (the trader positioning range over the past three years, measured from 0 to 100) shows the speculators are currently Bearish with a score of 30.3 percent. The commercials are Bullish with a score of 61.9 percent and the small traders (not shown in chart) are Bullish with a score of 73.6 percent.
| LIVE CATTLE Futures Statistics | SPECULATORS | COMMERCIALS | SMALL TRADERS |
| – Percent of Open Interest Longs: | 38.2 | 39.8 | 9.9 |
| – Percent of Open Interest Shorts: | 17.7 | 58.5 | 11.8 |
| – Net Position: | 61,488 | -55,935 | -5,553 |
| – Gross Longs: | 114,447 | 119,427 | 29,748 |
| – Gross Shorts: | 52,959 | 175,362 | 35,301 |
| – Long to Short Ratio: | 2.2 to 1 | 0.7 to 1 | 0.8 to 1 |
| NET POSITION TREND: | |||
| – COT Index Score (3 Year Range Pct): | 30.3 | 61.9 | 73.6 |
| – COT Index Reading (3 Year Range): | Bearish | Bullish | Bullish |
| NET POSITION MOVEMENT INDEX: | |||
| – 6-Week Change in Strength Index: | -0.5 | 2.5 | -5.6 |
LEAN HOGS Futures:
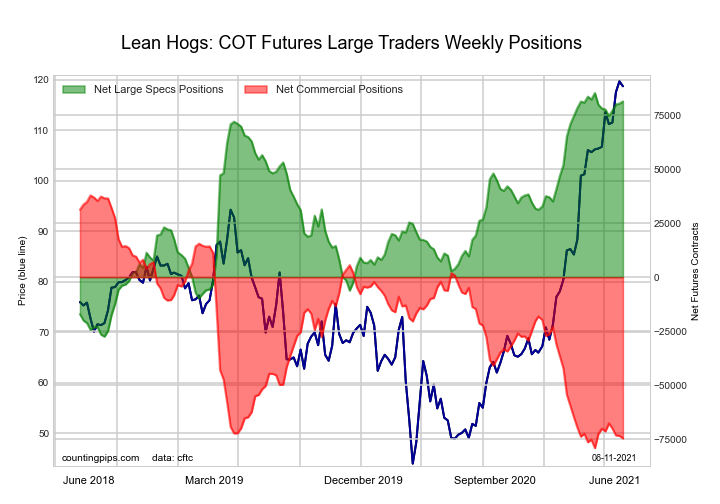
The LEAN HOGS large speculator standing this week was a net position of 81,363 contracts in the data reported through Tuesday. This was a weekly boost of 1,068 contracts from the previous week which had a total of 80,295 net contracts.
This week’s current strength score (the trader positioning range over the past three years, measured from 0 to 100) shows the speculators are currently Bullish-Extreme with a score of 96.6 percent. The commercials are Bearish-Extreme with a score of 3.8 percent and the small traders (not shown in chart) are Bearish with a score of 45.6 percent.
| LEAN HOGS Futures Statistics | SPECULATORS | COMMERCIALS | SMALL TRADERS |
| – Percent of Open Interest Longs: | 42.1 | 29.3 | 9.2 |
| – Percent of Open Interest Shorts: | 15.1 | 54.1 | 11.4 |
| – Net Position: | 81,363 | -74,598 | -6,765 |
| – Gross Longs: | 126,762 | 88,014 | 27,670 |
| – Gross Shorts: | 45,399 | 162,612 | 34,435 |
| – Long to Short Ratio: | 2.8 to 1 | 0.5 to 1 | 0.8 to 1 |
| NET POSITION TREND: | |||
| – COT Index Score (3 Year Range Pct): | 96.6 | 3.8 | 45.6 |
| – COT Index Reading (3 Year Range): | Bullish-Extreme | Bearish-Extreme | Bearish |
| NET POSITION MOVEMENT INDEX: | |||
| – 6-Week Change in Strength Index: | 2.9 | -3.9 | 5.7 |
COTTON Futures:
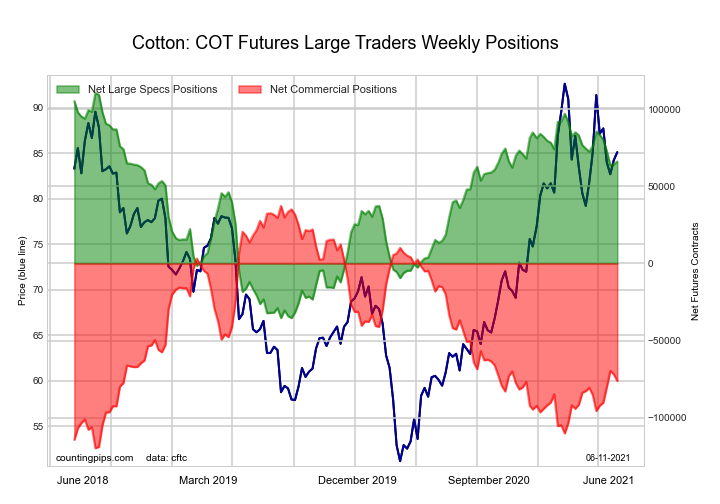
The COTTON large speculator standing this week was a net position of 66,079 contracts in the data reported through Tuesday. This was a weekly lift of 1,873 contracts from the previous week which had a total of 64,206 net contracts.
This week’s current strength score (the trader positioning range over the past three years, measured from 0 to 100) shows the speculators are currently Bullish with a score of 69.6 percent. The commercials are Bearish with a score of 27.7 percent and the small traders (not shown in chart) are Bullish with a score of 77.2 percent.
| COTTON Futures Statistics | SPECULATORS | COMMERCIALS | SMALL TRADERS |
| – Percent of Open Interest Longs: | 34.8 | 45.7 | 7.5 |
| – Percent of Open Interest Shorts: | 6.0 | 78.9 | 3.1 |
| – Net Position: | 66,079 | -76,113 | 10,034 |
| – Gross Longs: | 79,752 | 104,473 | 17,223 |
| – Gross Shorts: | 13,673 | 180,586 | 7,189 |
| – Long to Short Ratio: | 5.8 to 1 | 0.6 to 1 | 2.4 to 1 |
| NET POSITION TREND: | |||
| – COT Index Score (3 Year Range Pct): | 69.6 | 27.7 | 77.2 |
| – COT Index Reading (3 Year Range): | Bullish | Bearish | Bullish |
| NET POSITION MOVEMENT INDEX: | |||
| – 6-Week Change in Strength Index: | -13.3 | 12.4 | -0.4 |
COCOA Futures:
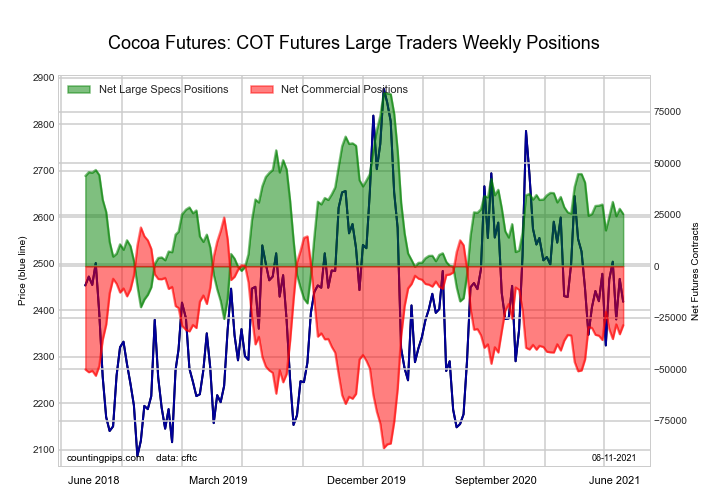
The COCOA large speculator standing this week was a net position of 25,369 contracts in the data reported through Tuesday. This was a weekly fall of -2,509 contracts from the previous week which had a total of 27,878 net contracts.
This week’s current strength score (the trader positioning range over the past three years, measured from 0 to 100) shows the speculators are currently Bearish with a score of 46.5 percent. The commercials are Bullish with a score of 53.3 percent and the small traders (not shown in chart) are Bearish with a score of 45.5 percent.
| COCOA Futures Statistics | SPECULATORS | COMMERCIALS | SMALL TRADERS |
| – Percent of Open Interest Longs: | 28.7 | 46.1 | 5.7 |
| – Percent of Open Interest Shorts: | 16.6 | 59.7 | 4.2 |
| – Net Position: | 25,369 | -28,626 | 3,257 |
| – Gross Longs: | 60,293 | 96,806 | 12,038 |
| – Gross Shorts: | 34,924 | 125,432 | 8,781 |
| – Long to Short Ratio: | 1.7 to 1 | 0.8 to 1 | 1.4 to 1 |
| NET POSITION TREND: | |||
| – COT Index Score (3 Year Range Pct): | 46.5 | 53.3 | 45.5 |
| – COT Index Reading (3 Year Range): | Bearish | Bullish | Bearish |
| NET POSITION MOVEMENT INDEX: | |||
| – 6-Week Change in Strength Index: | -4.2 | 6.4 | -29.1 |
WHEAT Futures:

The WHEAT large speculator standing this week was a net position of 18,617 contracts in the data reported through Tuesday. This was a weekly decrease of -178 contracts from the previous week which had a total of 18,795 net contracts.
This week’s current strength score (the trader positioning range over the past three years, measured from 0 to 100) shows the speculators are currently Bullish with a score of 52.1 percent. The commercials are Bearish with a score of 46.7 percent and the small traders (not shown in chart) are Bullish with a score of 73.3 percent.
| WHEAT Futures Statistics | SPECULATORS | COMMERCIALS | SMALL TRADERS |
| – Percent of Open Interest Longs: | 26.6 | 36.8 | 7.6 |
| – Percent of Open Interest Shorts: | 22.1 | 39.8 | 9.1 |
| – Net Position: | 18,617 | -12,690 | -5,927 |
| – Gross Longs: | 109,402 | 150,990 | 31,347 |
| – Gross Shorts: | 90,785 | 163,680 | 37,274 |
| – Long to Short Ratio: | 1.2 to 1 | 0.9 to 1 | 0.8 to 1 |
| NET POSITION TREND: | |||
| – COT Index Score (3 Year Range Pct): | 52.1 | 46.7 | 73.3 |
| – COT Index Reading (3 Year Range): | Bullish | Bearish | Bullish |
| NET POSITION MOVEMENT INDEX: | |||
| – 6-Week Change in Strength Index: | -7.8 | 5.2 | 18.7 |
Article By CountingPips.com – Receive our weekly COT Reports by Email
*COT Report: The COT data, released weekly to the public each Friday, is updated through the most recent Tuesday (data is 3 days old) and shows a quick view of how large speculators or non-commercials (for-profit traders) were positioned in the futures markets.
The CFTC categorizes trader positions according to commercial hedgers (traders who use futures contracts for hedging as part of the business), non-commercials (large traders who speculate to realize trading profits) and nonreportable traders (usually small traders/speculators).
Find CFTC criteria here: (http://www.cftc.gov/MarketReports/CommitmentsofTraders/ExplanatoryNotes/index.htm).

- The US natural gas prices fell to a 2-month low. A drop in the technology sector on Wednesday had a negative impact on the broad market Apr 18, 2024
- Target Thursdays: Cocoa, Bitcoin and USDCHF hit targets! Apr 18, 2024
- British Pound shows signs of recovery amid favourable inflation data Apr 18, 2024
- Indices decline amid hawkish comments from the Fed. Investors are waiting for Israel’s answer Apr 17, 2024
- EURGBP: Slams into support on hot UK inflation Apr 17, 2024
- Brent crude prices dip amid concerns over global demand Apr 17, 2024
- Stock indices sell-off amid rising geopolitical tensions in the Middle East. China’s GDP grew the most in a year Apr 16, 2024
- New FXTM commodity hits all-time high! Apr 16, 2024
- NZD hits five-month low against strong US dollar Apr 16, 2024
- Escalating conflict in the Middle East is forcing investors to shift funds to safe assets Apr 15, 2024