
By CountingPips.com COT Home | Data Tables | Data Downloads | Newsletter
Here are the latest charts and statistics for the Commitment of Traders (COT) data published by the Commodities Futures Trading Commission (CFTC).
The latest COT data is updated through Tuesday June 15 2021 and shows a quick view of how large traders (for-profit speculators and commercial entities) were positioned in the futures markets.
Gold Comex Futures:
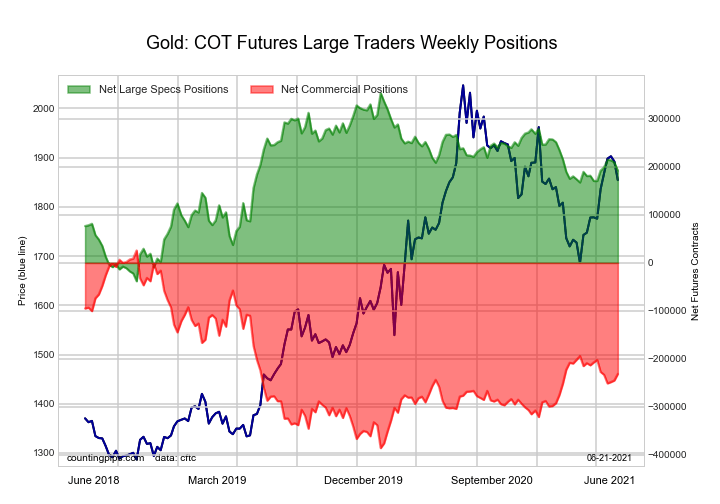 The Gold Comex Futures large speculator standing this week reached a net position of 192,036 contracts in the data reported through Tuesday. This was a weekly decrease of -17,351 contracts from the previous week which had a total of 209,387 net contracts.
This week’s current strength score (the trader positioning range over the past three years, measured from 0 to 100) shows the speculators are currently Bullish with a score of 58.8 percent. The commercials are Bearish with a score of 37.5 percent and the small traders (not shown in chart) are Bullish with a score of 78.9 percent.
| Gold Futures Statistics | SPECULATORS | COMMERCIALS | SMALL TRADERS |
| – Percent of Open Interest Longs: | 57.1 | 22.1 | 11.7 |
| – Percent of Open Interest Shorts: | 17.1 | 70.3 | 3.6 |
| – Net Position: | 192,036 | -231,226 | 39,190 |
| – Gross Longs: | 273,947 | 106,323 | 56,320 |
| – Gross Shorts: | 81,911 | 337,549 | 17,130 |
| – Long to Short Ratio: | 3.3 to 1 | 0.3 to 1 | 3.3 to 1 |
| NET POSITION TREND: | |||
| – COT Index Score (3 Year Range Pct): | 58.8 | 37.5 | 78.9 |
| – COT Index Reading (3 Year Range): | Bullish | Bearish | Bullish |
| NET POSITION MOVEMENT INDEX: | |||
| – 6-Week Change in Strength Index: | 5.4 | -7.1 | 19.6 |
Free Reports:
 Get our Weekly Commitment of Traders Reports - See where the biggest traders (Hedge Funds and Commercial Hedgers) are positioned in the futures markets on a weekly basis.
 Download Our Metatrader 4 Indicators – Put Our Free MetaTrader 4 Custom Indicators on your charts when you join our Weekly Newsletter
Silver Comex Futures:
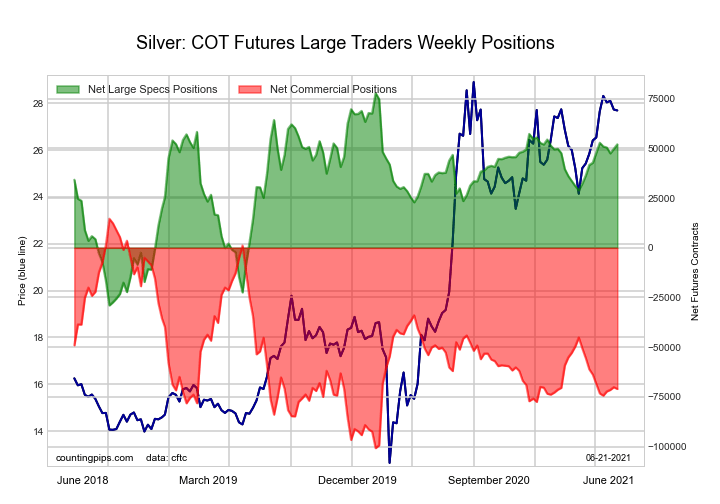 The Silver Comex Futures large speculator standing this week reached a net position of 52,064 contracts in the data reported through Tuesday. This was a weekly lift of 2,258 contracts from the previous week which had a total of 49,806 net contracts.
This week’s current strength score (the trader positioning range over the past three years, measured from 0 to 100) shows the speculators are currently Bullish with a score of 75.8 percent. The commercials are Bearish with a score of 25.8 percent and the small traders (not shown in chart) are Bullish with a score of 51.4 percent.
| Silver Futures Statistics | SPECULATORS | COMMERCIALS | SMALL TRADERS |
| – Percent of Open Interest Longs: | 45.6 | 31.6 | 16.2 |
| – Percent of Open Interest Shorts: | 18.8 | 68.2 | 6.5 |
| – Net Position: | 52,064 | -71,004 | 18,940 |
| – Gross Longs: | 88,591 | 61,399 | 31,524 |
| – Gross Shorts: | 36,527 | 132,403 | 12,584 |
| – Long to Short Ratio: | 2.4 to 1 | 0.5 to 1 | 2.5 to 1 |
| NET POSITION TREND: | |||
| – COT Index Score (3 Year Range Pct): | 75.8 | 25.8 | 51.4 |
| – COT Index Reading (3 Year Range): | Bullish | Bearish | Bullish |
| NET POSITION MOVEMENT INDEX: | |||
| – 6-Week Change in Strength Index: | 3.9 | -2.1 | -10.5 |
Copper Grade #1 Futures:
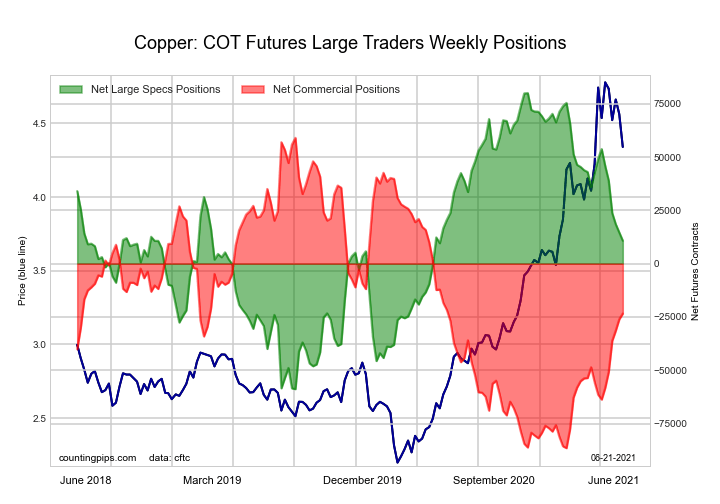 The Copper Grade #1 Futures large speculator standing this week reached a net position of 10,771 contracts in the data reported through Tuesday. This was a weekly fall of -3,864 contracts from the previous week which had a total of 14,635 net contracts.
This week’s current strength score (the trader positioning range over the past three years, measured from 0 to 100) shows the speculators are currently Bullish with a score of 50.1 percent. The commercials are Bearish with a score of 43.4 percent and the small traders (not shown in chart) are Bullish-Extreme with a score of 98.4 percent.
| Copper Futures Statistics | SPECULATORS | COMMERCIALS | SMALL TRADERS |
| – Percent of Open Interest Longs: | 39.2 | 34.5 | 11.9 |
| – Percent of Open Interest Shorts: | 34.6 | 44.7 | 6.4 |
| – Net Position: | 10,771 | -23,417 | 12,646 |
| – Gross Longs: | 90,209 | 79,272 | 27,369 |
| – Gross Shorts: | 79,438 | 102,689 | 14,723 |
| – Long to Short Ratio: | 1.1 to 1 | 0.8 to 1 | 1.9 to 1 |
| NET POSITION TREND: | |||
| – COT Index Score (3 Year Range Pct): | 50.1 | 43.4 | 98.4 |
| – COT Index Reading (3 Year Range): | Bullish | Bearish | Bullish-Extreme |
| NET POSITION MOVEMENT INDEX: | |||
| – 6-Week Change in Strength Index: | -31.0 | 27.7 | 15.4 |
Platinum Futures:
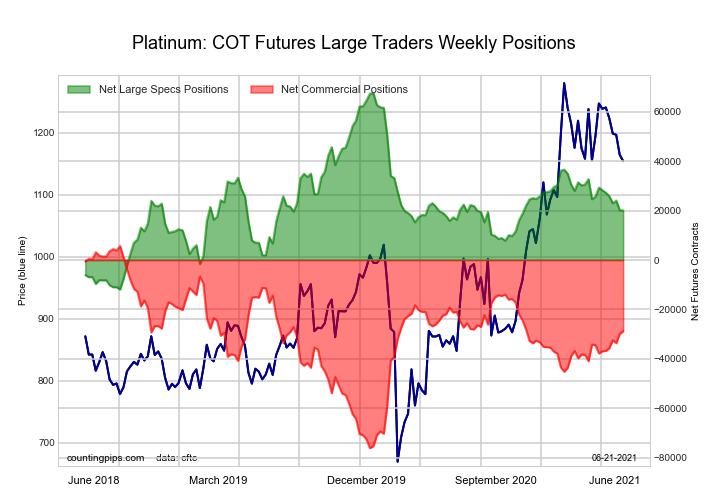 The Platinum Futures large speculator standing this week reached a net position of 20,057 contracts in the data reported through Tuesday. This was a weekly decline of -107 contracts from the previous week which had a total of 20,164 net contracts.
This week’s current strength score (the trader positioning range over the past three years, measured from 0 to 100) shows the speculators are currently Bearish with a score of 40.2 percent. The commercials are Bullish with a score of 57.9 percent and the small traders (not shown in chart) are Bullish-Extreme with a score of 84.1 percent.
| Platinum Futures Statistics | SPECULATORS | COMMERCIALS | SMALL TRADERS |
| – Percent of Open Interest Longs: | 56.5 | 21.7 | 17.3 |
| – Percent of Open Interest Shorts: | 25.7 | 66.0 | 3.8 |
| – Net Position: | 20,057 | -28,799 | 8,742 |
| – Gross Longs: | 36,745 | 14,113 | 11,233 |
| – Gross Shorts: | 16,688 | 42,912 | 2,491 |
| – Long to Short Ratio: | 2.2 to 1 | 0.3 to 1 | 4.5 to 1 |
| NET POSITION TREND: | |||
| – COT Index Score (3 Year Range Pct): | 40.2 | 57.9 | 84.1 |
| – COT Index Reading (3 Year Range): | Bearish | Bullish | Bullish-Extreme |
| NET POSITION MOVEMENT INDEX: | |||
| – 6-Week Change in Strength Index: | -10.3 | 9.9 | 0.9 |
Palladium Futures:
 The Palladium Futures large speculator standing this week reached a net position of 2,403 contracts in the data reported through Tuesday. This was a weekly lowering of -72 contracts from the previous week which had a total of 2,475 net contracts.
This week’s current strength score (the trader positioning range over the past three years, measured from 0 to 100) shows the speculators are currently Bearish-Extreme with a score of 14.4 percent. The commercials are Bullish with a score of 79.7 percent and the small traders (not shown in chart) are Bullish-Extreme with a score of 96.1 percent.
| Palladium Futures Statistics | SPECULATORS | COMMERCIALS | SMALL TRADERS |
| – Percent of Open Interest Longs: | 57.0 | 25.8 | 15.0 |
| – Percent of Open Interest Shorts: | 34.7 | 56.2 | 6.9 |
| – Net Position: | 2,403 | -3,276 | 873 |
| – Gross Longs: | 6,131 | 2,770 | 1,617 |
| – Gross Shorts: | 3,728 | 6,046 | 744 |
| – Long to Short Ratio: | 1.6 to 1 | 0.5 to 1 | 2.2 to 1 |
| NET POSITION TREND: | |||
| – COT Index Score (3 Year Range Pct): | 14.4 | 79.7 | 96.1 |
| – COT Index Reading (3 Year Range): | Bearish-Extreme | Bullish | Bullish-Extreme |
| NET POSITION MOVEMENT INDEX: | |||
| – 6-Week Change in Strength Index: | -4.6 | 3.9 | 5.7 |
Article By CountingPips.com – Receive our weekly COT Reports by Email
*COT Report: The COT data, released weekly to the public each Friday, is updated through the most recent Tuesday (data is 3 days old) and shows a quick view of how large speculators or non-commercials (for-profit traders) were positioned in the futures markets.
The CFTC categorizes trader positions according to commercial hedgers (traders who use futures contracts for hedging as part of the business), non-commercials (large traders who speculate to realize trading profits) and nonreportable traders (usually small traders/speculators).
Find CFTC criteria here: (http://www.cftc.gov/MarketReports/CommitmentsofTraders/ExplanatoryNotes/index.htm).

- PMI data is the focus of investors’ attention today. Turkey, Iraq, Qatar, and UAE signed a transportation agreement Apr 23, 2024
- Australian dollar rises on strong economic indicators Apr 23, 2024
- Geopolitical risks in the Middle East are declining. China kept interest rates at lows Apr 22, 2024
- Brent crude dips to four-week low amid easing geopolitical tensions Apr 22, 2024
- COT Metals Charts: Speculator bets led by Copper & Silver Apr 20, 2024
- COT Bonds Charts: Speculator bets led by 10-Year Bonds & Fed Funds Apr 20, 2024
- COT Stock Market Charts: Speculator bets led by S&P500-Mini Apr 20, 2024
- COT Soft Commodities Charts: Speculator bets led by Soybean Meal & Lean Hogs Apr 20, 2024
- 3 Signs of Developing U.S. Economic Slowdown Apr 19, 2024
- Israel has retaliated against Iran. Investors run to safe assets Apr 19, 2024