
By CountingPips.com COT Home | Data Tables | Data Downloads | Newsletter
Here are the latest charts and statistics for the Commitment of Traders (COT) data published by the Commodities Futures Trading Commission (CFTC).
The latest COT data is updated through Tuesday June 22 2021 and shows a quick view of how large traders (for-profit speculators and commercial entities) were positioned in the futures markets.
WTI Crude Oil Futures :
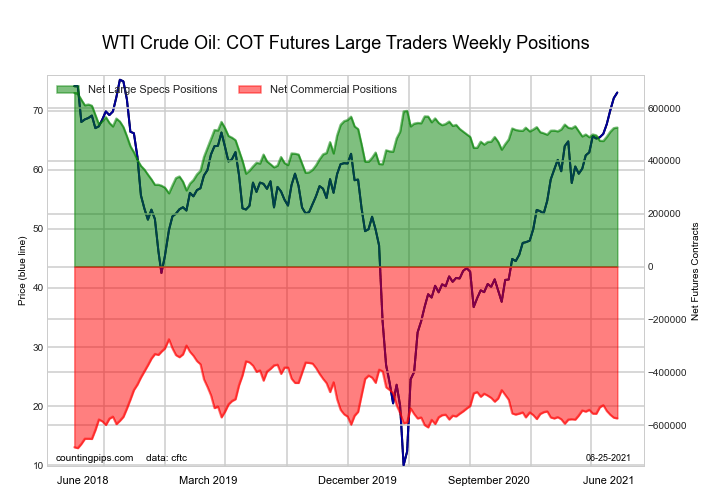 The WTI Crude Oil Futures large speculator standing this week came in at a net position of 526,161 contracts in the data reported through Tuesday. This was a weekly rise of 2,205 contracts from the previous week which had a total of 523,956 net contracts.
This week’s current strength score (the trader positioning range over the past three years, measured from 0 to 100) shows the speculators are currently Bullish with a score of 65.6 percent. The commercials are Bearish with a score of 27.4 percent and the small traders (not shown in chart) are Bullish-Extreme with a score of 83.1 percent.
| WTI Crude Oil Futures Statistics | SPECULATORS | COMMERCIALS | SMALL TRADERS |
| – Percent of Open Interest Longs: | 28.5 | 32.4 | 4.4 |
| – Percent of Open Interest Shorts: | 6.1 | 56.8 | 2.3 |
| – Net Position: | 526,161 | -574,438 | 48,277 |
| – Gross Longs: | 669,980 | 759,883 | 102,600 |
| – Gross Shorts: | 143,819 | 1,334,321 | 54,323 |
| – Long to Short Ratio: | 4.7 to 1 | 0.6 to 1 | 1.9 to 1 |
| NET POSITION TREND: | |||
| – COT Index Score (3 Year Range Pct): | 65.6 | 27.4 | 83.1 |
| – COT Index Reading (3 Year Range): | Bullish | Bearish | Bullish-Extreme |
| NET POSITION MOVEMENT INDEX: | |||
| – 6-Week Change in Strength Index: | 7.8 | -4.3 | -16.9 |
Free Reports:
 Sign Up for Our Stock Market Newsletter – Get updated on News, Charts & Rankings of Public Companies when you join our Stocks Newsletter
 Get our Weekly Commitment of Traders Reports - See where the biggest traders (Hedge Funds and Commercial Hedgers) are positioned in the futures markets on a weekly basis.
Brent Crude Oil Futures :
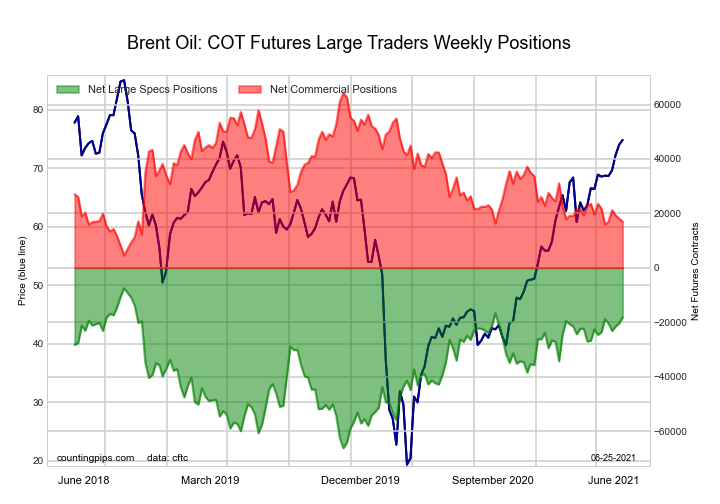 The Brent Crude Oil Futures large speculator standing this week came in at a net position of -18,167 contracts in the data reported through Tuesday. This was a weekly increase of 2,187 contracts from the previous week which had a total of -20,354 net contracts.
This week’s current strength score (the trader positioning range over the past three years, measured from 0 to 100) shows the speculators are currently Bullish-Extreme with a score of 81.7 percent. The commercials are Bearish with a score of 20.8 percent and the small traders (not shown in chart) are Bearish with a score of 46.0 percent.
| Brent Crude Oil Futures Statistics | SPECULATORS | COMMERCIALS | SMALL TRADERS |
| – Percent of Open Interest Longs: | 18.8 | 47.9 | 3.9 |
| – Percent of Open Interest Shorts: | 27.6 | 39.6 | 3.3 |
| – Net Position: | -18,167 | 16,958 | 1,209 |
| – Gross Longs: | 38,712 | 98,713 | 8,069 |
| – Gross Shorts: | 56,879 | 81,755 | 6,860 |
| – Long to Short Ratio: | 0.7 to 1 | 1.2 to 1 | 1.2 to 1 |
| NET POSITION TREND: | |||
| – COT Index Score (3 Year Range Pct): | 81.7 | 20.8 | 46.0 |
| – COT Index Reading (3 Year Range): | Bullish-Extreme | Bearish | Bearish |
| NET POSITION MOVEMENT INDEX: | |||
| – 6-Week Change in Strength Index: | 9.2 | -8.0 | -5.4 |
Natural Gas Futures :
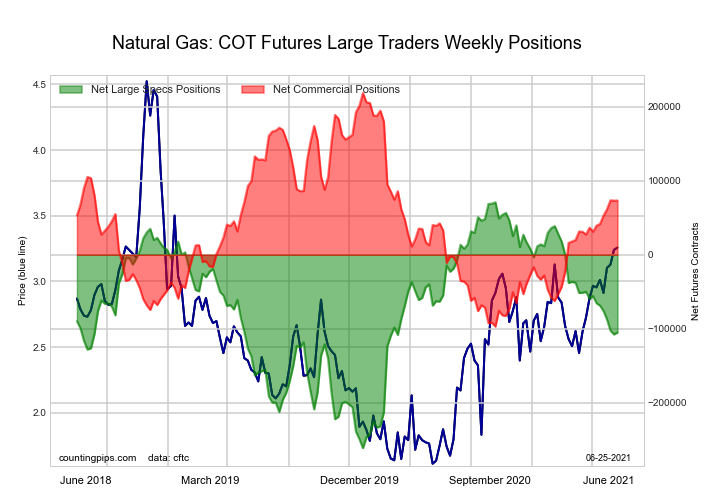 The Natural Gas Futures large speculator standing this week came in at a net position of -105,098 contracts in the data reported through Tuesday. This was a weekly advance of 2,598 contracts from the previous week which had a total of -107,696 net contracts.
This week’s current strength score (the trader positioning range over the past three years, measured from 0 to 100) shows the speculators are currently Bearish with a score of 47.0 percent. The commercials are Bullish with a score of 54.0 percent and the small traders (not shown in chart) are Bearish with a score of 48.9 percent.
| Natural Gas Futures Statistics | SPECULATORS | COMMERCIALS | SMALL TRADERS |
| – Percent of Open Interest Longs: | 26.6 | 41.7 | 4.7 |
| – Percent of Open Interest Shorts: | 34.7 | 36.1 | 2.3 |
| – Net Position: | -105,098 | 73,341 | 31,757 |
| – Gross Longs: | 345,041 | 540,929 | 61,081 |
| – Gross Shorts: | 450,139 | 467,588 | 29,324 |
| – Long to Short Ratio: | 0.8 to 1 | 1.2 to 1 | 2.1 to 1 |
| NET POSITION TREND: | |||
| – COT Index Score (3 Year Range Pct): | 47.0 | 54.0 | 48.9 |
| – COT Index Reading (3 Year Range): | Bearish | Bullish | Bearish |
| NET POSITION MOVEMENT INDEX: | |||
| – 6-Week Change in Strength Index: | -11.9 | 10.7 | 18.0 |
Gasoline Blendstock Futures :
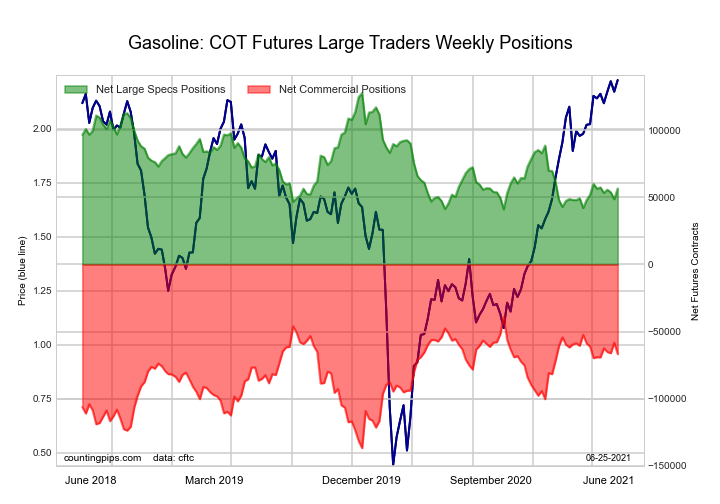 The Gasoline Blendstock Futures large speculator standing this week came in at a net position of 56,558 contracts in the data reported through Tuesday. This was a weekly increase of 7,915 contracts from the previous week which had a total of 48,643 net contracts.
This week’s current strength score (the trader positioning range over the past three years, measured from 0 to 100) shows the speculators are currently Bearish-Extreme with a score of 17.8 percent. The commercials are Bullish with a score of 71.8 percent and the small traders (not shown in chart) are Bullish with a score of 72.9 percent.
| Nasdaq Mini Futures Statistics | SPECULATORS | COMMERCIALS | SMALL TRADERS |
| – Percent of Open Interest Longs: | 22.9 | 50.8 | 5.7 |
| – Percent of Open Interest Shorts: | 9.5 | 66.7 | 3.3 |
| – Net Position: | 56,558 | -66,819 | 10,261 |
| – Gross Longs: | 96,346 | 213,277 | 24,140 |
| – Gross Shorts: | 39,788 | 280,096 | 13,879 |
| – Long to Short Ratio: | 2.4 to 1 | 0.8 to 1 | 1.7 to 1 |
| NET POSITION TREND: | |||
| – COT Index Score (3 Year Range Pct): | 17.8 | 71.8 | 72.9 |
| – COT Index Reading (3 Year Range): | Bearish-Extreme | Bullish | Bullish |
| NET POSITION MOVEMENT INDEX: | |||
| – 6-Week Change in Strength Index: | 0.1 | 2.3 | -13.7 |
#2 Heating Oil NY-Harbor Futures :
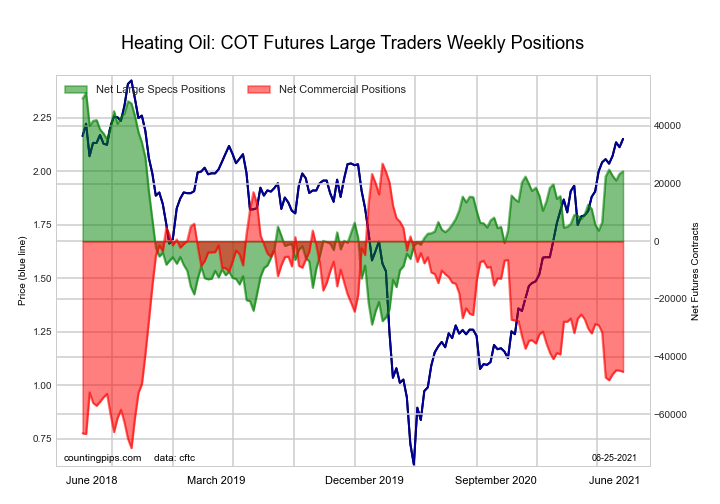 The #2 Heating Oil NY-Harbor Futures large speculator standing this week came in at a net position of 24,219 contracts in the data reported through Tuesday. This was a weekly increase of 824 contracts from the previous week which had a total of 23,395 net contracts.
This week’s current strength score (the trader positioning range over the past three years, measured from 0 to 100) shows the speculators are currently Bullish with a score of 66.2 percent. The commercials are Bearish with a score of 26.8 percent and the small traders (not shown in chart) are Bullish-Extreme with a score of 82.4 percent.
| Heating Oil Futures Statistics | SPECULATORS | COMMERCIALS | SMALL TRADERS |
| – Percent of Open Interest Longs: | 16.8 | 50.4 | 11.5 |
| – Percent of Open Interest Shorts: | 11.2 | 60.9 | 6.6 |
| – Net Position: | 24,219 | -45,201 | 20,982 |
| – Gross Longs: | 72,337 | 216,815 | 49,487 |
| – Gross Shorts: | 48,118 | 262,016 | 28,505 |
| – Long to Short Ratio: | 1.5 to 1 | 0.8 to 1 | 1.7 to 1 |
| NET POSITION TREND: | |||
| – COT Index Score (3 Year Range Pct): | 66.2 | 26.8 | 82.4 |
| – COT Index Reading (3 Year Range): | Bullish | Bearish | Bullish-Extreme |
| NET POSITION MOVEMENT INDEX: | |||
| – 6-Week Change in Strength Index: | 22.1 | -13.8 | -16.3 |
Bloomberg Commodity Index Futures :
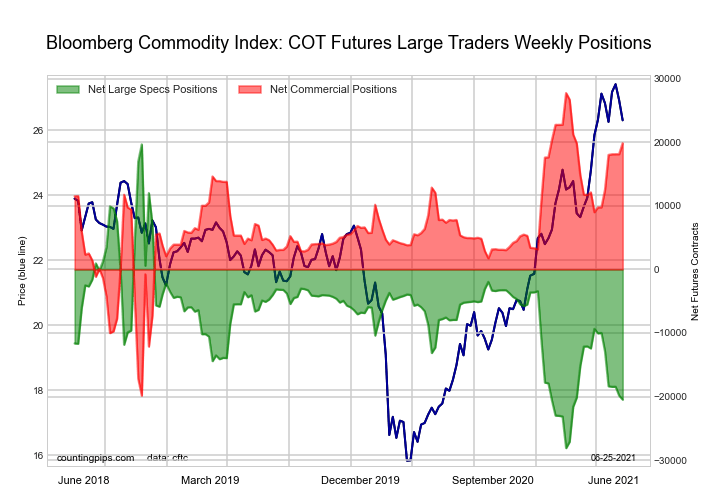 The Bloomberg Commodity Index Futures large speculator standing this week came in at a net position of -20,482 contracts in the data reported through Tuesday. This was a weekly decrease of -633 contracts from the previous week which had a total of -19,849 net contracts.
This week’s current strength score (the trader positioning range over the past three years, measured from 0 to 100) shows the speculators are currently Bearish-Extreme with a score of 16.0 percent. The commercials are Bullish-Extreme with a score of 83.4 percent and the small traders (not shown in chart) are Bullish with a score of 51.8 percent.
| Bloomberg Index Futures Statistics | SPECULATORS | COMMERCIALS | SMALL TRADERS |
| – Percent of Open Interest Longs: | 48.0 | 50.4 | 1.6 |
| – Percent of Open Interest Shorts: | 92.4 | 7.4 | 0.2 |
| – Net Position: | -20,482 | 19,856 | 626 |
| – Gross Longs: | 22,163 | 23,256 | 729 |
| – Gross Shorts: | 42,645 | 3,400 | 103 |
| – Long to Short Ratio: | 0.5 to 1 | 6.8 to 1 | 7.1 to 1 |
| NET POSITION TREND: | |||
| – COT Index Score (3 Year Range Pct): | 16.0 | 83.4 | 51.8 |
| – COT Index Reading (3 Year Range): | Bearish-Extreme | Bullish-Extreme | Bullish |
| NET POSITION MOVEMENT INDEX: | |||
| – 6-Week Change in Strength Index: | -22.0 | 21.2 | 17.8 |
Article By CountingPips.com – Receive our weekly COT Reports by Email
*COT Report: The COT data, released weekly to the public each Friday, is updated through the most recent Tuesday (data is 3 days old) and shows a quick view of how large speculators or non-commercials (for-profit traders) were positioned in the futures markets.
The CFTC categorizes trader positions according to commercial hedgers (traders who use futures contracts for hedging as part of the business), non-commercials (large traders who speculate to realize trading profits) and nonreportable traders (usually small traders/speculators).
Find CFTC criteria here: (http://www.cftc.gov/MarketReports/CommitmentsofTraders/ExplanatoryNotes/index.htm).

- Geopolitical risks in the Middle East are declining. China kept interest rates at lows Apr 22, 2024
- Brent crude dips to four-week low amid easing geopolitical tensions Apr 22, 2024
- COT Metals Charts: Speculator bets led by Copper & Silver Apr 20, 2024
- COT Bonds Charts: Speculator bets led by 10-Year Bonds & Fed Funds Apr 20, 2024
- COT Stock Market Charts: Speculator bets led by S&P500-Mini Apr 20, 2024
- COT Soft Commodities Charts: Speculator bets led by Soybean Meal & Lean Hogs Apr 20, 2024
- 3 Signs of Developing U.S. Economic Slowdown Apr 19, 2024
- Israel has retaliated against Iran. Investors run to safe assets Apr 19, 2024
- Gold hits record high amid growing geopolitical tensions Apr 19, 2024
- The US natural gas prices fell to a 2-month low. A drop in the technology sector on Wednesday had a negative impact on the broad market Apr 18, 2024