
By CountingPips.com COT Home | Data Tables | Data Downloads | Newsletter
Here are the latest charts and statistics for the Commitment of Traders (COT) data published by the Commodities Futures Trading Commission (CFTC).
The latest COT data is updated through Tuesday June 01 2021 and shows a quick view of how large traders (for-profit speculators and commercial entities) were positioned in the futures markets.
3-Month Eurodollars Futures:
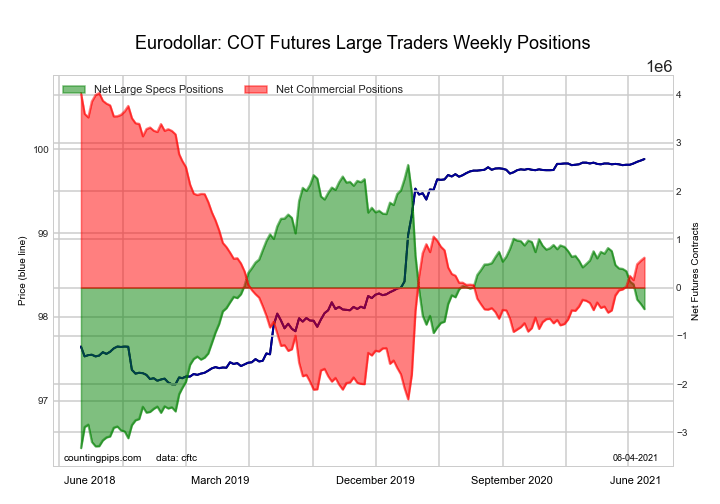
The 3-Month Eurodollars large speculator standing this week came in at a net position of -445,507 contracts in the data reported through Tuesday. This was a weekly fall of -108,100 contracts from the previous week which had a total of -337,407 net contracts.
This week’s current strength score (the trader positioning range over the past three years, measured from 0 to 100) shows the speculators are currently Bearish with a score of 49.1 percent. The commercials are Bearish with a score of 46.2 percent and the small traders (not shown in chart) are Bullish-Extreme with a score of 80.1 percent.
Free Reports:
 Download Our Metatrader 4 Indicators – Put Our Free MetaTrader 4 Custom Indicators on your charts when you join our Weekly Newsletter
 Get our Weekly Commitment of Traders Reports - See where the biggest traders (Hedge Funds and Commercial Hedgers) are positioned in the futures markets on a weekly basis.
| 3-Month Eurodollars Statistics | SPECULATORS | COMMERCIALS | SMALL TRADERS |
| – Percent of Open Interest Longs: | 20.6 | 50.7 | 5.2 |
| – Percent of Open Interest Shorts: | 23.9 | 46.1 | 6.5 |
| – Net Position: | -445,507 | 619,608 | -174,101 |
| – Gross Longs: | 2,761,407 | 6,800,787 | 691,108 |
| – Gross Shorts: | 3,206,914 | 6,181,179 | 865,209 |
| – Long to Short Ratio: | 0.9 to 1 | 1.1 to 1 | 0.8 to 1 |
| NET POSITION TREND: | |||
| – COT Index Score (3 Year Range Pct): | 49.1 | 46.2 | 80.1 |
| – COT Index Reading (3 Year Range): | Bearish | Bearish | Bullish-Extreme |
| NET POSITION MOVEMENT INDEX: | |||
| – 6-Week Change in Strength Index: | -14.2 | 10.3 | 22.8 |
30-Day Federal Funds Futures:
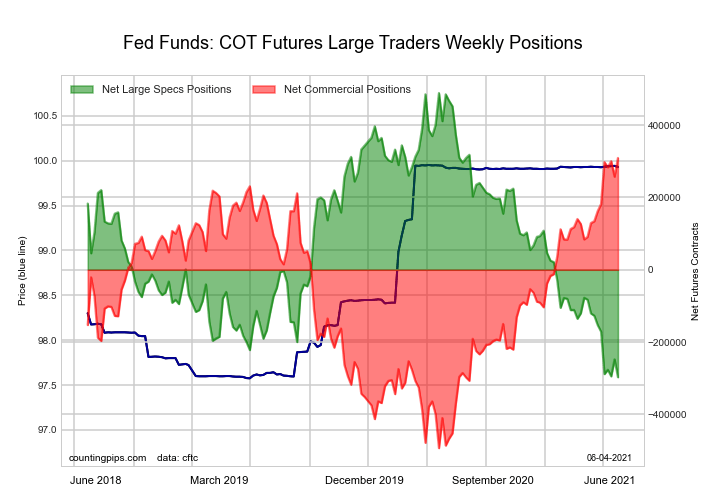
The 30-Day Federal Funds large speculator standing this week came in at a net position of -297,178 contracts in the data reported through Tuesday. This was a weekly lowering of -49,219 contracts from the previous week which had a total of -247,959 net contracts.
This week’s current strength score (the trader positioning range over the past three years, measured from 0 to 100) shows the speculators are currently Bearish-Extreme with a score of 0.0 percent. The commercials are Bullish-Extreme with a score of 100.0 percent and the small traders (not shown in chart) are Bearish with a score of 49.0 percent.
| 30-Day Federal Funds Statistics | SPECULATORS | COMMERCIALS | SMALL TRADERS |
| – Percent of Open Interest Longs: | 2.1 | 79.0 | 1.8 |
| – Percent of Open Interest Shorts: | 31.6 | 48.3 | 3.0 |
| – Net Position: | -297,178 | 309,334 | -12,156 |
| – Gross Longs: | 21,501 | 796,543 | 18,208 |
| – Gross Shorts: | 318,679 | 487,209 | 30,364 |
| – Long to Short Ratio: | 0.1 to 1 | 1.6 to 1 | 0.6 to 1 |
| NET POSITION TREND: | |||
| – COT Index Score (3 Year Range Pct): | 0.0 | 100.0 | 49.0 |
| – COT Index Reading (3 Year Range): | Bearish-Extreme | Bullish-Extreme | Bearish |
| NET POSITION MOVEMENT INDEX: | |||
| – 6-Week Change in Strength Index: | -18.4 | 18.3 | -5.4 |
2-Year Treasury Note Futures:
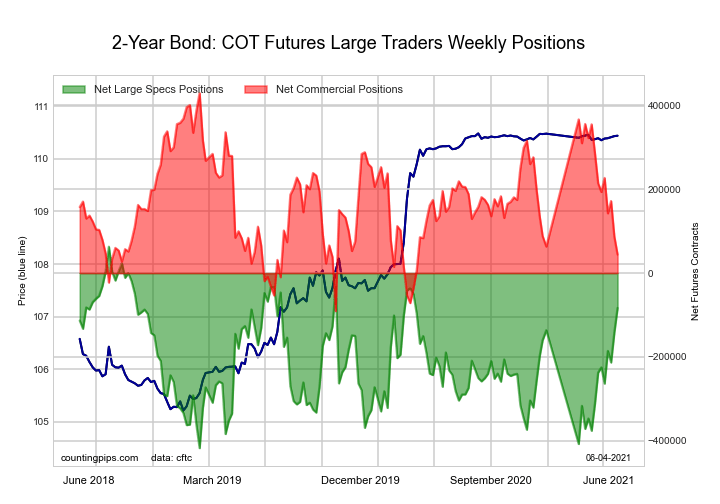
The 2-Year Treasury Note large speculator standing this week came in at a net position of -83,061 contracts in the data reported through Tuesday. This was a weekly boost of 58,816 contracts from the previous week which had a total of -141,877 net contracts.
This week’s current strength score (the trader positioning range over the past three years, measured from 0 to 100) shows the speculators are currently Bullish with a score of 75.8 percent. The commercials are Bearish with a score of 25.9 percent and the small traders (not shown in chart) are Bullish with a score of 55.4 percent.
| 2-Year Treasury Note Statistics | SPECULATORS | COMMERCIALS | SMALL TRADERS |
| – Percent of Open Interest Longs: | 23.5 | 67.5 | 6.9 |
| – Percent of Open Interest Shorts: | 27.2 | 65.5 | 5.2 |
| – Net Position: | -83,061 | 44,148 | 38,913 |
| – Gross Longs: | 530,011 | 1,522,220 | 156,707 |
| – Gross Shorts: | 613,072 | 1,478,072 | 117,794 |
| – Long to Short Ratio: | 0.9 to 1 | 1.0 to 1 | 1.3 to 1 |
| NET POSITION TREND: | |||
| – COT Index Score (3 Year Range Pct): | 75.8 | 25.9 | 55.4 |
| – COT Index Reading (3 Year Range): | Bullish | Bearish | Bullish |
| NET POSITION MOVEMENT INDEX: | |||
| – 6-Week Change in Strength Index: | 35.0 | -32.8 | 8.4 |
5-Year Treasury Note Futures:
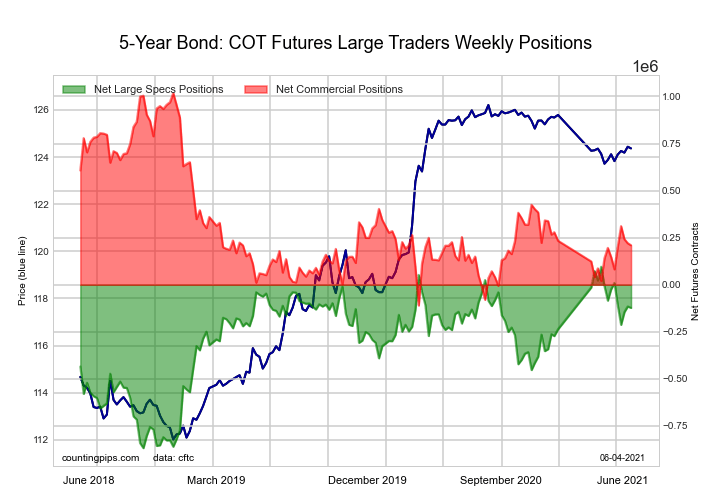
The 5-Year Treasury Note large speculator standing this week came in at a net position of -122,702 contracts in the data reported through Tuesday. This was a weekly lowering of -6,987 contracts from the previous week which had a total of -115,715 net contracts.
This week’s current strength score (the trader positioning range over the past three years, measured from 0 to 100) shows the speculators are currently Bullish with a score of 77.4 percent. The commercials are Bearish with a score of 28.3 percent and the small traders (not shown in chart) are Bearish with a score of 31.3 percent.
| 5-Year Treasury Note Statistics | SPECULATORS | COMMERCIALS | SMALL TRADERS |
| – Percent of Open Interest Longs: | 12.1 | 77.3 | 8.7 |
| – Percent of Open Interest Shorts: | 15.6 | 71.4 | 11.1 |
| – Net Position: | -122,702 | 209,541 | -86,839 |
| – Gross Longs: | 422,839 | 2,707,722 | 303,216 |
| – Gross Shorts: | 545,541 | 2,498,181 | 390,055 |
| – Long to Short Ratio: | 0.8 to 1 | 1.1 to 1 | 0.8 to 1 |
| NET POSITION TREND: | |||
| – COT Index Score (3 Year Range Pct): | 77.4 | 28.3 | 31.3 |
| – COT Index Reading (3 Year Range): | Bullish | Bearish | Bearish |
| NET POSITION MOVEMENT INDEX: | |||
| – 6-Week Change in Strength Index: | -10.2 | 5.6 | 15.7 |
10-Year Treasury Note Futures:

The 10-Year Treasury Note large speculator standing this week came in at a net position of 54,844 contracts in the data reported through Tuesday. This was a weekly fall of -49,554 contracts from the previous week which had a total of 104,398 net contracts.
This week’s current strength score (the trader positioning range over the past three years, measured from 0 to 100) shows the speculators are currently Bullish-Extreme with a score of 89.3 percent. The commercials are Bearish with a score of 38.0 percent and the small traders (not shown in chart) are Bearish-Extreme with a score of 3.9 percent.
| 10-Year Treasury Note Statistics | SPECULATORS | COMMERCIALS | SMALL TRADERS |
| – Percent of Open Interest Longs: | 21.2 | 69.5 | 7.3 |
| – Percent of Open Interest Shorts: | 20.0 | 64.7 | 13.3 |
| – Net Position: | 54,844 | 210,157 | -265,001 |
| – Gross Longs: | 928,118 | 3,042,242 | 318,455 |
| – Gross Shorts: | 873,274 | 2,832,085 | 583,456 |
| – Long to Short Ratio: | 1.1 to 1 | 1.1 to 1 | 0.5 to 1 |
| NET POSITION TREND: | |||
| – COT Index Score (3 Year Range Pct): | 89.3 | 38.0 | 3.9 |
| – COT Index Reading (3 Year Range): | Bullish-Extreme | Bearish | Bearish-Extreme |
| NET POSITION MOVEMENT INDEX: | |||
| – 6-Week Change in Strength Index: | 4.3 | -1.3 | -6.9 |
Ultra 10-Year Notes Futures:
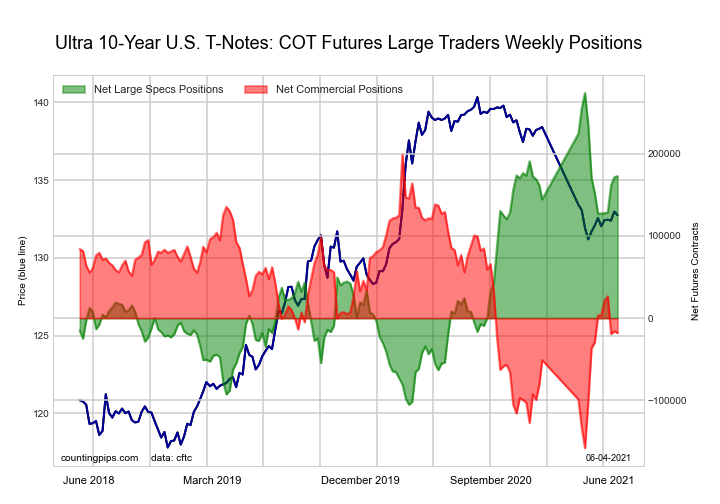
The Ultra 10-Year Notes large speculator standing this week came in at a net position of 172,621 contracts in the data reported through Tuesday. This was a weekly lift of 1,299 contracts from the previous week which had a total of 171,322 net contracts.
This week’s current strength score (the trader positioning range over the past three years, measured from 0 to 100) shows the speculators are currently Bullish with a score of 73.3 percent. The commercials are Bearish with a score of 39.2 percent and the small traders (not shown in chart) are Bearish-Extreme with a score of 0.7 percent.
| Ultra 10-Year Notes Statistics | SPECULATORS | COMMERCIALS | SMALL TRADERS |
| – Percent of Open Interest Longs: | 20.3 | 68.7 | 7.2 |
| – Percent of Open Interest Shorts: | 9.9 | 69.8 | 16.5 |
| – Net Position: | 172,621 | -18,004 | -154,617 |
| – Gross Longs: | 336,069 | 1,140,281 | 119,944 |
| – Gross Shorts: | 163,448 | 1,158,285 | 274,561 |
| – Long to Short Ratio: | 2.1 to 1 | 1.0 to 1 | 0.4 to 1 |
| NET POSITION TREND: | |||
| – COT Index Score (3 Year Range Pct): | 73.3 | 39.2 | 0.7 |
| – COT Index Reading (3 Year Range): | Bullish | Bearish | Bearish-Extreme |
| NET POSITION MOVEMENT INDEX: | |||
| – 6-Week Change in Strength Index: | 12.0 | -6.0 | -18.6 |
US Treasury Bonds Futures:
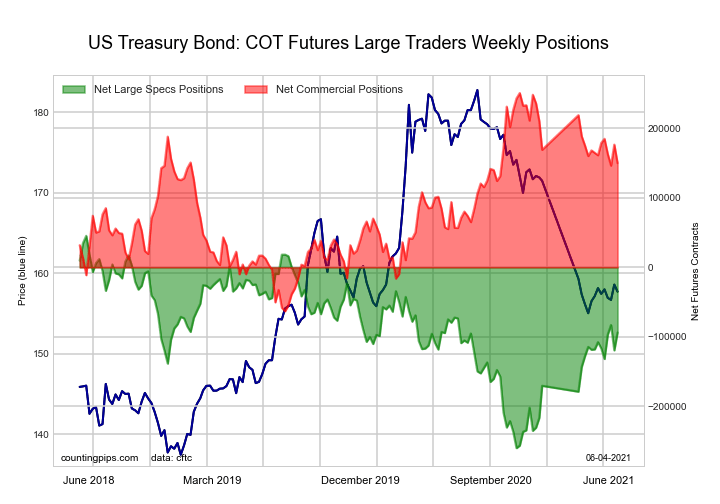
The US Treasury Bonds large speculator standing this week came in at a net position of -93,767 contracts in the data reported through Tuesday. This was a weekly boost of 25,586 contracts from the previous week which had a total of -119,353 net contracts.
This week’s current strength score (the trader positioning range over the past three years, measured from 0 to 100) shows the speculators are currently Bullish with a score of 59.7 percent. The commercials are Bullish with a score of 67.9 percent and the small traders (not shown in chart) are Bearish-Extreme with a score of 8.0 percent.
| US Treasury Bonds Statistics | SPECULATORS | COMMERCIALS | SMALL TRADERS |
| – Percent of Open Interest Longs: | 8.3 | 76.0 | 12.9 |
| – Percent of Open Interest Shorts: | 16.2 | 63.4 | 17.7 |
| – Net Position: | -93,767 | 149,914 | -56,147 |
| – Gross Longs: | 99,179 | 906,672 | 154,418 |
| – Gross Shorts: | 192,946 | 756,758 | 210,565 |
| – Long to Short Ratio: | 0.5 to 1 | 1.2 to 1 | 0.7 to 1 |
| NET POSITION TREND: | |||
| – COT Index Score (3 Year Range Pct): | 59.7 | 67.9 | 8.0 |
| – COT Index Reading (3 Year Range): | Bullish | Bullish | Bearish-Extreme |
| NET POSITION MOVEMENT INDEX: | |||
| – 6-Week Change in Strength Index: | 5.0 | -3.6 | -1.9 |
Ultra US Treasury Bonds Futures:
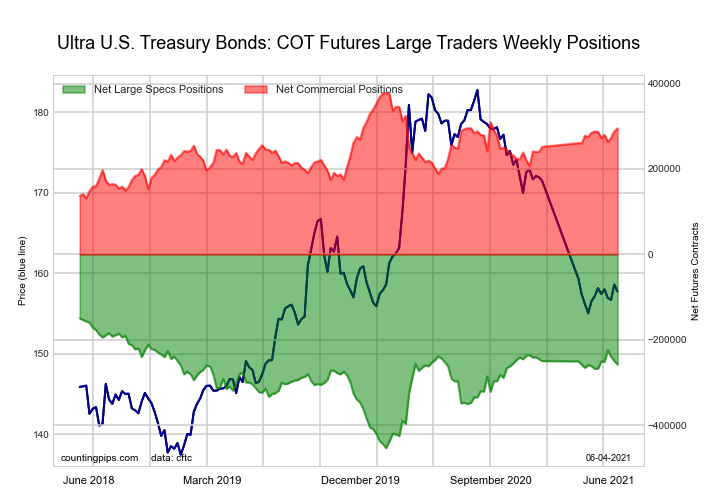
The Ultra US Treasury Bonds large speculator standing this week came in at a net position of -258,231 contracts in the data reported through Tuesday. This was a weekly fall of -8,597 contracts from the previous week which had a total of -249,634 net contracts.
This week’s current strength score (the trader positioning range over the past three years, measured from 0 to 100) shows the speculators are currently Bullish with a score of 73.0 percent. The commercials are Bullish with a score of 63.7 percent and the small traders (not shown in chart) are Bearish-Extreme with a score of 1.7 percent.
| Ultra US Treasury Bonds Statistics | SPECULATORS | COMMERCIALS | SMALL TRADERS |
| – Percent of Open Interest Longs: | 6.2 | 81.5 | 10.9 |
| – Percent of Open Interest Shorts: | 27.9 | 56.7 | 14.1 |
| – Net Position: | -258,231 | 295,258 | -37,027 |
| – Gross Longs: | 73,428 | 968,999 | 130,064 |
| – Gross Shorts: | 331,659 | 673,741 | 167,091 |
| – Long to Short Ratio: | 0.2 to 1 | 1.4 to 1 | 0.8 to 1 |
| NET POSITION TREND: | |||
| – COT Index Score (3 Year Range Pct): | 73.0 | 63.7 | 1.7 |
| – COT Index Reading (3 Year Range): | Bullish | Bullish | Bearish-Extreme |
| NET POSITION MOVEMENT INDEX: | |||
| – 6-Week Change in Strength Index: | 3.6 | 3.6 | -12.8 |
Article By CountingPips.com – Receive our weekly COT Reports by Email
*COT Report: The COT data, released weekly to the public each Friday, is updated through the most recent Tuesday (data is 3 days old) and shows a quick view of how large speculators or non-commercials (for-profit traders) were positioned in the futures markets.
The CFTC categorizes trader positions according to commercial hedgers (traders who use futures contracts for hedging as part of the business), non-commercials (large traders who speculate to realize trading profits) and nonreportable traders (usually small traders/speculators).
Find CFTC criteria here: (http://www.cftc.gov/MarketReports/CommitmentsofTraders/ExplanatoryNotes/index.htm).

- Indices decline amid hawkish comments from the Fed. Investors are waiting for Israel’s answer Apr 17, 2024
- EURGBP: Slams into support on hot UK inflation Apr 17, 2024
- Brent crude prices dip amid concerns over global demand Apr 17, 2024
- Stock indices sell-off amid rising geopolitical tensions in the Middle East. China’s GDP grew the most in a year Apr 16, 2024
- New FXTM commodity hits all-time high! Apr 16, 2024
- NZD hits five-month low against strong US dollar Apr 16, 2024
- Escalating conflict in the Middle East is forcing investors to shift funds to safe assets Apr 15, 2024
- US dollar exhibits remarkable strength amid global tensions Apr 15, 2024
- COT Metals Charts: Speculator bets led higher by Copper & Platinum Apr 13, 2024
- COT Bonds Charts: Speculator Bets led by 10-Year & 5-Year Bonds Apr 13, 2024