
Article By RoboForex.com
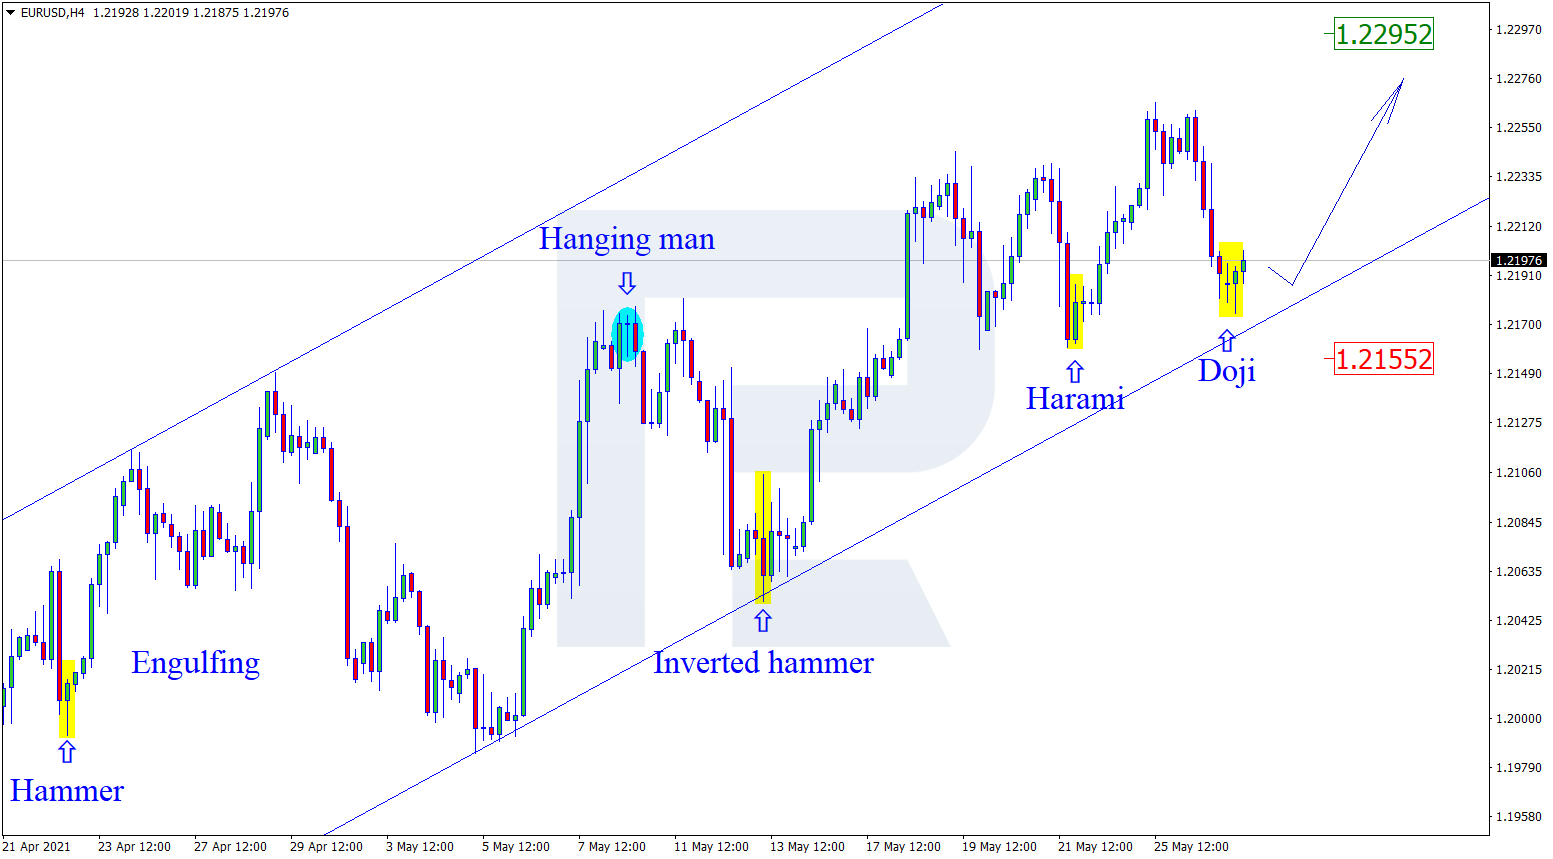
EURUSD, “Euro vs US Dollar”
As we can see in the H4 chart, the uptrend continues. After testing the support area, the pair has formed several reversal patterns, including Doji and Hammer. At the moment, EURUSD may reverse and start a new growth towards the resistance level. In this case, the upside target may be at 1.2295. However, an alternative scenario implies that the price may correct to reach 1.2155 first and then resume growing.

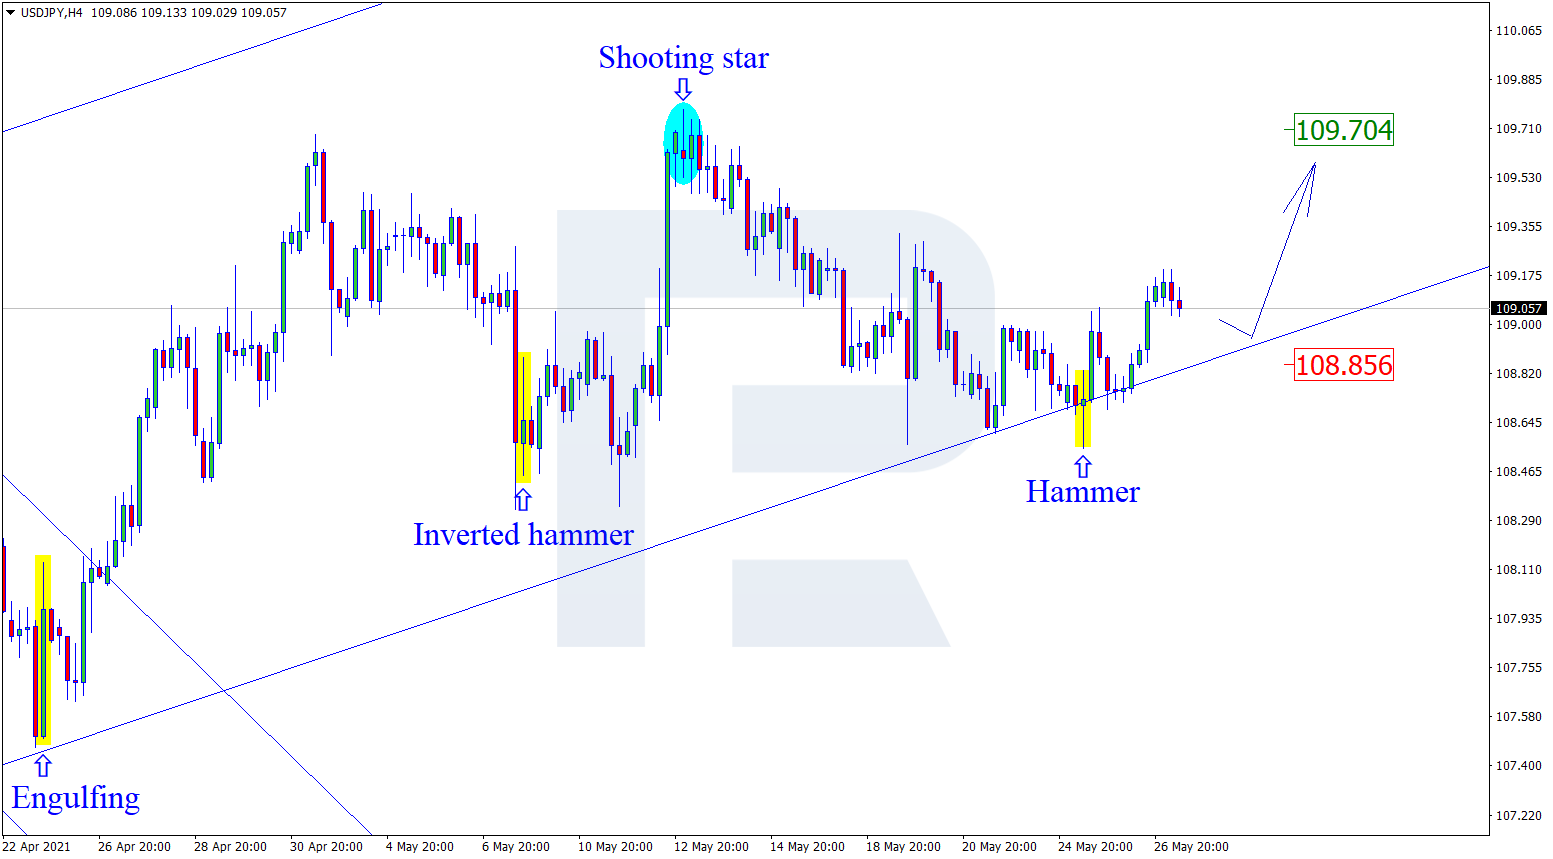
USDJPY, “US Dollar vs Japanese Yen”
As we can see in the H4 chart, USDJPY has formed several reversal patterns, such as Hammer and Harami, not far from the support area. At the moment, the asset is reversing. In this case, the upside target is the resistance level at 109.70. At the same time, an opposite scenario implies that the price may start a new pullback towards 108.85 before resuming its ascending tendency.
Free Reports:
 Download Our Metatrader 4 Indicators – Put Our Free MetaTrader 4 Custom Indicators on your charts when you join our Weekly Newsletter
 Get our Weekly Commitment of Traders Reports - See where the biggest traders (Hedge Funds and Commercial Hedgers) are positioned in the futures markets on a weekly basis.
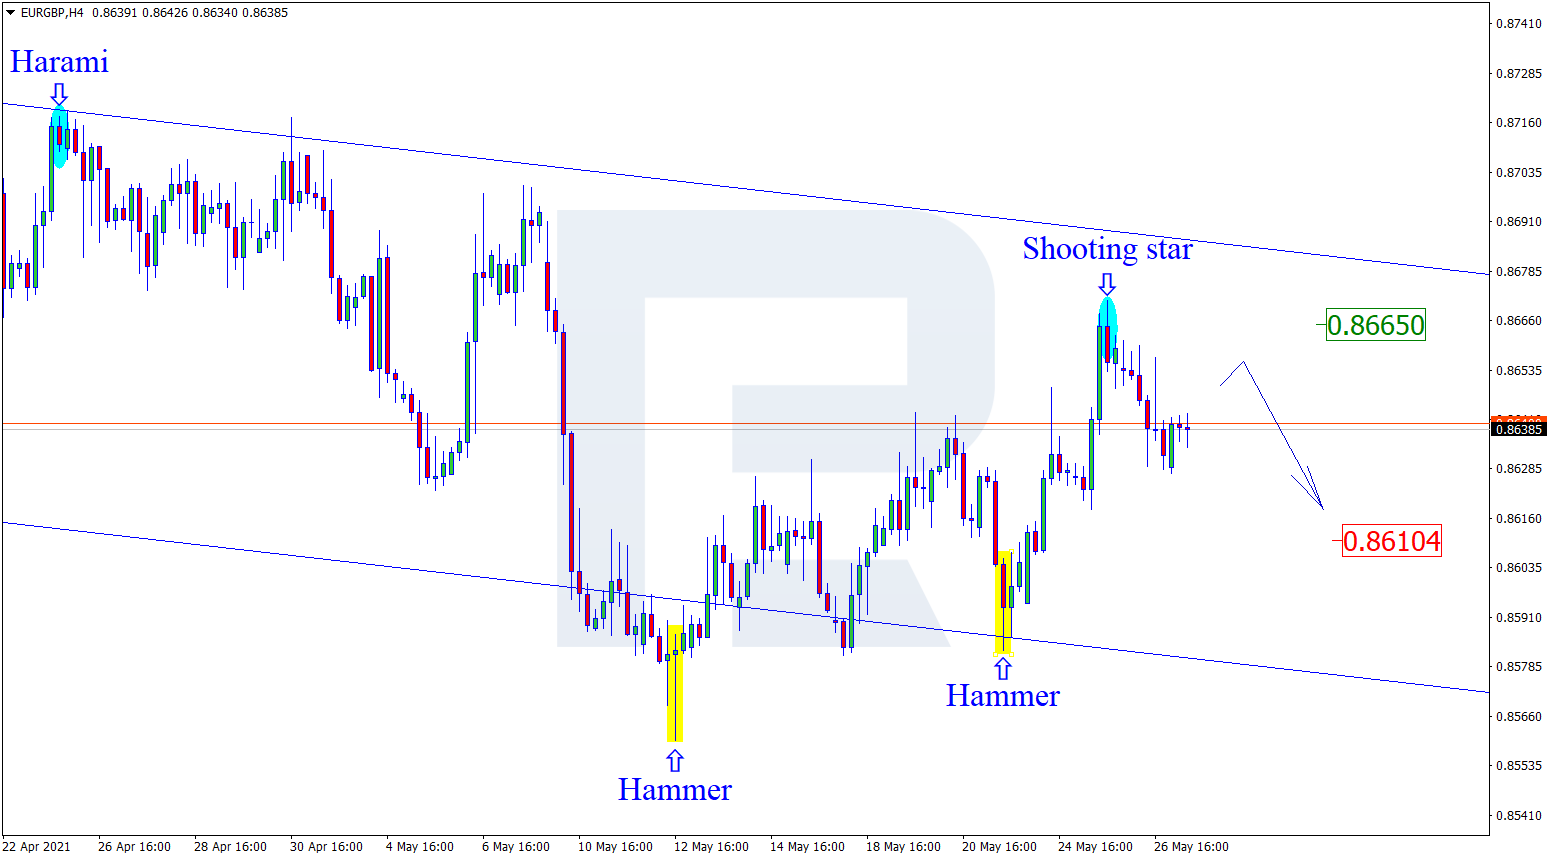
EURGBP, “Euro vs Great Britain Pound”
As we can see in the H4 chart, after forming several reversal patterns, such as Shooting Star, close to the resistance area, EURGBP may reverse and fall to reach the support level. In this case, the downside target may be at 0.8610. Later, the market may break this level and continue falling. Still, there might be an alternative scenario, according to which the asset may correct to reach 0.8565 first and then resume trading downwards.
Article By RoboForex.com
Attention!
Forecasts presented in this section only reflect the author’s private opinion and should not be considered as guidance for trading. RoboForex LP bears no responsibility for trading results based on trading recommendations described in these analytical reviews.

- Geopolitical risks in the Middle East are declining. China kept interest rates at lows Apr 22, 2024
- Brent crude dips to four-week low amid easing geopolitical tensions Apr 22, 2024
- COT Metals Charts: Speculator bets led by Copper & Silver Apr 20, 2024
- COT Bonds Charts: Speculator bets led by 10-Year Bonds & Fed Funds Apr 20, 2024
- COT Stock Market Charts: Speculator bets led by S&P500-Mini Apr 20, 2024
- COT Soft Commodities Charts: Speculator bets led by Soybean Meal & Lean Hogs Apr 20, 2024
- 3 Signs of Developing U.S. Economic Slowdown Apr 19, 2024
- Israel has retaliated against Iran. Investors run to safe assets Apr 19, 2024
- Gold hits record high amid growing geopolitical tensions Apr 19, 2024
- The US natural gas prices fell to a 2-month low. A drop in the technology sector on Wednesday had a negative impact on the broad market Apr 18, 2024