
By CountingPips.com COT Home | Data Tables | Data Downloads | Newsletter
Here are the latest charts and statistics for the Commitment of Traders (COT) data published by the Commodities Futures Trading Commission (CFTC).
The latest COT data is updated through Tuesday May 04 2021 and shows a quick view of how large traders (for-profit speculators and commercial entities) were positioned in the futures markets.
CORN Futures:
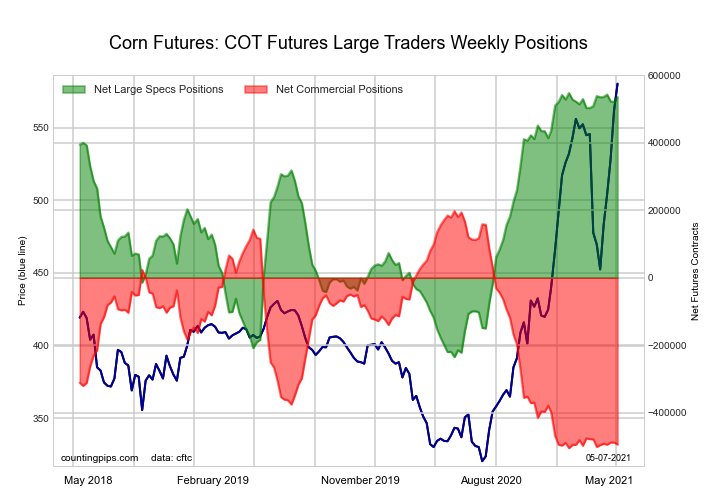
The CORN large speculator standing this week totaled a net position of 536,146 contracts in the data reported through Tuesday. This was a weekly increase of 14,583 contracts from the previous week which had a total of 521,563 net contracts.
This week’s current strength score (the trader positioning range over the past three years, measured from 0 to 100) shows the speculators are currently Bullish-Extreme with a score of 98.5 percent. The commercials are Bearish-Extreme with a score of 1.5 percent and the small traders (not shown in chart) are Bearish with a score of 22.4 percent.
| CORN Futures Statistics | SPECULATORS | COMMERCIALS | SMALL TRADERS |
| – Percent of Open Interest Longs: | 36.5 | 43.9 | 8.5 |
| – Percent of Open Interest Shorts: | 4.4 | 73.5 | 11.1 |
| – Net Position: | 536,146 | -494,161 | -41,985 |
| – Gross Longs: | 609,370 | 733,292 | 142,725 |
| – Gross Shorts: | 73,224 | 1,227,453 | 184,710 |
| – Long to Short Ratio: | 8.3 to 1 | 0.6 to 1 | 0.8 to 1 |
| NET POSITION TREND: | |||
| – COT Index Score (3 Year Range Pct): | 98.5 | 1.5 | 22.4 |
| – COT Index Reading (3 Year Range): | Bullish-Extreme | Bearish-Extreme | Bearish |
| NET POSITION MOVEMENT INDEX: | |||
| – 6-Week Change in Strength Index: | -0.3 | 1.0 | -2.5 |
Free Reports:
 Sign Up for Our Stock Market Newsletter – Get updated on News, Charts & Rankings of Public Companies when you join our Stocks Newsletter
 Get our Weekly Commitment of Traders Reports - See where the biggest traders (Hedge Funds and Commercial Hedgers) are positioned in the futures markets on a weekly basis.
SUGAR Futures:
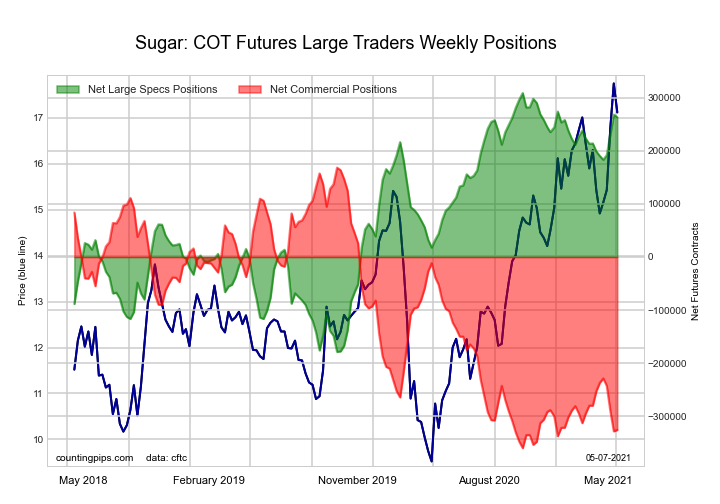
The SUGAR large speculator standing this week totaled a net position of 263,046 contracts in the data reported through Tuesday. This was a weekly reduction of -4,722 contracts from the previous week which had a total of 267,768 net contracts.
This week’s current strength score (the trader positioning range over the past three years, measured from 0 to 100) shows the speculators are currently Bullish-Extreme with a score of 90.7 percent. The commercials are Bearish-Extreme with a score of 6.5 percent and the small traders (not shown in chart) are Bullish-Extreme with a score of 84.8 percent.
| SUGAR Futures Statistics | SPECULATORS | COMMERCIALS | SMALL TRADERS |
| – Percent of Open Interest Longs: | 30.8 | 46.4 | 9.7 |
| – Percent of Open Interest Shorts: | 4.3 | 79.2 | 3.4 |
| – Net Position: | 263,046 | -325,330 | 62,284 |
| – Gross Longs: | 306,207 | 460,897 | 95,813 |
| – Gross Shorts: | 43,161 | 786,227 | 33,529 |
| – Long to Short Ratio: | 7.1 to 1 | 0.6 to 1 | 2.9 to 1 |
| NET POSITION TREND: | |||
| – COT Index Score (3 Year Range Pct): | 90.7 | 6.5 | 84.8 |
| – COT Index Reading (3 Year Range): | Bullish-Extreme | Bearish-Extreme | Bullish-Extreme |
| NET POSITION MOVEMENT INDEX: | |||
| – 6-Week Change in Strength Index: | 13.2 | -13.8 | 10.5 |
COFFEE Futures:
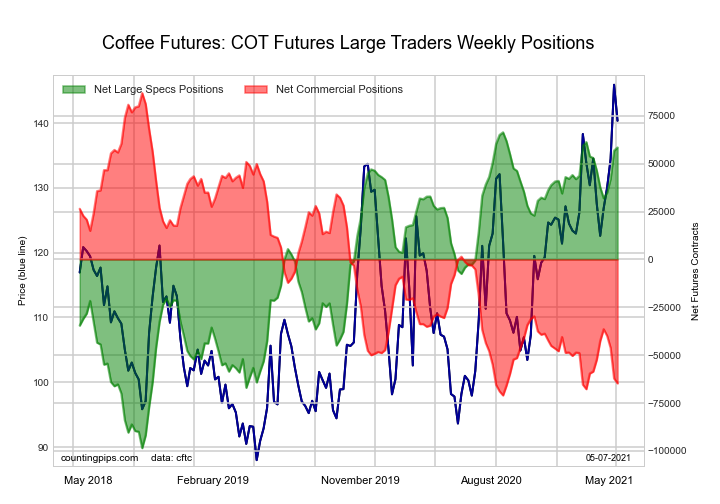
The COFFEE large speculator standing this week totaled a net position of 58,434 contracts in the data reported through Tuesday. This was a weekly lift of 1,625 contracts from the previous week which had a total of 56,809 net contracts.
This week’s current strength score (the trader positioning range over the past three years, measured from 0 to 100) shows the speculators are currently Bullish-Extreme with a score of 95.2 percent. The commercials are Bearish-Extreme with a score of 4.0 percent and the small traders (not shown in chart) are Bearish with a score of 31.6 percent.
| COFFEE Futures Statistics | SPECULATORS | COMMERCIALS | SMALL TRADERS |
| – Percent of Open Interest Longs: | 28.2 | 46.3 | 4.3 |
| – Percent of Open Interest Shorts: | 7.6 | 69.1 | 2.1 |
| – Net Position: | 58,434 | -64,683 | 6,249 |
| – Gross Longs: | 79,953 | 131,477 | 12,204 |
| – Gross Shorts: | 21,519 | 196,160 | 5,955 |
| – Long to Short Ratio: | 3.7 to 1 | 0.7 to 1 | 2.0 to 1 |
| NET POSITION TREND: | |||
| – COT Index Score (3 Year Range Pct): | 95.2 | 4.0 | 31.6 |
| – COT Index Reading (3 Year Range): | Bullish-Extreme | Bearish-Extreme | Bearish |
| NET POSITION MOVEMENT INDEX: | |||
| – 6-Week Change in Strength Index: | 7.3 | -7.8 | 2.2 |
SOYBEANS Futures:
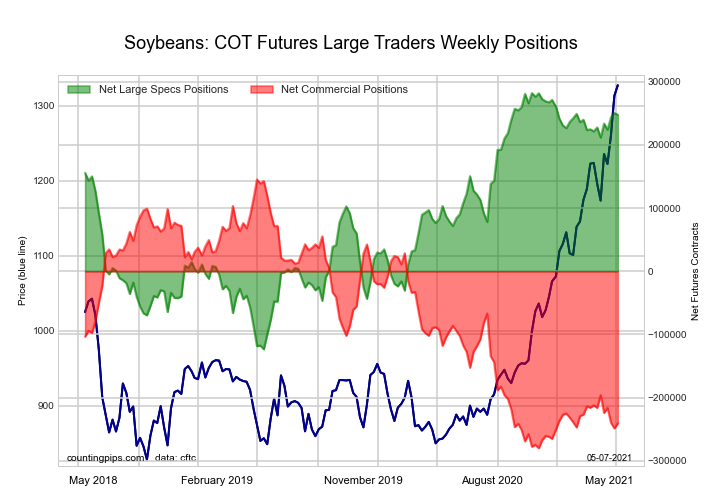
The SOYBEANS large speculator standing this week totaled a net position of 247,587 contracts in the data reported through Tuesday. This was a weekly decrease of -3,046 contracts from the previous week which had a total of 250,633 net contracts.
This week’s current strength score (the trader positioning range over the past three years, measured from 0 to 100) shows the speculators are currently Bullish-Extreme with a score of 91.5 percent. The commercials are Bearish-Extreme with a score of 9.2 percent and the small traders (not shown in chart) are Bullish with a score of 65.7 percent.
| SOYBEANS Futures Statistics | SPECULATORS | COMMERCIALS | SMALL TRADERS |
| – Percent of Open Interest Longs: | 37.5 | 41.9 | 7.5 |
| – Percent of Open Interest Shorts: | 6.8 | 71.7 | 8.4 |
| – Net Position: | 247,587 | -240,671 | -6,916 |
| – Gross Longs: | 302,464 | 338,066 | 60,811 |
| – Gross Shorts: | 54,877 | 578,737 | 67,727 |
| – Long to Short Ratio: | 5.5 to 1 | 0.6 to 1 | 0.9 to 1 |
| NET POSITION TREND: | |||
| – COT Index Score (3 Year Range Pct): | 91.5 | 9.2 | 65.7 |
| – COT Index Reading (3 Year Range): | Bullish-Extreme | Bearish-Extreme | Bullish |
| NET POSITION MOVEMENT INDEX: | |||
| – 6-Week Change in Strength Index: | 4.9 | -5.8 | 6.8 |
SOYBEAN OIL Futures:
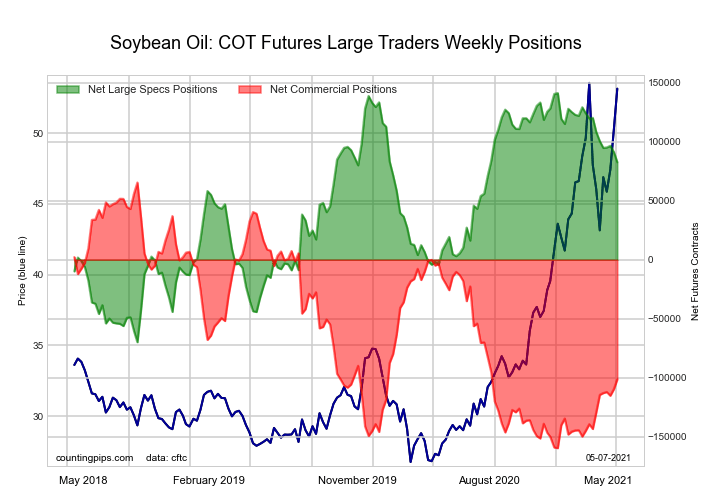
The SOYBEAN OIL large speculator standing this week totaled a net position of 82,607 contracts in the data reported through Tuesday. This was a weekly decline of -8,682 contracts from the previous week which had a total of 91,289 net contracts.
This week’s current strength score (the trader positioning range over the past three years, measured from 0 to 100) shows the speculators are currently Bullish with a score of 72.2 percent. The commercials are Bearish with a score of 25.9 percent and the small traders (not shown in chart) are Bullish-Extreme with a score of 83.2 percent.
| SOYBEAN OIL Futures Statistics | SPECULATORS | COMMERCIALS | SMALL TRADERS |
| – Percent of Open Interest Longs: | 25.4 | 48.7 | 8.6 |
| – Percent of Open Interest Shorts: | 8.4 | 69.6 | 4.8 |
| – Net Position: | 82,607 | -101,311 | 18,704 |
| – Gross Longs: | 123,495 | 236,540 | 41,870 |
| – Gross Shorts: | 40,888 | 337,851 | 23,166 |
| – Long to Short Ratio: | 3.0 to 1 | 0.7 to 1 | 1.8 to 1 |
| NET POSITION TREND: | |||
| – COT Index Score (3 Year Range Pct): | 72.2 | 25.9 | 83.2 |
| – COT Index Reading (3 Year Range): | Bullish | Bearish | Bullish-Extreme |
| NET POSITION MOVEMENT INDEX: | |||
| – 6-Week Change in Strength Index: | -12.0 | 12.4 | -9.1 |
SOYBEAN MEAL Futures:
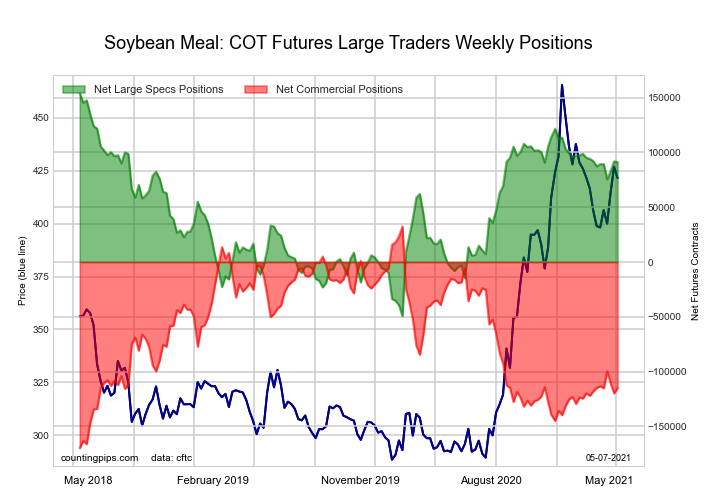
The SOYBEAN MEAL large speculator standing this week totaled a net position of 91,103 contracts in the data reported through Tuesday. This was a weekly lowering of -822 contracts from the previous week which had a total of 91,925 net contracts.
This week’s current strength score (the trader positioning range over the past three years, measured from 0 to 100) shows the speculators are currently Bullish with a score of 69.0 percent. The commercials are Bearish with a score of 27.1 percent and the small traders (not shown in chart) are Bullish with a score of 66.4 percent.
| SOYBEAN MEAL Futures Statistics | SPECULATORS | COMMERCIALS | SMALL TRADERS |
| – Percent of Open Interest Longs: | 26.3 | 48.4 | 11.6 |
| – Percent of Open Interest Shorts: | 3.7 | 76.8 | 5.7 |
| – Net Position: | 91,103 | -114,992 | 23,889 |
| – Gross Longs: | 106,265 | 195,988 | 47,078 |
| – Gross Shorts: | 15,162 | 310,980 | 23,189 |
| – Long to Short Ratio: | 7.0 to 1 | 0.6 to 1 | 2.0 to 1 |
| NET POSITION TREND: | |||
| – COT Index Score (3 Year Range Pct): | 69.0 | 27.1 | 66.4 |
| – COT Index Reading (3 Year Range): | Bullish | Bearish | Bullish |
| NET POSITION MOVEMENT INDEX: | |||
| – 6-Week Change in Strength Index: | 1.8 | -0.1 | -13.7 |
LIVE CATTLE Futures:
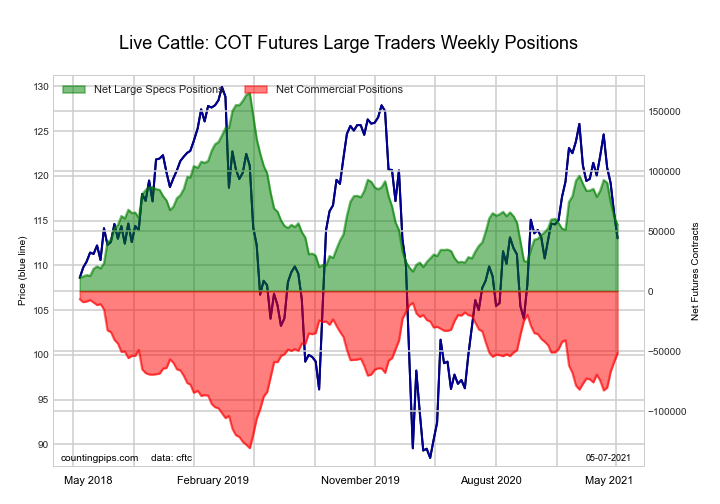
The LIVE CATTLE large speculator standing this week totaled a net position of 55,429 contracts in the data reported through Tuesday. This was a weekly decrease of -6,825 contracts from the previous week which had a total of 62,254 net contracts.
This week’s current strength score (the trader positioning range over the past three years, measured from 0 to 100) shows the speculators are currently Bearish with a score of 28.7 percent. The commercials are Bullish with a score of 63.9 percent and the small traders (not shown in chart) are Bullish with a score of 77.6 percent.
| LIVE CATTLE Futures Statistics | SPECULATORS | COMMERCIALS | SMALL TRADERS |
| – Percent of Open Interest Longs: | 36.6 | 37.8 | 10.0 |
| – Percent of Open Interest Shorts: | 19.2 | 53.9 | 11.2 |
| – Net Position: | 55,429 | -51,517 | -3,912 |
| – Gross Longs: | 116,956 | 121,023 | 31,849 |
| – Gross Shorts: | 61,527 | 172,540 | 35,761 |
| – Long to Short Ratio: | 1.9 to 1 | 0.7 to 1 | 0.9 to 1 |
| NET POSITION TREND: | |||
| – COT Index Score (3 Year Range Pct): | 28.7 | 63.9 | 77.6 |
| – COT Index Reading (3 Year Range): | Bearish | Bullish | Bullish |
| NET POSITION MOVEMENT INDEX: | |||
| – 6-Week Change in Strength Index: | -15.1 | 14.5 | 12.7 |
LEAN HOGS Futures:
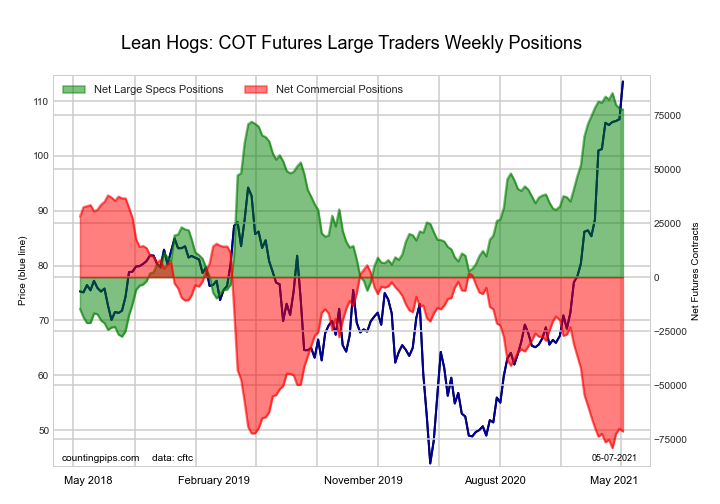
The LEAN HOGS large speculator standing this week totaled a net position of 77,582 contracts in the data reported through Tuesday. This was a weekly reduction of -480 contracts from the previous week which had a total of 78,062 net contracts.
This week’s current strength score (the trader positioning range over the past three years, measured from 0 to 100) shows the speculators are currently Bullish-Extreme with a score of 93.2 percent. The commercials are Bearish-Extreme with a score of 6.6 percent and the small traders (not shown in chart) are Bearish with a score of 48.2 percent.
| LEAN HOGS Futures Statistics | SPECULATORS | COMMERCIALS | SMALL TRADERS |
| – Percent of Open Interest Longs: | 38.9 | 29.3 | 9.1 |
| – Percent of Open Interest Shorts: | 12.5 | 53.5 | 11.2 |
| – Net Position: | 77,582 | -71,369 | -6,213 |
| – Gross Longs: | 114,305 | 85,995 | 26,662 |
| – Gross Shorts: | 36,723 | 157,364 | 32,875 |
| – Long to Short Ratio: | 3.1 to 1 | 0.5 to 1 | 0.8 to 1 |
| NET POSITION TREND: | |||
| – COT Index Score (3 Year Range Pct): | 93.2 | 6.6 | 48.2 |
| – COT Index Reading (3 Year Range): | Bullish-Extreme | Bearish-Extreme | Bearish |
| NET POSITION MOVEMENT INDEX: | |||
| – 6-Week Change in Strength Index: | -2.8 | 0.9 | 10.1 |
COTTON Futures:

The COTTON large speculator standing this week totaled a net position of 83,314 contracts in the data reported through Tuesday. This was a weekly reduction of -2,139 contracts from the previous week which had a total of 85,453 net contracts.
This week’s current strength score (the trader positioning range over the past three years, measured from 0 to 100) shows the speculators are currently Bullish with a score of 73.4 percent. The commercials are Bearish with a score of 26.7 percent and the small traders (not shown in chart) are Bullish with a score of 63.8 percent.
| COTTON Futures Statistics | SPECULATORS | COMMERCIALS | SMALL TRADERS |
| – Percent of Open Interest Longs: | 41.3 | 41.1 | 7.3 |
| – Percent of Open Interest Shorts: | 3.7 | 82.7 | 3.4 |
| – Net Position: | 83,314 | -92,076 | 8,762 |
| – Gross Longs: | 91,391 | 90,853 | 16,227 |
| – Gross Shorts: | 8,077 | 182,929 | 7,465 |
| – Long to Short Ratio: | 11.3 to 1 | 0.5 to 1 | 2.2 to 1 |
| NET POSITION TREND: | |||
| – COT Index Score (3 Year Range Pct): | 73.4 | 26.7 | 63.8 |
| – COT Index Reading (3 Year Range): | Bullish | Bearish | Bullish |
| NET POSITION MOVEMENT INDEX: | |||
| – 6-Week Change in Strength Index: | 0.2 | -0.3 | 1.3 |
COCOA Futures:
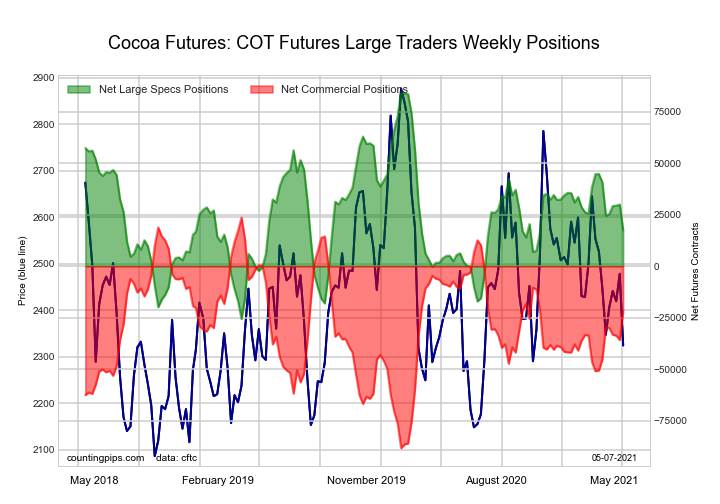
The COCOA large speculator standing this week totaled a net position of 17,396 contracts in the data reported through Tuesday. This was a weekly decrease of -12,572 contracts from the previous week which had a total of 29,968 net contracts.
This week’s current strength score (the trader positioning range over the past three years, measured from 0 to 100) shows the speculators are currently Bearish with a score of 39.2 percent. The commercials are Bullish with a score of 59.1 percent and the small traders (not shown in chart) are Bullish with a score of 62.1 percent.
| COCOA Futures Statistics | SPECULATORS | COMMERCIALS | SMALL TRADERS |
| – Percent of Open Interest Longs: | 30.0 | 45.8 | 5.6 |
| – Percent of Open Interest Shorts: | 21.5 | 56.7 | 3.3 |
| – Net Position: | 17,396 | -22,107 | 4,711 |
| – Gross Longs: | 61,200 | 93,417 | 11,487 |
| – Gross Shorts: | 43,804 | 115,524 | 6,776 |
| – Long to Short Ratio: | 1.4 to 1 | 0.8 to 1 | 1.7 to 1 |
| NET POSITION TREND: | |||
| – COT Index Score (3 Year Range Pct): | 39.2 | 59.1 | 62.1 |
| – COT Index Reading (3 Year Range): | Bearish | Bullish | Bullish |
| NET POSITION MOVEMENT INDEX: | |||
| – 6-Week Change in Strength Index: | -21.2 | 20.6 | 2.0 |
WHEAT Futures:
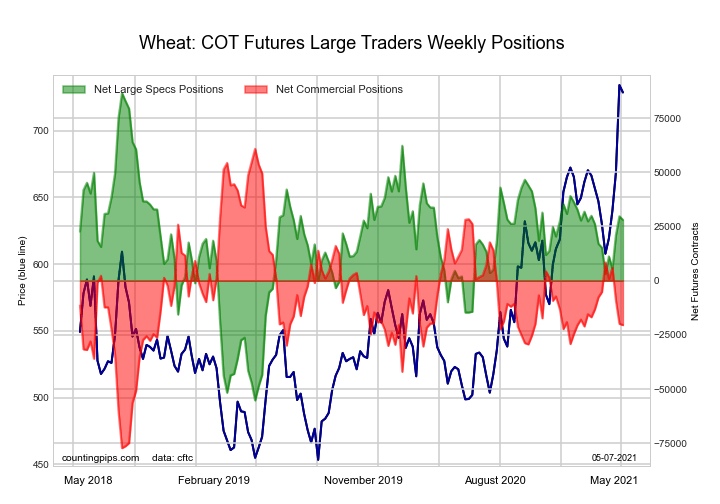
The WHEAT large speculator standing this week totaled a net position of 28,040 contracts in the data reported through Tuesday. This was a weekly lowering of -1,664 contracts from the previous week which had a total of 29,704 net contracts.
This week’s current strength score (the trader positioning range over the past three years, measured from 0 to 100) shows the speculators are currently Bullish with a score of 58.7 percent. The commercials are Bearish with a score of 41.1 percent and the small traders (not shown in chart) are Bullish with a score of 65.2 percent.
| WHEAT Futures Statistics | SPECULATORS | COMMERCIALS | SMALL TRADERS |
| – Percent of Open Interest Longs: | 32.6 | 34.8 | 7.1 |
| – Percent of Open Interest Shorts: | 25.9 | 39.7 | 8.9 |
| – Net Position: | 28,040 | -20,432 | -7,608 |
| – Gross Longs: | 137,015 | 146,180 | 29,852 |
| – Gross Shorts: | 108,975 | 166,612 | 37,460 |
| – Long to Short Ratio: | 1.3 to 1 | 0.9 to 1 | 0.8 to 1 |
| NET POSITION TREND: | |||
| – COT Index Score (3 Year Range Pct): | 58.7 | 41.1 | 65.2 |
| – COT Index Reading (3 Year Range): | Bullish | Bearish | Bullish |
| NET POSITION MOVEMENT INDEX: | |||
| – 6-Week Change in Strength Index: | 9.0 | -11.1 | 11.8 |
Article By CountingPips.com – Receive our weekly COT Reports by Email
*COT Report: The COT data, released weekly to the public each Friday, is updated through the most recent Tuesday (data is 3 days old) and shows a quick view of how large speculators or non-commercials (for-profit traders) were positioned in the futures markets.
The CFTC categorizes trader positions according to commercial hedgers (traders who use futures contracts for hedging as part of the business), non-commercials (large traders who speculate to realize trading profits) and nonreportable traders (usually small traders/speculators).
Find CFTC criteria here: (http://www.cftc.gov/MarketReports/CommitmentsofTraders/ExplanatoryNotes/index.htm).

- 3 Signs of Developing U.S. Economic Slowdown Apr 19, 2024
- Israel has retaliated against Iran. Investors run to safe assets Apr 19, 2024
- Gold hits record high amid growing geopolitical tensions Apr 19, 2024
- The US natural gas prices fell to a 2-month low. A drop in the technology sector on Wednesday had a negative impact on the broad market Apr 18, 2024
- Target Thursdays: Cocoa, Bitcoin and USDCHF hit targets! Apr 18, 2024
- British Pound shows signs of recovery amid favourable inflation data Apr 18, 2024
- Indices decline amid hawkish comments from the Fed. Investors are waiting for Israel’s answer Apr 17, 2024
- EURGBP: Slams into support on hot UK inflation Apr 17, 2024
- Brent crude prices dip amid concerns over global demand Apr 17, 2024
- Stock indices sell-off amid rising geopolitical tensions in the Middle East. China’s GDP grew the most in a year Apr 16, 2024