
By CountingPips.com COT Home | Data Tables | Data Downloads | Newsletter
Here are the latest charts and statistics for the Commitment of Traders (COT) data published by the Commodities Futures Trading Commission (CFTC).
The latest COT data is updated through Tuesday May 25 2021 and shows a quick view of how large traders (for-profit speculators and commercial entities) were positioned in the futures markets.
CORN Futures:
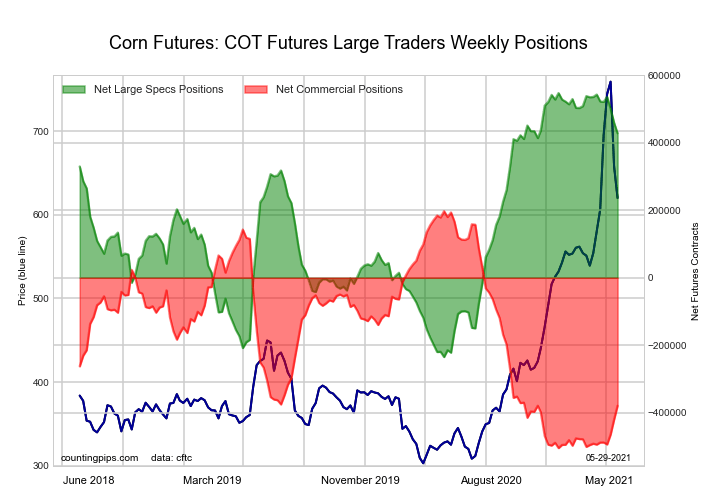
The CORN large speculator standing this week recorded a net position of 428,426 contracts in the data reported through Tuesday. This was a weekly lowering of -31,052 contracts from the previous week which had a total of 459,478 net contracts.
This week’s current strength score (the trader positioning range over the past three years, measured from 0 to 100) shows the speculators are currently Bullish-Extreme with a score of 84.8 percent. The commercials are Bearish-Extreme with a score of 17.9 percent and the small traders (not shown in chart) are Bearish-Extreme with a score of 11.1 percent.
| CORN Futures Statistics | SPECULATORS | COMMERCIALS | SMALL TRADERS |
| – Percent of Open Interest Longs: | 30.1 | 49.2 | 8.1 |
| – Percent of Open Interest Shorts: | 5.2 | 71.3 | 10.9 |
| – Net Position: | 428,426 | -379,469 | -48,957 |
| – Gross Longs: | 518,145 | 846,602 | 138,713 |
| – Gross Shorts: | 89,719 | 1,226,071 | 187,670 |
| – Long to Short Ratio: | 5.8 to 1 | 0.7 to 1 | 0.7 to 1 |
| NET POSITION TREND: | |||
| – COT Index Score (3 Year Range Pct): | 84.8 | 17.9 | 11.1 |
| – COT Index Reading (3 Year Range): | Bullish-Extreme | Bearish-Extreme | Bearish-Extreme |
| NET POSITION MOVEMENT INDEX: | |||
| – 6-Week Change in Strength Index: | -14.7 | 16.4 | -0.2 |
Free Reports:
 Download Our Metatrader 4 Indicators – Put Our Free MetaTrader 4 Custom Indicators on your charts when you join our Weekly Newsletter
 Get our Weekly Commitment of Traders Reports - See where the biggest traders (Hedge Funds and Commercial Hedgers) are positioned in the futures markets on a weekly basis.
SUGAR Futures:
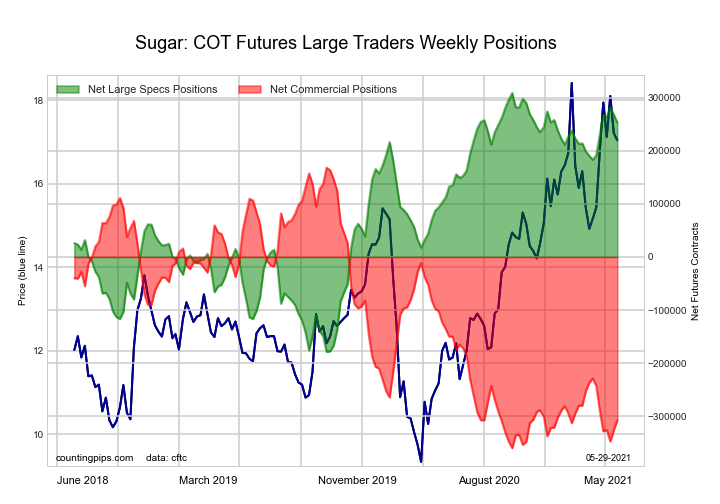
The SUGAR large speculator standing this week recorded a net position of 252,991 contracts in the data reported through Tuesday. This was a weekly decline of -14,843 contracts from the previous week which had a total of 267,834 net contracts.
This week’s current strength score (the trader positioning range over the past three years, measured from 0 to 100) shows the speculators are currently Bullish-Extreme with a score of 88.6 percent. The commercials are Bearish-Extreme with a score of 9.9 percent and the small traders (not shown in chart) are Bullish with a score of 74.7 percent.
| SUGAR Futures Statistics | SPECULATORS | COMMERCIALS | SMALL TRADERS |
| – Percent of Open Interest Longs: | 29.0 | 46.0 | 9.1 |
| – Percent of Open Interest Shorts: | 4.2 | 76.1 | 3.8 |
| – Net Position: | 252,991 | -307,075 | 54,084 |
| – Gross Longs: | 296,225 | 470,088 | 92,683 |
| – Gross Shorts: | 43,234 | 777,163 | 38,599 |
| – Long to Short Ratio: | 6.9 to 1 | 0.6 to 1 | 2.4 to 1 |
| NET POSITION TREND: | |||
| – COT Index Score (3 Year Range Pct): | 88.6 | 9.9 | 74.7 |
| – COT Index Reading (3 Year Range): | Bullish-Extreme | Bearish-Extreme | Bullish |
| NET POSITION MOVEMENT INDEX: | |||
| – 6-Week Change in Strength Index: | 12.6 | -12.2 | 3.8 |
COFFEE Futures:
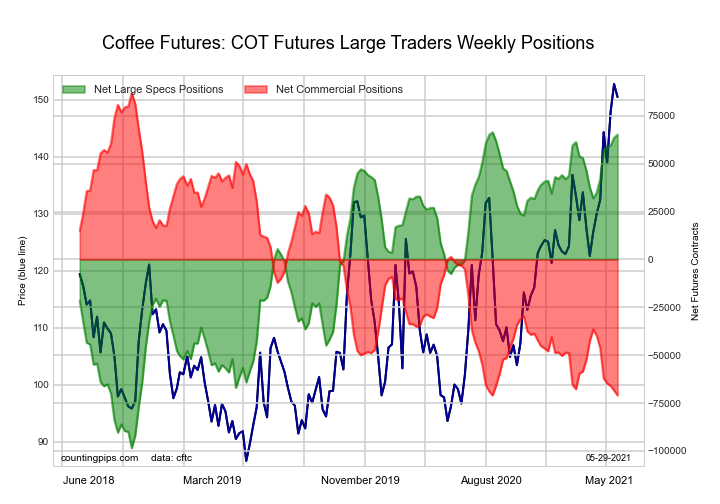
The COFFEE large speculator standing this week recorded a net position of 65,114 contracts in the data reported through Tuesday. This was a weekly lift of 1,641 contracts from the previous week which had a total of 63,473 net contracts.
This week’s current strength score (the trader positioning range over the past three years, measured from 0 to 100) shows the speculators are currently Bullish-Extreme with a score of 99.3 percent. The commercials are Bearish-Extreme with a score of 0.0 percent and the small traders (not shown in chart) are Bearish with a score of 28.5 percent.
| COFFEE Futures Statistics | SPECULATORS | COMMERCIALS | SMALL TRADERS |
| – Percent of Open Interest Longs: | 30.2 | 45.3 | 4.6 |
| – Percent of Open Interest Shorts: | 7.7 | 69.7 | 2.6 |
| – Net Position: | 65,114 | -70,912 | 5,798 |
| – Gross Longs: | 87,383 | 131,127 | 13,194 |
| – Gross Shorts: | 22,269 | 202,039 | 7,396 |
| – Long to Short Ratio: | 3.9 to 1 | 0.6 to 1 | 1.8 to 1 |
| NET POSITION TREND: | |||
| – COT Index Score (3 Year Range Pct): | 99.3 | 0.0 | 28.5 |
| – COT Index Reading (3 Year Range): | Bullish-Extreme | Bearish-Extreme | Bearish |
| NET POSITION MOVEMENT INDEX: | |||
| – 6-Week Change in Strength Index: | 18.4 | -19.6 | 5.2 |
SOYBEANS Futures:
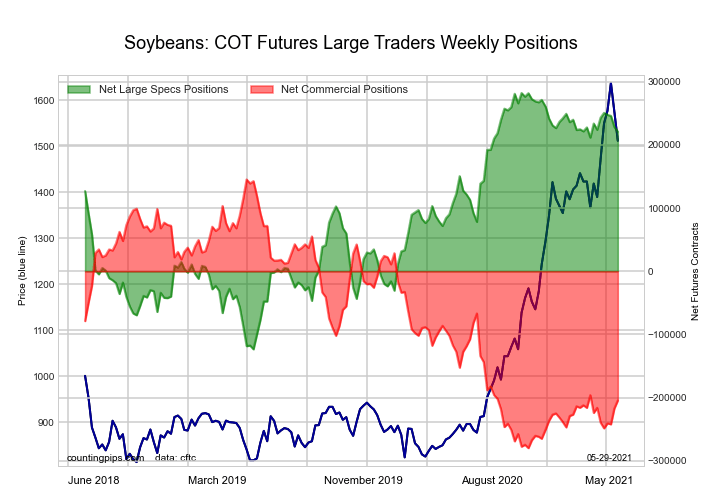
The SOYBEANS large speculator standing this week recorded a net position of 221,055 contracts in the data reported through Tuesday. This was a weekly decline of -7,286 contracts from the previous week which had a total of 228,341 net contracts.
This week’s current strength score (the trader positioning range over the past three years, measured from 0 to 100) shows the speculators are currently Bullish-Extreme with a score of 85.0 percent. The commercials are Bearish-Extreme with a score of 17.7 percent and the small traders (not shown in chart) are Bearish with a score of 48.5 percent.
| SOYBEANS Futures Statistics | SPECULATORS | COMMERCIALS | SMALL TRADERS |
| – Percent of Open Interest Longs: | 34.2 | 46.1 | 6.5 |
| – Percent of Open Interest Shorts: | 6.8 | 71.5 | 8.6 |
| – Net Position: | 221,055 | -204,446 | -16,609 |
| – Gross Longs: | 275,409 | 370,661 | 52,519 |
| – Gross Shorts: | 54,354 | 575,107 | 69,128 |
| – Long to Short Ratio: | 5.1 to 1 | 0.6 to 1 | 0.8 to 1 |
| NET POSITION TREND: | |||
| – COT Index Score (3 Year Range Pct): | 85.0 | 17.7 | 48.5 |
| – COT Index Reading (3 Year Range): | Bullish-Extreme | Bearish-Extreme | Bearish |
| NET POSITION MOVEMENT INDEX: | |||
| – 6-Week Change in Strength Index: | -0.7 | 2.7 | -13.3 |
SOYBEAN OIL Futures:
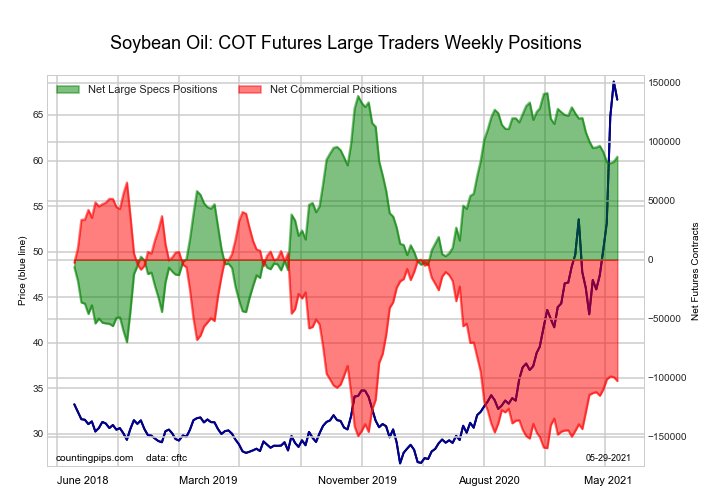
The SOYBEAN OIL large speculator standing this week recorded a net position of 87,203 contracts in the data reported through Tuesday. This was a weekly advance of 4,237 contracts from the previous week which had a total of 82,966 net contracts.
This week’s current strength score (the trader positioning range over the past three years, measured from 0 to 100) shows the speculators are currently Bullish with a score of 74.4 percent. The commercials are Bearish with a score of 25.3 percent and the small traders (not shown in chart) are Bullish with a score of 71.2 percent.
| SOYBEAN OIL Futures Statistics | SPECULATORS | COMMERCIALS | SMALL TRADERS |
| – Percent of Open Interest Longs: | 24.4 | 47.4 | 8.3 |
| – Percent of Open Interest Shorts: | 7.4 | 67.5 | 5.2 |
| – Net Position: | 87,203 | -102,673 | 15,470 |
| – Gross Longs: | 124,858 | 242,001 | 42,190 |
| – Gross Shorts: | 37,655 | 344,674 | 26,720 |
| – Long to Short Ratio: | 3.3 to 1 | 0.7 to 1 | 1.6 to 1 |
| NET POSITION TREND: | |||
| – COT Index Score (3 Year Range Pct): | 74.4 | 25.3 | 71.2 |
| – COT Index Reading (3 Year Range): | Bullish | Bearish | Bullish |
| NET POSITION MOVEMENT INDEX: | |||
| – 6-Week Change in Strength Index: | -3.7 | 4.2 | -5.6 |
SOYBEAN MEAL Futures:
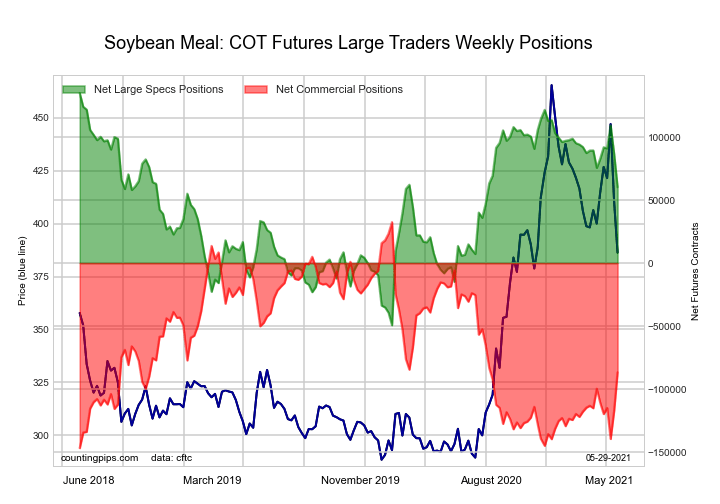
The SOYBEAN MEAL large speculator standing this week recorded a net position of 60,294 contracts in the data reported through Tuesday. This was a weekly reduction of -26,510 contracts from the previous week which had a total of 86,804 net contracts.
This week’s current strength score (the trader positioning range over the past three years, measured from 0 to 100) shows the speculators are currently Bullish with a score of 59.5 percent. The commercials are Bearish with a score of 33.5 percent and the small traders (not shown in chart) are Bullish with a score of 76.5 percent.
| SOYBEAN MEAL Futures Statistics | SPECULATORS | COMMERCIALS | SMALL TRADERS |
| – Percent of Open Interest Longs: | 22.9 | 50.5 | 12.7 |
| – Percent of Open Interest Shorts: | 7.9 | 72.0 | 6.1 |
| – Net Position: | 60,294 | -86,704 | 26,410 |
| – Gross Longs: | 92,334 | 203,528 | 51,206 |
| – Gross Shorts: | 32,040 | 290,232 | 24,796 |
| – Long to Short Ratio: | 2.9 to 1 | 0.7 to 1 | 2.1 to 1 |
| NET POSITION TREND: | |||
| – COT Index Score (3 Year Range Pct): | 59.5 | 33.5 | 76.5 |
| – COT Index Reading (3 Year Range): | Bullish | Bearish | Bullish |
| NET POSITION MOVEMENT INDEX: | |||
| – 6-Week Change in Strength Index: | -8.3 | 7.3 | 9.4 |
LIVE CATTLE Futures:
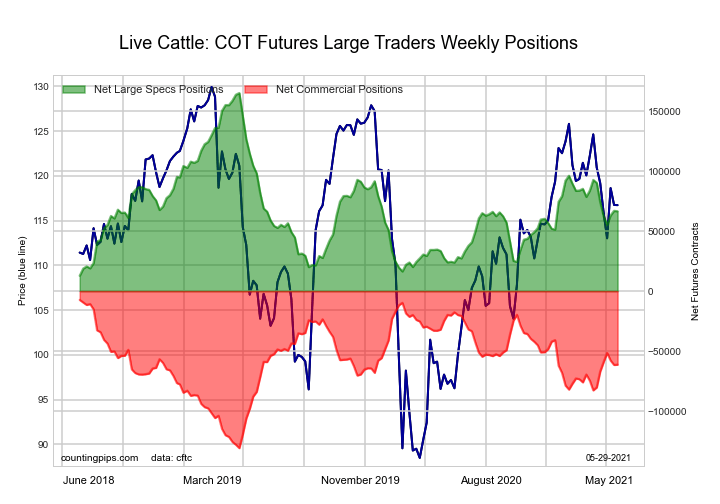
The LIVE CATTLE large speculator standing this week recorded a net position of 66,591 contracts in the data reported through Tuesday. This was a weekly fall of -364 contracts from the previous week which had a total of 66,955 net contracts.
This week’s current strength score (the trader positioning range over the past three years, measured from 0 to 100) shows the speculators are currently Bearish with a score of 35.3 percent. The commercials are Bullish with a score of 56.3 percent and the small traders (not shown in chart) are Bullish with a score of 74.2 percent.
| LIVE CATTLE Futures Statistics | SPECULATORS | COMMERCIALS | SMALL TRADERS |
| – Percent of Open Interest Longs: | 37.3 | 37.6 | 10.0 |
| – Percent of Open Interest Shorts: | 16.2 | 57.1 | 11.6 |
| – Net Position: | 66,591 | -61,294 | -5,297 |
| – Gross Longs: | 117,538 | 118,506 | 31,340 |
| – Gross Shorts: | 50,947 | 179,800 | 36,637 |
| – Long to Short Ratio: | 2.3 to 1 | 0.7 to 1 | 0.9 to 1 |
| NET POSITION TREND: | |||
| – COT Index Score (3 Year Range Pct): | 35.3 | 56.3 | 74.2 |
| – COT Index Reading (3 Year Range): | Bearish | Bullish | Bullish |
| NET POSITION MOVEMENT INDEX: | |||
| – 6-Week Change in Strength Index: | -15.6 | 15.3 | 11.6 |
LEAN HOGS Futures:
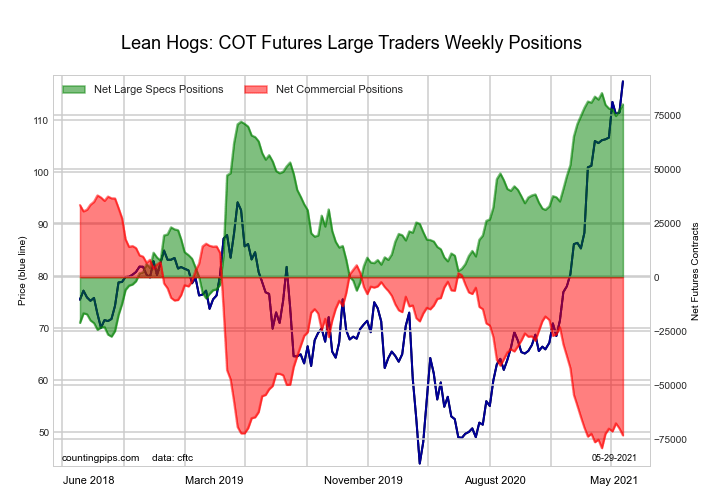
The LEAN HOGS large speculator standing this week recorded a net position of 79,975 contracts in the data reported through Tuesday. This was a weekly boost of 2,861 contracts from the previous week which had a total of 77,114 net contracts.
This week’s current strength score (the trader positioning range over the past three years, measured from 0 to 100) shows the speculators are currently Bullish-Extreme with a score of 95.4 percent. The commercials are Bearish-Extreme with a score of 5.0 percent and the small traders (not shown in chart) are Bearish with a score of 45.6 percent.
| LEAN HOGS Futures Statistics | SPECULATORS | COMMERCIALS | SMALL TRADERS |
| – Percent of Open Interest Longs: | 39.6 | 29.0 | 9.1 |
| – Percent of Open Interest Shorts: | 12.6 | 53.8 | 11.4 |
| – Net Position: | 79,975 | -73,196 | -6,779 |
| – Gross Longs: | 117,159 | 85,891 | 26,967 |
| – Gross Shorts: | 37,184 | 159,087 | 33,746 |
| – Long to Short Ratio: | 3.2 to 1 | 0.5 to 1 | 0.8 to 1 |
| NET POSITION TREND: | |||
| – COT Index Score (3 Year Range Pct): | 95.4 | 5.0 | 45.6 |
| – COT Index Reading (3 Year Range): | Bullish-Extreme | Bearish-Extreme | Bearish |
| NET POSITION MOVEMENT INDEX: | |||
| – 6-Week Change in Strength Index: | -4.6 | 5.0 | -3.2 |
COTTON Futures:
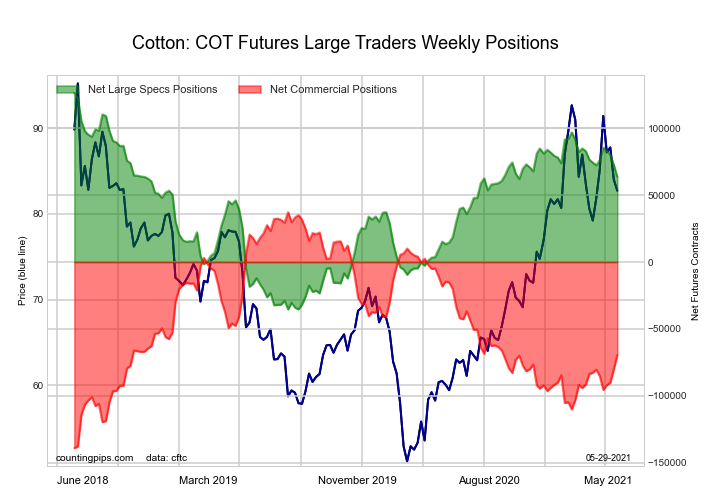
The COTTON large speculator standing this week recorded a net position of 63,653 contracts in the data reported through Tuesday. This was a weekly reduction of -9,000 contracts from the previous week which had a total of 72,653 net contracts.
This week’s current strength score (the trader positioning range over the past three years, measured from 0 to 100) shows the speculators are currently Bullish with a score of 61.2 percent. The commercials are Bearish with a score of 39.5 percent and the small traders (not shown in chart) are Bearish with a score of 46.7 percent.
| COTTON Futures Statistics | SPECULATORS | COMMERCIALS | SMALL TRADERS |
| – Percent of Open Interest Longs: | 34.8 | 46.3 | 6.3 |
| – Percent of Open Interest Shorts: | 6.2 | 77.5 | 3.7 |
| – Net Position: | 63,653 | -69,480 | 5,827 |
| – Gross Longs: | 77,472 | 103,023 | 14,033 |
| – Gross Shorts: | 13,819 | 172,503 | 8,206 |
| – Long to Short Ratio: | 5.6 to 1 | 0.6 to 1 | 1.7 to 1 |
| NET POSITION TREND: | |||
| – COT Index Score (3 Year Range Pct): | 61.2 | 39.5 | 46.7 |
| – COT Index Reading (3 Year Range): | Bullish | Bearish | Bearish |
| NET POSITION MOVEMENT INDEX: | |||
| – 6-Week Change in Strength Index: | -5.4 | 6.2 | -13.1 |
COCOA Futures:
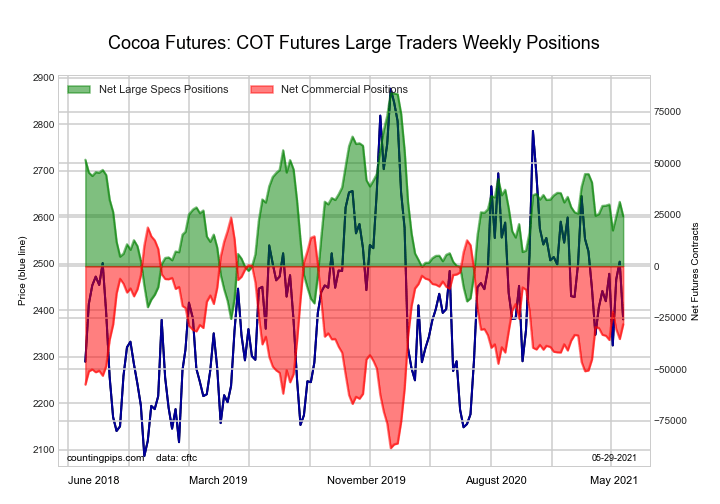
The COCOA large speculator standing this week recorded a net position of 24,303 contracts in the data reported through Tuesday. This was a weekly decrease of -6,936 contracts from the previous week which had a total of 31,239 net contracts.
This week’s current strength score (the trader positioning range over the past three years, measured from 0 to 100) shows the speculators are currently Bearish with a score of 45.5 percent. The commercials are Bullish with a score of 53.7 percent and the small traders (not shown in chart) are Bullish with a score of 52.7 percent.
| COCOA Futures Statistics | SPECULATORS | COMMERCIALS | SMALL TRADERS |
| – Percent of Open Interest Longs: | 27.7 | 45.0 | 5.4 |
| – Percent of Open Interest Shorts: | 15.9 | 58.8 | 3.5 |
| – Net Position: | 24,303 | -28,187 | 3,884 |
| – Gross Longs: | 56,891 | 92,424 | 11,036 |
| – Gross Shorts: | 32,588 | 120,611 | 7,152 |
| – Long to Short Ratio: | 1.7 to 1 | 0.8 to 1 | 1.5 to 1 |
| NET POSITION TREND: | |||
| – COT Index Score (3 Year Range Pct): | 45.5 | 53.7 | 52.7 |
| – COT Index Reading (3 Year Range): | Bearish | Bullish | Bullish |
| NET POSITION MOVEMENT INDEX: | |||
| – 6-Week Change in Strength Index: | -4.5 | 4.5 | -1.6 |
WHEAT Futures:
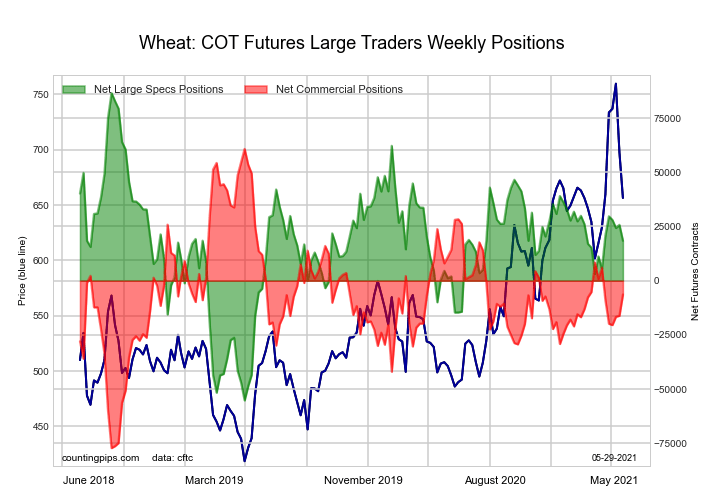
The WHEAT large speculator standing this week recorded a net position of 18,411 contracts in the data reported through Tuesday. This was a weekly decline of -7,337 contracts from the previous week which had a total of 25,748 net contracts.
This week’s current strength score (the trader positioning range over the past three years, measured from 0 to 100) shows the speculators are currently Bullish with a score of 51.9 percent. The commercials are Bullish with a score of 51.3 percent and the small traders (not shown in chart) are Bearish with a score of 44.0 percent.
| WHEAT Futures Statistics | SPECULATORS | COMMERCIALS | SMALL TRADERS |
| – Percent of Open Interest Longs: | 28.9 | 35.4 | 6.7 |
| – Percent of Open Interest Shorts: | 24.3 | 37.0 | 9.6 |
| – Net Position: | 18,411 | -6,359 | -12,052 |
| – Gross Longs: | 117,162 | 143,788 | 27,050 |
| – Gross Shorts: | 98,751 | 150,147 | 39,102 |
| – Long to Short Ratio: | 1.2 to 1 | 1.0 to 1 | 0.7 to 1 |
| NET POSITION TREND: | |||
| – COT Index Score (3 Year Range Pct): | 51.9 | 51.3 | 44.0 |
| – COT Index Reading (3 Year Range): | Bullish | Bullish | Bearish |
| NET POSITION MOVEMENT INDEX: | |||
| – 6-Week Change in Strength Index: | 9.1 | -9.0 | -2.5 |
Article By CountingPips.com – Receive our weekly COT Reports by Email
*COT Report: The COT data, released weekly to the public each Friday, is updated through the most recent Tuesday (data is 3 days old) and shows a quick view of how large speculators or non-commercials (for-profit traders) were positioned in the futures markets.
The CFTC categorizes trader positions according to commercial hedgers (traders who use futures contracts for hedging as part of the business), non-commercials (large traders who speculate to realize trading profits) and nonreportable traders (usually small traders/speculators).
Find CFTC criteria here: (http://www.cftc.gov/MarketReports/CommitmentsofTraders/ExplanatoryNotes/index.htm).

- The US natural gas prices fell to a 2-month low. A drop in the technology sector on Wednesday had a negative impact on the broad market Apr 18, 2024
- Target Thursdays: Cocoa, Bitcoin and USDCHF hit targets! Apr 18, 2024
- British Pound shows signs of recovery amid favourable inflation data Apr 18, 2024
- Indices decline amid hawkish comments from the Fed. Investors are waiting for Israel’s answer Apr 17, 2024
- EURGBP: Slams into support on hot UK inflation Apr 17, 2024
- Brent crude prices dip amid concerns over global demand Apr 17, 2024
- Stock indices sell-off amid rising geopolitical tensions in the Middle East. China’s GDP grew the most in a year Apr 16, 2024
- New FXTM commodity hits all-time high! Apr 16, 2024
- NZD hits five-month low against strong US dollar Apr 16, 2024
- Escalating conflict in the Middle East is forcing investors to shift funds to safe assets Apr 15, 2024