
By CountingPips.com COT Home | Data Tables | Data Downloads | Newsletter
Here are the latest charts and statistics for the Commitment of Traders (COT) data published by the Commodities Futures Trading Commission (CFTC).
The latest COT data is updated through Tuesday May 04 2021 and shows a quick view of how large traders (for-profit speculators and commercial entities) were positioned in the futures markets.
WTI Crude Oil Futures :
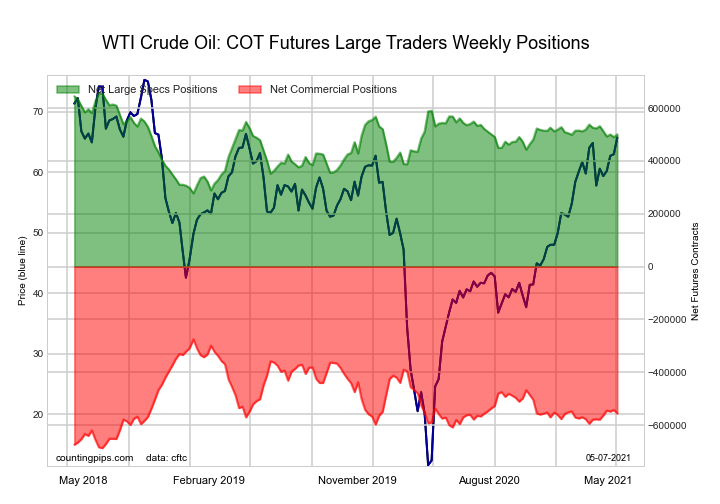
The WTI Crude Oil Futures large speculator standing this week equaled a net position of 500,013 contracts in the data reported through Tuesday. This was a weekly rise of 10,302 contracts from the previous week which had a total of 489,711 net contracts.
This week’s current strength score (the trader positioning range over the past three years, measured from 0 to 100) shows the speculators are currently Bullish with a score of 58.7 percent. The commercials are Bearish with a score of 31.7 percent and the small traders (not shown in chart) are Bullish-Extreme with a score of 94.9 percent.
| WTI Crude Oil Futures Statistics | SPECULATORS | COMMERCIALS | SMALL TRADERS |
| – Percent of Open Interest Longs: | 27.2 | 34.7 | 4.6 |
| – Percent of Open Interest Shorts: | 6.6 | 57.7 | 2.3 |
| – Net Position: | 500,013 | -556,470 | 56,457 |
| – Gross Longs: | 658,677 | 838,839 | 112,353 |
| – Gross Shorts: | 158,664 | 1,395,309 | 55,896 |
| – Long to Short Ratio: | 4.2 to 1 | 0.6 to 1 | 2.0 to 1 |
| NET POSITION TREND: | |||
| – COT Index Score (3 Year Range Pct): | 58.7 | 31.7 | 94.9 |
| – COT Index Reading (3 Year Range): | Bullish | Bearish | Bullish-Extreme |
| NET POSITION MOVEMENT INDEX: | |||
| – 6-Week Change in Strength Index: | -6.1 | 5.2 | 2.5 |
Free Reports:
 Get our Weekly Commitment of Traders Reports - See where the biggest traders (Hedge Funds and Commercial Hedgers) are positioned in the futures markets on a weekly basis.
 Download Our Metatrader 4 Indicators – Put Our Free MetaTrader 4 Custom Indicators on your charts when you join our Weekly Newsletter
Brent Crude Oil Futures :
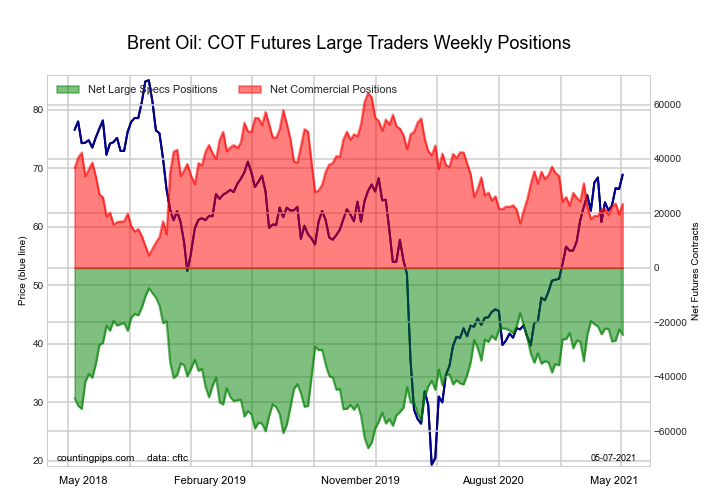
The Brent Crude Oil Futures large speculator standing this week equaled a net position of -24,600 contracts in the data reported through Tuesday. This was a weekly lowering of -2,028 contracts from the previous week which had a total of -22,572 net contracts.
This week’s current strength score (the trader positioning range over the past three years, measured from 0 to 100) shows the speculators are currently Bullish with a score of 70.8 percent. The commercials are Bearish with a score of 31.9 percent and the small traders (not shown in chart) are Bearish with a score of 33.5 percent.
| Brent Crude Oil Futures Statistics | SPECULATORS | COMMERCIALS | SMALL TRADERS |
| – Percent of Open Interest Longs: | 17.7 | 47.3 | 3.8 |
| – Percent of Open Interest Shorts: | 30.7 | 34.9 | 3.3 |
| – Net Position: | -24,600 | 23,543 | 1,057 |
| – Gross Longs: | 33,496 | 89,453 | 7,276 |
| – Gross Shorts: | 58,096 | 65,910 | 6,219 |
| – Long to Short Ratio: | 0.6 to 1 | 1.4 to 1 | 1.2 to 1 |
| NET POSITION TREND: | |||
| – COT Index Score (3 Year Range Pct): | 70.8 | 31.9 | 33.5 |
| – COT Index Reading (3 Year Range): | Bullish | Bearish | Bearish |
| NET POSITION MOVEMENT INDEX: | |||
| – 6-Week Change in Strength Index: | -0.4 | 3.6 | -12.5 |
Natural Gas Futures :
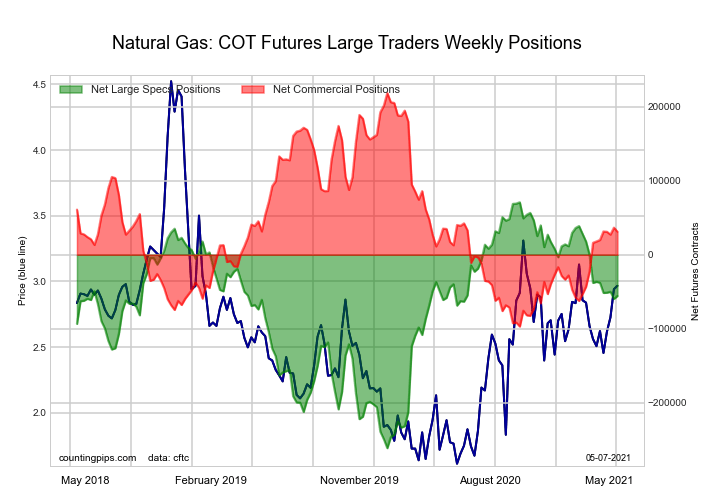
The Natural Gas Futures large speculator standing this week equaled a net position of -55,814 contracts in the data reported through Tuesday. This was a weekly advance of 3,802 contracts from the previous week which had a total of -59,616 net contracts.
This week’s current strength score (the trader positioning range over the past three years, measured from 0 to 100) shows the speculators are currently Bullish with a score of 61.9 percent. The commercials are Bearish with a score of 40.6 percent and the small traders (not shown in chart) are Bearish with a score of 26.3 percent.
| Natural Gas Futures Statistics | SPECULATORS | COMMERCIALS | SMALL TRADERS |
| – Percent of Open Interest Longs: | 22.7 | 40.8 | 4.9 |
| – Percent of Open Interest Shorts: | 27.4 | 38.2 | 2.8 |
| – Net Position: | -55,814 | 31,157 | 24,657 |
| – Gross Longs: | 270,765 | 485,812 | 58,289 |
| – Gross Shorts: | 326,579 | 454,655 | 33,632 |
| – Long to Short Ratio: | 0.8 to 1 | 1.1 to 1 | 1.7 to 1 |
| NET POSITION TREND: | |||
| – COT Index Score (3 Year Range Pct): | 61.9 | 40.6 | 26.3 |
| – COT Index Reading (3 Year Range): | Bullish | Bearish | Bearish |
| NET POSITION MOVEMENT INDEX: | |||
| – 6-Week Change in Strength Index: | -5.8 | 4.2 | 19.2 |
Gasoline Blendstock Futures :
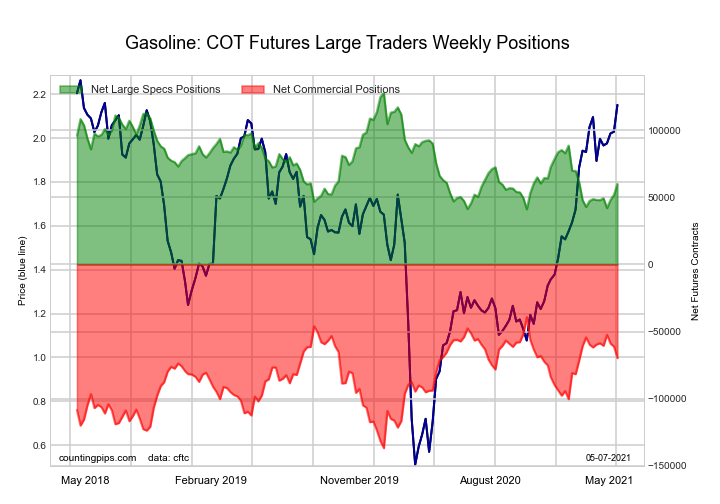
The Gasoline Blendstock Futures large speculator standing this week equaled a net position of 59,995 contracts in the data reported through Tuesday. This was a weekly increase of 8,090 contracts from the previous week which had a total of 51,905 net contracts.
This week’s current strength score (the trader positioning range over the past three years, measured from 0 to 100) shows the speculators are currently Bearish with a score of 21.8 percent. The commercials are Bullish with a score of 68.7 percent and the small traders (not shown in chart) are Bullish with a score of 70.1 percent.
| Nasdaq Mini Futures Statistics | SPECULATORS | COMMERCIALS | SMALL TRADERS |
| – Percent of Open Interest Longs: | 27.2 | 44.7 | 6.1 |
| – Percent of Open Interest Shorts: | 11.0 | 63.4 | 3.4 |
| – Net Position: | 59,995 | -69,798 | 9,803 |
| – Gross Longs: | 100,953 | 165,913 | 22,479 |
| – Gross Shorts: | 40,958 | 235,711 | 12,676 |
| – Long to Short Ratio: | 2.5 to 1 | 0.7 to 1 | 1.8 to 1 |
| NET POSITION TREND: | |||
| – COT Index Score (3 Year Range Pct): | 21.8 | 68.7 | 70.1 |
| – COT Index Reading (3 Year Range): | Bearish | Bullish | Bullish |
| NET POSITION MOVEMENT INDEX: | |||
| – 6-Week Change in Strength Index: | 13.8 | -10.4 | -10.5 |
#2 Heating Oil NY-Harbor Futures :

The #2 Heating Oil NY-Harbor Futures large speculator standing this week equaled a net position of 3,711 contracts in the data reported through Tuesday. This was a weekly reduction of -2,117 contracts from the previous week which had a total of 5,828 net contracts.
This week’s current strength score (the trader positioning range over the past three years, measured from 0 to 100) shows the speculators are currently Bearish with a score of 40.6 percent. The commercials are Bearish with a score of 43.2 percent and the small traders (not shown in chart) are Bullish-Extreme with a score of 100.0 percent.
| Heating Oil Futures Statistics | SPECULATORS | COMMERCIALS | SMALL TRADERS |
| – Percent of Open Interest Longs: | 15.8 | 48.0 | 12.4 |
| – Percent of Open Interest Shorts: | 14.9 | 55.4 | 6.0 |
| – Net Position: | 3,711 | -29,058 | 25,347 |
| – Gross Longs: | 62,580 | 190,169 | 49,028 |
| – Gross Shorts: | 58,869 | 219,227 | 23,681 |
| – Long to Short Ratio: | 1.1 to 1 | 0.9 to 1 | 2.1 to 1 |
| NET POSITION TREND: | |||
| – COT Index Score (3 Year Range Pct): | 40.6 | 43.2 | 100.0 |
| – COT Index Reading (3 Year Range): | Bearish | Bearish | Bullish-Extreme |
| NET POSITION MOVEMENT INDEX: | |||
| – 6-Week Change in Strength Index: | -6.5 | -2.3 | 30.2 |
Bloomberg Commodity Index Futures :

The Bloomberg Commodity Index Futures large speculator standing this week equaled a net position of -10,059 contracts in the data reported through Tuesday. This was a weekly decrease of -716 contracts from the previous week which had a total of -9,343 net contracts.
This week’s current strength score (the trader positioning range over the past three years, measured from 0 to 100) shows the speculators are currently Bearish with a score of 37.8 percent. The commercials are Bullish with a score of 62.2 percent and the small traders (not shown in chart) are Bullish with a score of 63.5 percent.
| Bloomberg Index Futures Statistics | SPECULATORS | COMMERCIALS | SMALL TRADERS |
| – Percent of Open Interest Longs: | 56.6 | 42.1 | 1.1 |
| – Percent of Open Interest Shorts: | 87.3 | 12.3 | 0.2 |
| – Net Position: | -10,059 | 9,767 | 292 |
| – Gross Longs: | 18,557 | 13,807 | 360 |
| – Gross Shorts: | 28,616 | 4,040 | 68 |
| – Long to Short Ratio: | 0.6 to 1 | 3.4 to 1 | 5.3 to 1 |
| NET POSITION TREND: | |||
| – COT Index Score (3 Year Range Pct): | 37.8 | 62.2 | 63.5 |
| – COT Index Reading (3 Year Range): | Bearish | Bullish | Bullish |
| NET POSITION MOVEMENT INDEX: | |||
| – 6-Week Change in Strength Index: | 21.1 | -21.2 | -2.3 |
Article By CountingPips.com – Receive our weekly COT Reports by Email
*COT Report: The COT data, released weekly to the public each Friday, is updated through the most recent Tuesday (data is 3 days old) and shows a quick view of how large speculators or non-commercials (for-profit traders) were positioned in the futures markets.
The CFTC categorizes trader positions according to commercial hedgers (traders who use futures contracts for hedging as part of the business), non-commercials (large traders who speculate to realize trading profits) and nonreportable traders (usually small traders/speculators).
Find CFTC criteria here: (http://www.cftc.gov/MarketReports/CommitmentsofTraders/ExplanatoryNotes/index.htm).

- 3 Signs of Developing U.S. Economic Slowdown Apr 19, 2024
- Israel has retaliated against Iran. Investors run to safe assets Apr 19, 2024
- Gold hits record high amid growing geopolitical tensions Apr 19, 2024
- The US natural gas prices fell to a 2-month low. A drop in the technology sector on Wednesday had a negative impact on the broad market Apr 18, 2024
- Target Thursdays: Cocoa, Bitcoin and USDCHF hit targets! Apr 18, 2024
- British Pound shows signs of recovery amid favourable inflation data Apr 18, 2024
- Indices decline amid hawkish comments from the Fed. Investors are waiting for Israel’s answer Apr 17, 2024
- EURGBP: Slams into support on hot UK inflation Apr 17, 2024
- Brent crude prices dip amid concerns over global demand Apr 17, 2024
- Stock indices sell-off amid rising geopolitical tensions in the Middle East. China’s GDP grew the most in a year Apr 16, 2024