
By CountingPips.com COT Home | Data Tables | Data Downloads | Newsletter
Here are the latest charts and statistics for the Commitment of Traders (COT) data published by the Commodities Futures Trading Commission (CFTC).
The latest COT data is updated through Tuesday May 25 2021 and shows a quick view of how large traders (for-profit speculators and commercial entities) were positioned in the futures markets.
3-Month Eurodollars Futures:
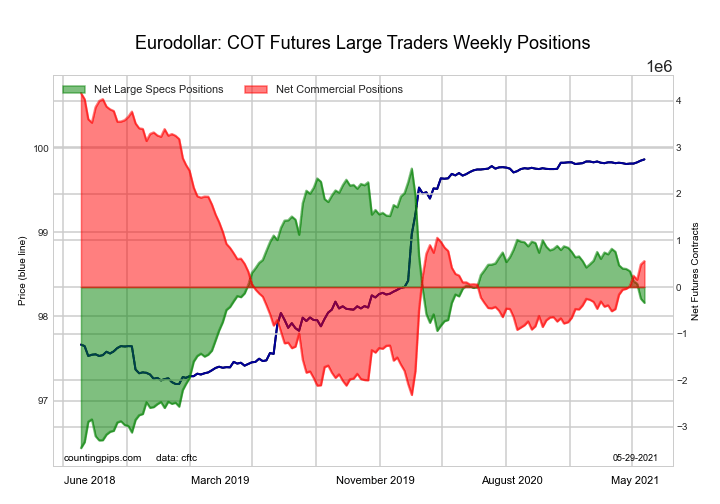
The 3-Month Eurodollars large speculator standing this week resulted in a net position of -337,407 contracts in the data reported through Tuesday. This was a weekly lowering of -90,156 contracts from the previous week which had a total of -247,251 net contracts.
This week’s current strength score (the trader positioning range over the past three years, measured from 0 to 100) shows the speculators are currently Bullish with a score of 52.0 percent. The commercials are Bearish with a score of 44.3 percent and the small traders (not shown in chart) are Bullish with a score of 74.4 percent.
Free Reports:
 Get our Weekly Commitment of Traders Reports - See where the biggest traders (Hedge Funds and Commercial Hedgers) are positioned in the futures markets on a weekly basis.
 Sign Up for Our Stock Market Newsletter – Get updated on News, Charts & Rankings of Public Companies when you join our Stocks Newsletter
| 3-Month Eurodollars Statistics | SPECULATORS | COMMERCIALS | SMALL TRADERS |
| – Percent of Open Interest Longs: | 20.9 | 50.8 | 5.2 |
| – Percent of Open Interest Shorts: | 23.4 | 46.5 | 6.9 |
| – Net Position: | -337,407 | 556,246 | -218,839 |
| – Gross Longs: | 2,730,799 | 6,650,052 | 678,934 |
| – Gross Shorts: | 3,068,206 | 6,093,806 | 897,773 |
| – Long to Short Ratio: | 0.9 to 1 | 1.1 to 1 | 0.8 to 1 |
| NET POSITION TREND: | |||
| – COT Index Score (3 Year Range Pct): | 52.0 | 44.3 | 74.4 |
| – COT Index Reading (3 Year Range): | Bullish | Bearish | Bullish |
| NET POSITION MOVEMENT INDEX: | |||
| – 6-Week Change in Strength Index: | -12.3 | 9.5 | 15.7 |
30-Day Federal Funds Futures:
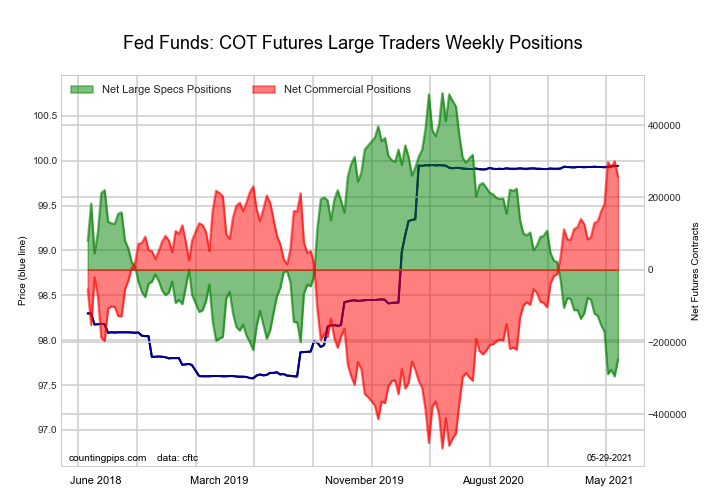
The 30-Day Federal Funds large speculator standing this week resulted in a net position of -247,959 contracts in the data reported through Tuesday. This was a weekly increase of 46,785 contracts from the previous week which had a total of -294,744 net contracts.
This week’s current strength score (the trader positioning range over the past three years, measured from 0 to 100) shows the speculators are currently Bearish-Extreme with a score of 6.0 percent. The commercials are Bullish-Extreme with a score of 94.6 percent and the small traders (not shown in chart) are Bullish with a score of 53.2 percent.
| 30-Day Federal Funds Statistics | SPECULATORS | COMMERCIALS | SMALL TRADERS |
| – Percent of Open Interest Longs: | 4.3 | 76.8 | 1.8 |
| – Percent of Open Interest Shorts: | 26.4 | 53.8 | 2.7 |
| – Net Position: | -247,959 | 257,765 | -9,806 |
| – Gross Longs: | 48,298 | 861,103 | 20,062 |
| – Gross Shorts: | 296,257 | 603,338 | 29,868 |
| – Long to Short Ratio: | 0.2 to 1 | 1.4 to 1 | 0.7 to 1 |
| NET POSITION TREND: | |||
| – COT Index Score (3 Year Range Pct): | 6.0 | 94.6 | 53.2 |
| – COT Index Reading (3 Year Range): | Bearish-Extreme | Bullish-Extreme | Bullish |
| NET POSITION MOVEMENT INDEX: | |||
| – 6-Week Change in Strength Index: | -15.4 | 15.5 | -4.4 |
2-Year Treasury Note Futures:
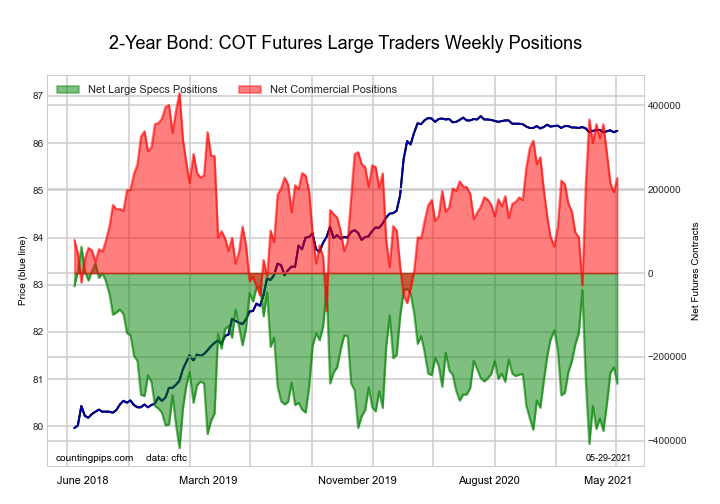
The 2-Year Treasury Note large speculator standing this week resulted in a net position of -263,456 contracts in the data reported through Tuesday. This was a weekly decrease of -38,724 contracts from the previous week which had a total of -224,732 net contracts.
This week’s current strength score (the trader positioning range over the past three years, measured from 0 to 100) shows the speculators are currently Bearish with a score of 34.9 percent. The commercials are Bullish with a score of 61.1 percent and the small traders (not shown in chart) are Bullish with a score of 54.1 percent.
| 2-Year Treasury Note Statistics | SPECULATORS | COMMERCIALS | SMALL TRADERS |
| – Percent of Open Interest Longs: | 17.9 | 74.5 | 6.3 |
| – Percent of Open Interest Shorts: | 29.0 | 64.9 | 4.8 |
| – Net Position: | -263,456 | 226,934 | 36,522 |
| – Gross Longs: | 422,520 | 1,760,922 | 149,783 |
| – Gross Shorts: | 685,976 | 1,533,988 | 113,261 |
| – Long to Short Ratio: | 0.6 to 1 | 1.1 to 1 | 1.3 to 1 |
| NET POSITION TREND: | |||
| – COT Index Score (3 Year Range Pct): | 34.9 | 61.1 | 54.1 |
| – COT Index Reading (3 Year Range): | Bearish | Bullish | Bullish |
| NET POSITION MOVEMENT INDEX: | |||
| – 6-Week Change in Strength Index: | 24.5 | -24.7 | 10.9 |
5-Year Treasury Note Futures:

The 5-Year Treasury Note large speculator standing this week resulted in a net position of -109,619 contracts in the data reported through Tuesday. This was a weekly decline of -119,153 contracts from the previous week which had a total of 9,534 net contracts.
This week’s current strength score (the trader positioning range over the past three years, measured from 0 to 100) shows the speculators are currently Bullish with a score of 78.7 percent. The commercials are Bearish with a score of 27.7 percent and the small traders (not shown in chart) are Bearish with a score of 28.7 percent.
| 5-Year Treasury Note Statistics | SPECULATORS | COMMERCIALS | SMALL TRADERS |
| – Percent of Open Interest Longs: | 10.1 | 78.4 | 8.5 |
| – Percent of Open Interest Shorts: | 13.3 | 72.5 | 11.3 |
| – Net Position: | -109,619 | 202,363 | -92,744 |
| – Gross Longs: | 342,368 | 2,659,008 | 289,241 |
| – Gross Shorts: | 451,987 | 2,456,645 | 381,985 |
| – Long to Short Ratio: | 0.8 to 1 | 1.1 to 1 | 0.8 to 1 |
| NET POSITION TREND: | |||
| – COT Index Score (3 Year Range Pct): | 78.7 | 27.7 | 28.7 |
| – COT Index Reading (3 Year Range): | Bullish | Bearish | Bearish |
| NET POSITION MOVEMENT INDEX: | |||
| – 6-Week Change in Strength Index: | -13.8 | 10.2 | 7.6 |
10-Year Treasury Note Futures:
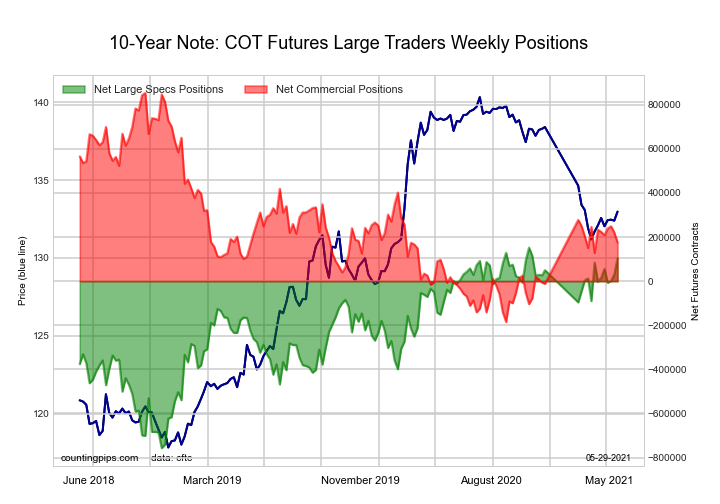
The 10-Year Treasury Note large speculator standing this week resulted in a net position of 104,398 contracts in the data reported through Tuesday. This was a weekly advance of 72,744 contracts from the previous week which had a total of 31,654 net contracts.
This week’s current strength score (the trader positioning range over the past three years, measured from 0 to 100) shows the speculators are currently Bullish-Extreme with a score of 94.7 percent. The commercials are Bearish with a score of 34.6 percent and the small traders (not shown in chart) are Bearish-Extreme with a score of 0.0 percent.
| 10-Year Treasury Note Statistics | SPECULATORS | COMMERCIALS | SMALL TRADERS |
| – Percent of Open Interest Longs: | 18.5 | 68.5 | 8.6 |
| – Percent of Open Interest Shorts: | 16.2 | 64.6 | 14.8 |
| – Net Position: | 104,398 | 174,988 | -279,386 |
| – Gross Longs: | 834,440 | 3,083,531 | 387,727 |
| – Gross Shorts: | 730,042 | 2,908,543 | 667,113 |
| – Long to Short Ratio: | 1.1 to 1 | 1.1 to 1 | 0.6 to 1 |
| NET POSITION TREND: | |||
| – COT Index Score (3 Year Range Pct): | 94.7 | 34.6 | 0.0 |
| – COT Index Reading (3 Year Range): | Bullish-Extreme | Bearish | Bearish-Extreme |
| NET POSITION MOVEMENT INDEX: | |||
| – 6-Week Change in Strength Index: | 11.8 | -5.6 | -13.1 |
Ultra 10-Year Notes Futures:
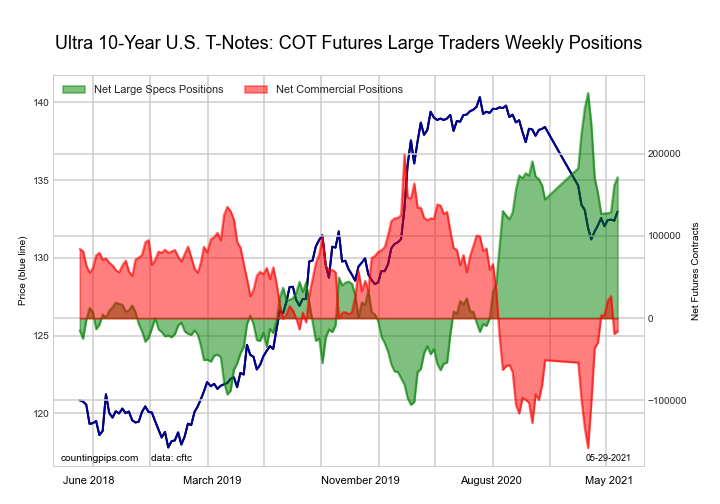
The Ultra 10-Year Notes large speculator standing this week resulted in a net position of 171,322 contracts in the data reported through Tuesday. This was a weekly gain of 9,816 contracts from the previous week which had a total of 161,506 net contracts.
This week’s current strength score (the trader positioning range over the past three years, measured from 0 to 100) shows the speculators are currently Bullish with a score of 73.0 percent. The commercials are Bearish with a score of 39.8 percent and the small traders (not shown in chart) are Bearish-Extreme with a score of 0.0 percent.
| Ultra 10-Year Notes Statistics | SPECULATORS | COMMERCIALS | SMALL TRADERS |
| – Percent of Open Interest Longs: | 19.5 | 69.6 | 8.8 |
| – Percent of Open Interest Shorts: | 9.1 | 70.6 | 18.3 |
| – Net Position: | 171,322 | -15,810 | -155,512 |
| – Gross Longs: | 320,528 | 1,143,178 | 144,736 |
| – Gross Shorts: | 149,206 | 1,158,988 | 300,248 |
| – Long to Short Ratio: | 2.1 to 1 | 1.0 to 1 | 0.5 to 1 |
| NET POSITION TREND: | |||
| – COT Index Score (3 Year Range Pct): | 73.0 | 39.8 | 0.0 |
| – COT Index Reading (3 Year Range): | Bullish | Bearish | Bearish-Extreme |
| NET POSITION MOVEMENT INDEX: | |||
| – 6-Week Change in Strength Index: | 5.1 | 3.9 | -25.4 |
US Treasury Bonds Futures:

The US Treasury Bonds large speculator standing this week resulted in a net position of -119,353 contracts in the data reported through Tuesday. This was a weekly decrease of -36,373 contracts from the previous week which had a total of -82,980 net contracts.
This week’s current strength score (the trader positioning range over the past three years, measured from 0 to 100) shows the speculators are currently Bullish with a score of 50.5 percent. The commercials are Bullish with a score of 76.4 percent and the small traders (not shown in chart) are Bearish-Extreme with a score of 7.2 percent.
| US Treasury Bonds Statistics | SPECULATORS | COMMERCIALS | SMALL TRADERS |
| – Percent of Open Interest Longs: | 5.4 | 76.8 | 14.0 |
| – Percent of Open Interest Shorts: | 14.7 | 63.0 | 18.5 |
| – Net Position: | -119,353 | 176,497 | -57,144 |
| – Gross Longs: | 68,604 | 981,864 | 178,650 |
| – Gross Shorts: | 187,957 | 805,367 | 235,794 |
| – Long to Short Ratio: | 0.4 to 1 | 1.2 to 1 | 0.8 to 1 |
| NET POSITION TREND: | |||
| – COT Index Score (3 Year Range Pct): | 50.5 | 76.4 | 7.2 |
| – COT Index Reading (3 Year Range): | Bullish | Bullish | Bearish-Extreme |
| NET POSITION MOVEMENT INDEX: | |||
| – 6-Week Change in Strength Index: | -0.5 | 3.8 | -8.3 |
Ultra US Treasury Bonds Futures:
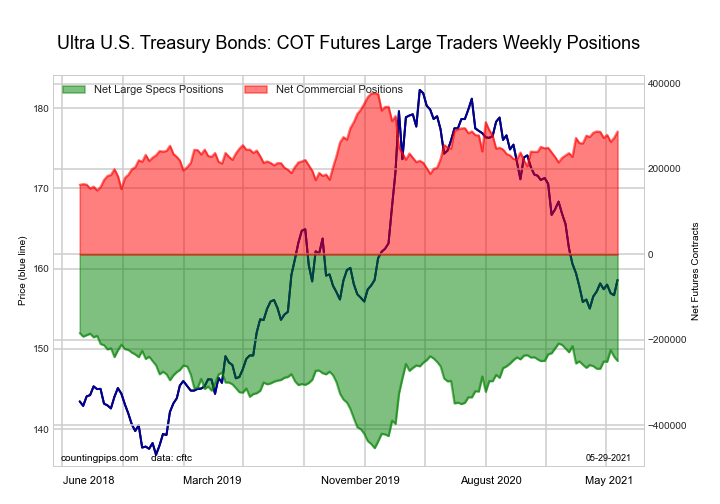
The Ultra US Treasury Bonds large speculator standing this week resulted in a net position of -249,634 contracts in the data reported through Tuesday. This was a weekly decrease of -9,842 contracts from the previous week which had a total of -239,792 net contracts.
This week’s current strength score (the trader positioning range over the past three years, measured from 0 to 100) shows the speculators are currently Bullish with a score of 75.8 percent. The commercials are Bullish with a score of 60.5 percent and the small traders (not shown in chart) are Bearish-Extreme with a score of 0.9 percent.
| Ultra US Treasury Bonds Statistics | SPECULATORS | COMMERCIALS | SMALL TRADERS |
| – Percent of Open Interest Longs: | 5.1 | 79.4 | 12.4 |
| – Percent of Open Interest Shorts: | 25.3 | 56.1 | 15.5 |
| – Net Position: | -249,634 | 287,734 | -38,100 |
| – Gross Longs: | 63,181 | 980,362 | 153,113 |
| – Gross Shorts: | 312,815 | 692,628 | 191,213 |
| – Long to Short Ratio: | 0.2 to 1 | 1.4 to 1 | 0.8 to 1 |
| NET POSITION TREND: | |||
| – COT Index Score (3 Year Range Pct): | 75.8 | 60.5 | 0.9 |
| – COT Index Reading (3 Year Range): | Bullish | Bullish | Bearish-Extreme |
| NET POSITION MOVEMENT INDEX: | |||
| – 6-Week Change in Strength Index: | 6.8 | -0.1 | -12.9 |
Article By CountingPips.com – Receive our weekly COT Reports by Email
*COT Report: The COT data, released weekly to the public each Friday, is updated through the most recent Tuesday (data is 3 days old) and shows a quick view of how large speculators or non-commercials (for-profit traders) were positioned in the futures markets.
The CFTC categorizes trader positions according to commercial hedgers (traders who use futures contracts for hedging as part of the business), non-commercials (large traders who speculate to realize trading profits) and nonreportable traders (usually small traders/speculators).
Find CFTC criteria here: (http://www.cftc.gov/MarketReports/CommitmentsofTraders/ExplanatoryNotes/index.htm).

- 3 Signs of Developing U.S. Economic Slowdown Apr 19, 2024
- Israel has retaliated against Iran. Investors run to safe assets Apr 19, 2024
- Gold hits record high amid growing geopolitical tensions Apr 19, 2024
- The US natural gas prices fell to a 2-month low. A drop in the technology sector on Wednesday had a negative impact on the broad market Apr 18, 2024
- Target Thursdays: Cocoa, Bitcoin and USDCHF hit targets! Apr 18, 2024
- British Pound shows signs of recovery amid favourable inflation data Apr 18, 2024
- Indices decline amid hawkish comments from the Fed. Investors are waiting for Israel’s answer Apr 17, 2024
- EURGBP: Slams into support on hot UK inflation Apr 17, 2024
- Brent crude prices dip amid concerns over global demand Apr 17, 2024
- Stock indices sell-off amid rising geopolitical tensions in the Middle East. China’s GDP grew the most in a year Apr 16, 2024