
Article By RoboForex.com
EURUSD, “Euro vs US Dollar”
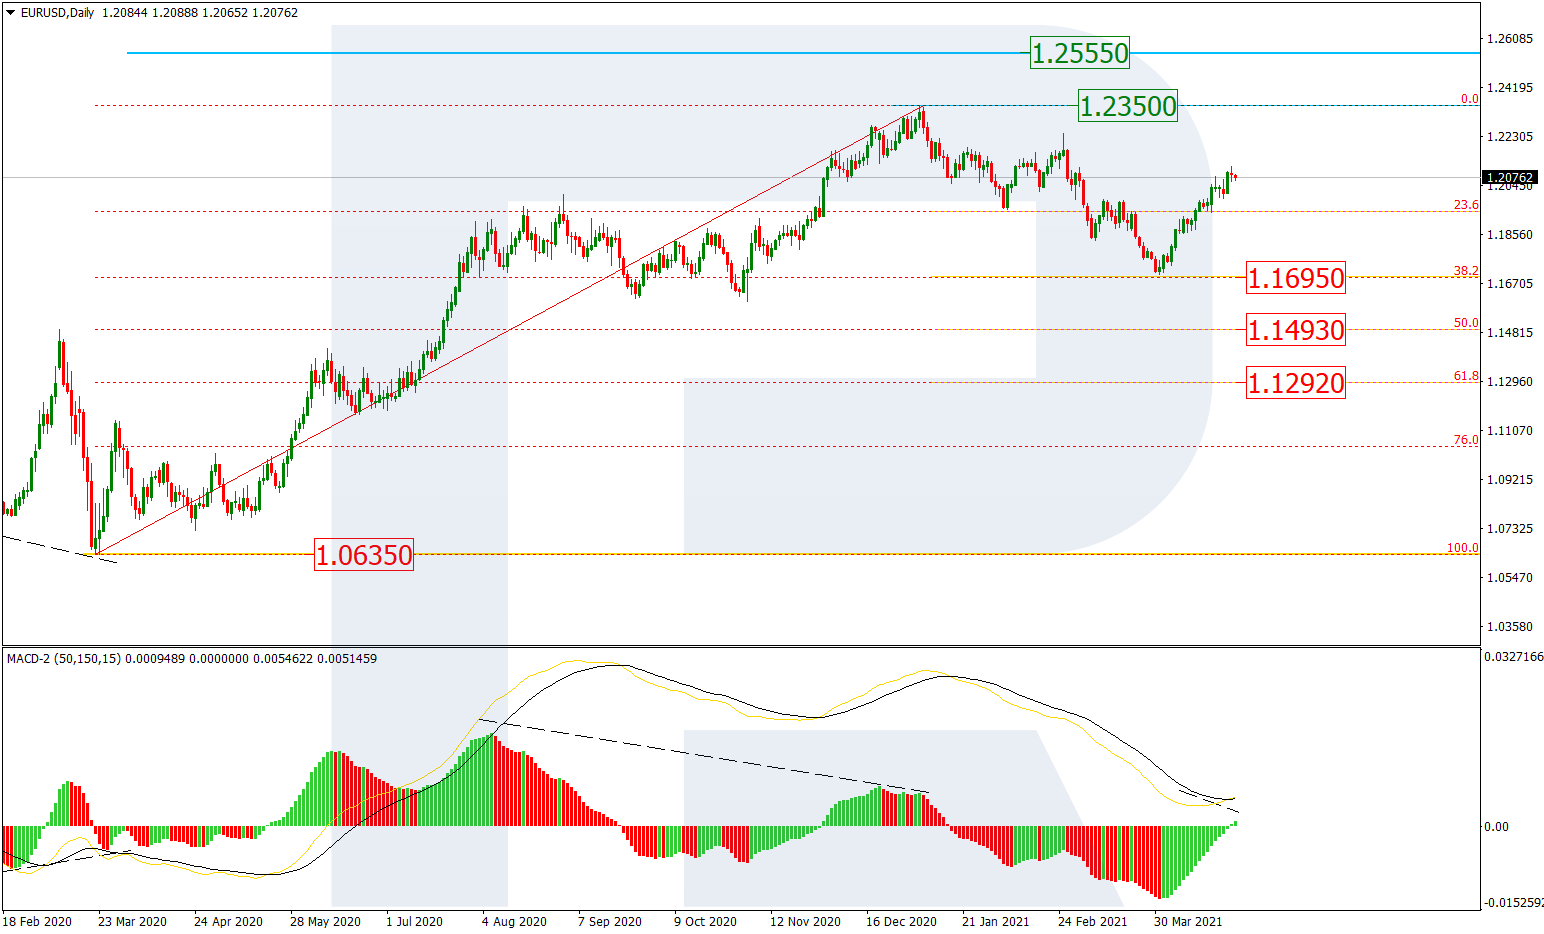
As we can see in the daily chart, after finishing the correctional decline at 38.2% fibo at 1.1695, the asset continues forming a stable rising impulse, which may be considered as a new wave within the long-term uptrend. The closest upside target is the current high at 1.2350, a breakout of which may lead to a further uptrend towards the fractal at 1.2555. At the same time, one shouldn’t exclude a possibility of another descending wave reaching 50.0% and 61.8% fibo at 1.1493 and 1.1292 respectively.

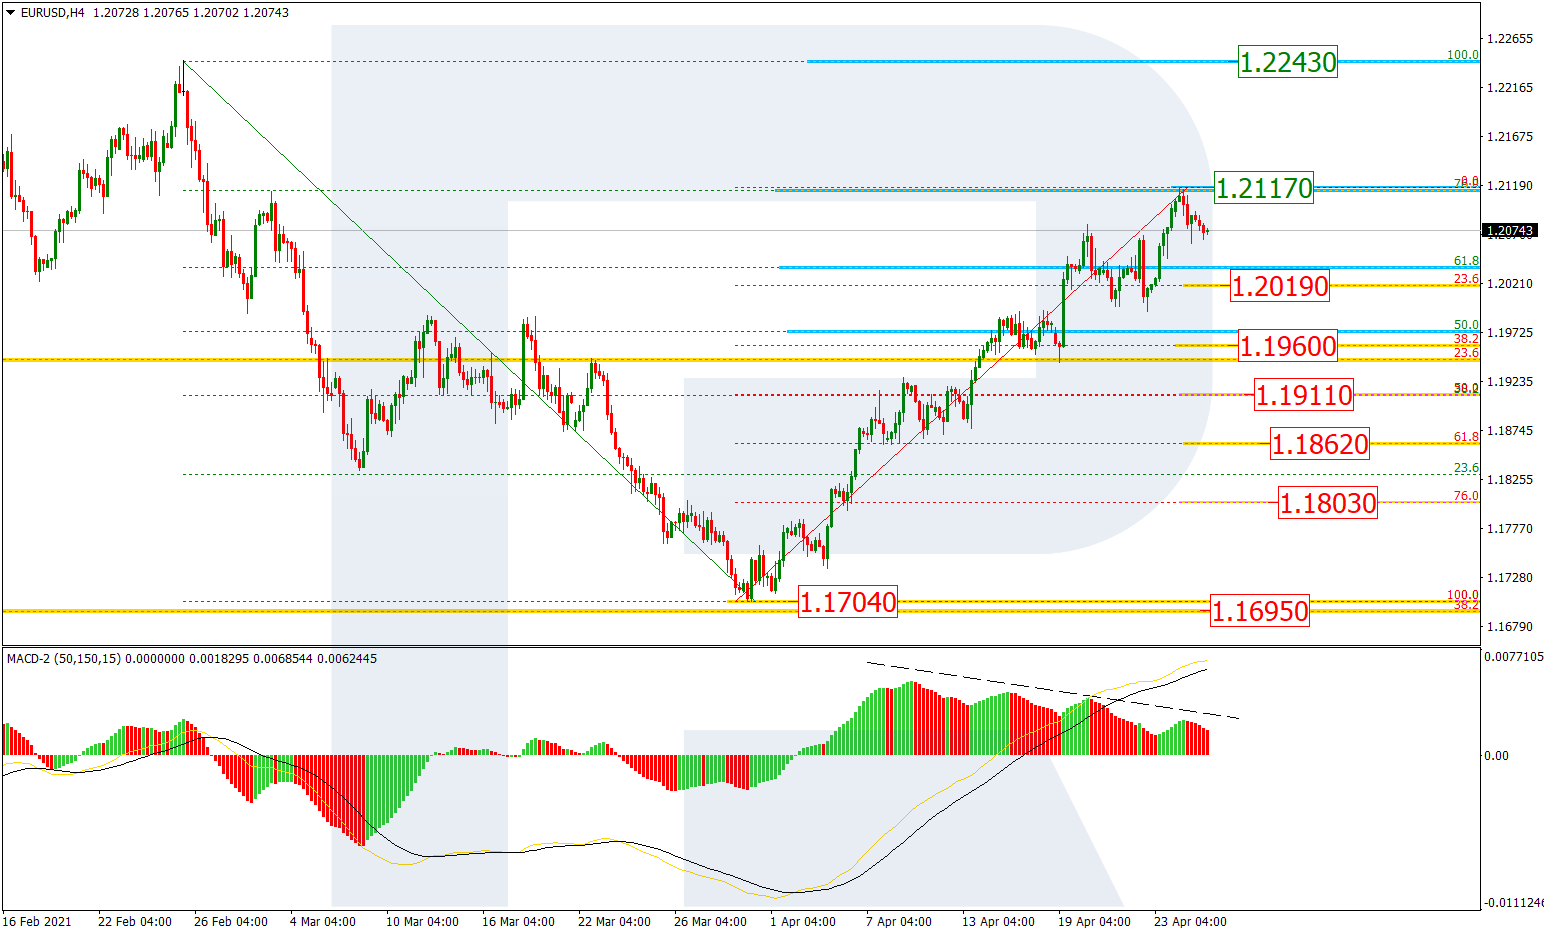
The H4 chart shows that the rising wave has reached 76.0% fibo. Despite the stable uptrend, there is a divergence on MACD, which may hint at a possible reversal downwards. In this case, the downside targets may be 23.6%, 38.2%, 50.0%, 61.8%, and 76.0% fibo at 1.2019, 1.1960, 1.1911, 1.1862 and 1.1803 respectively. however, the key downside target will be the local low and the mid-term 38.2% fibo at 1.1704 and 1.1695 respectively.
Free Reports:
 Get our Weekly Commitment of Traders Reports - See where the biggest traders (Hedge Funds and Commercial Hedgers) are positioned in the futures markets on a weekly basis.
 Sign Up for Our Stock Market Newsletter – Get updated on News, Charts & Rankings of Public Companies when you join our Stocks Newsletter
USDJPY, “US Dollar vs. Japanese Yen”
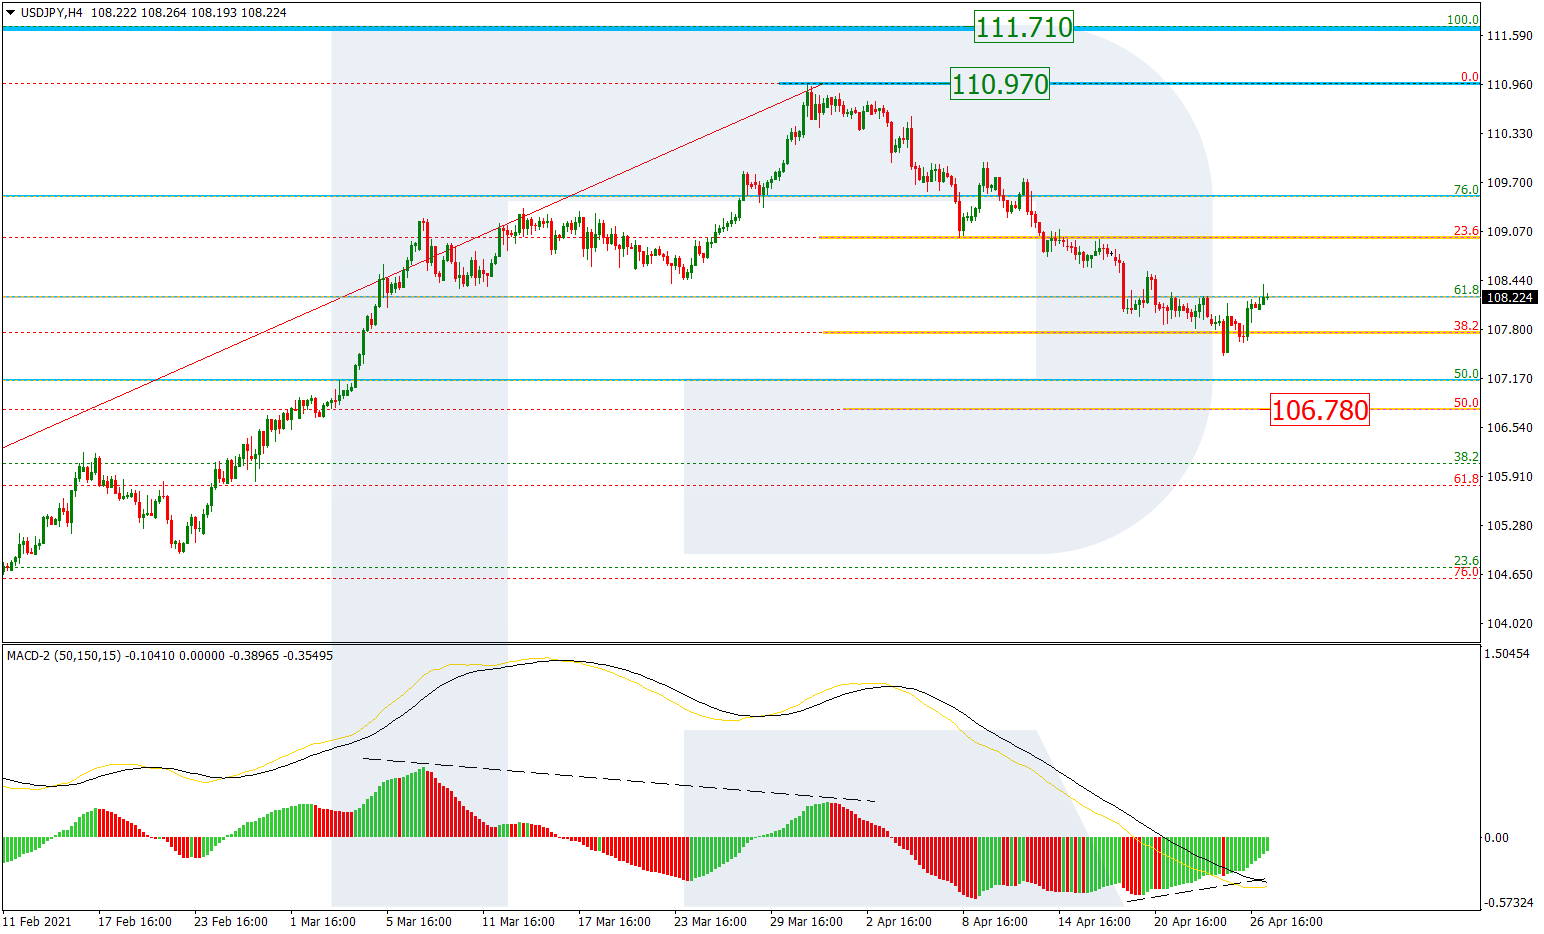
As we can see in the H4 chart, the pair is forming a steady downtrend. The price might have fallen and tested 38.2% fibo but a local convergence on MACD may indicate a new pullback or even a reversal. After the pullback, the asset may resume falling to reach 50.0% fibo at 106.78. Later, the market may complete the correction and start a new growth towards the high and the fractal high at 110.97. However, if the pair reverses, it may be heading to reach the high and the fractal high at 110.97 and 111.71 respectively.
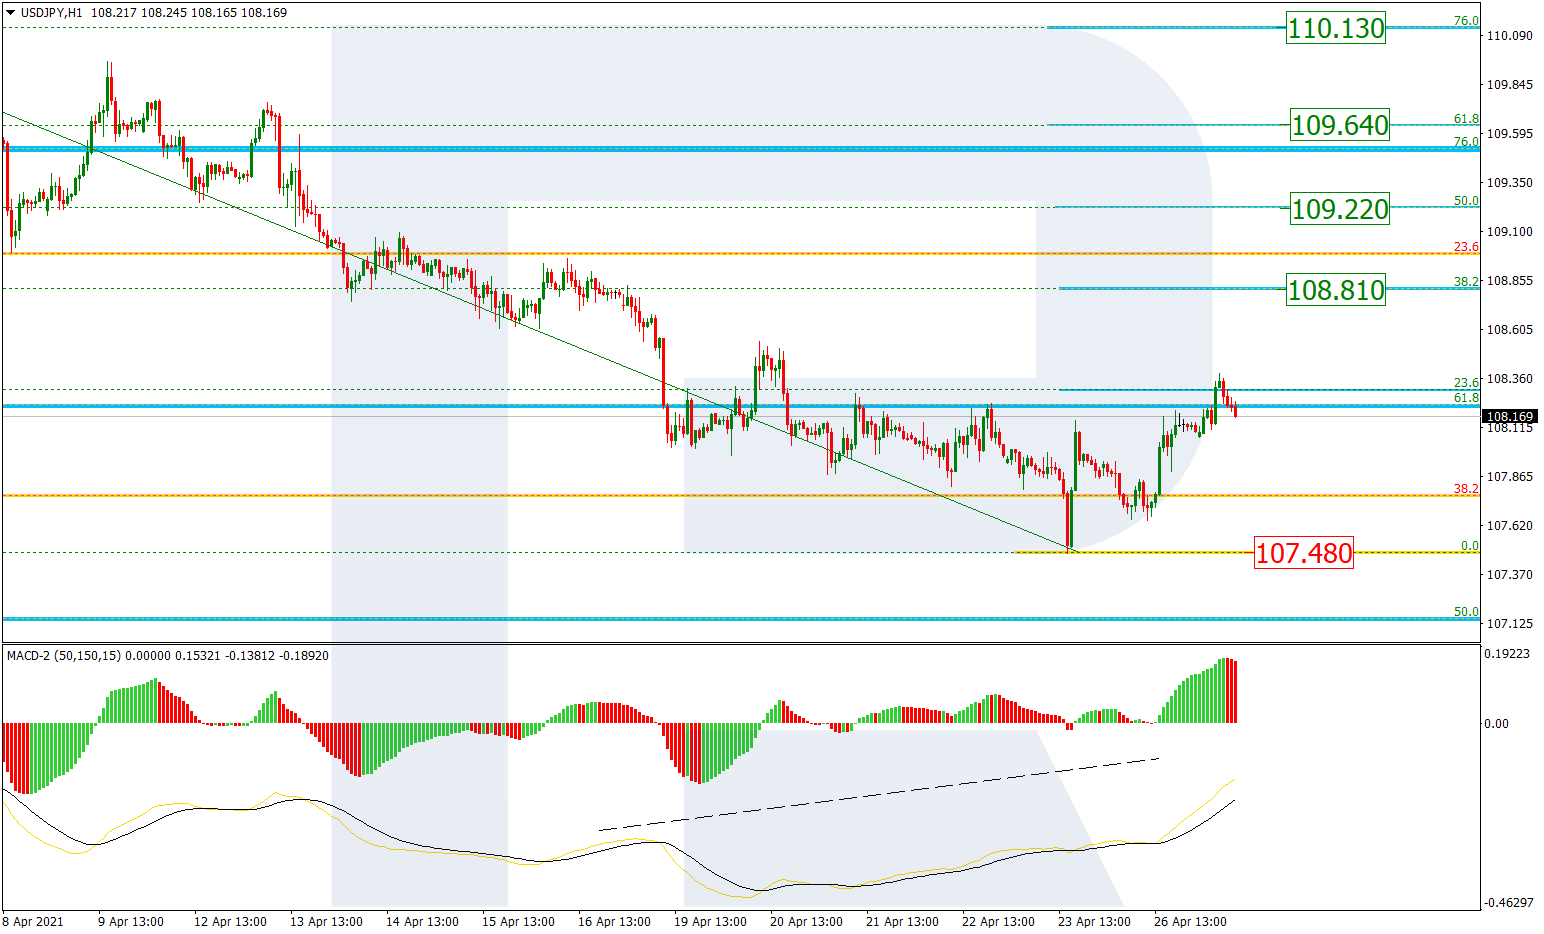
The H1 chart shows a new correctional growth after a convergence on MACD, which has already reached 23.6% fibo and may later continue towards 38.2%, 50.0%, 61.8%, and 76.0% fibo at 108.81, 109.22, 109.64, and 110.12 respectively. the support is the low at 107.48.
Article By RoboForex.com
Attention!
Forecasts presented in this section only reflect the author’s private opinion and should not be considered as guidance for trading. RoboForex LP bears no responsibility for trading results based on trading recommendations described in these analytical reviews.

- 3 Signs of Developing U.S. Economic Slowdown Apr 19, 2024
- Israel has retaliated against Iran. Investors run to safe assets Apr 19, 2024
- Gold hits record high amid growing geopolitical tensions Apr 19, 2024
- The US natural gas prices fell to a 2-month low. A drop in the technology sector on Wednesday had a negative impact on the broad market Apr 18, 2024
- Target Thursdays: Cocoa, Bitcoin and USDCHF hit targets! Apr 18, 2024
- British Pound shows signs of recovery amid favourable inflation data Apr 18, 2024
- Indices decline amid hawkish comments from the Fed. Investors are waiting for Israel’s answer Apr 17, 2024
- EURGBP: Slams into support on hot UK inflation Apr 17, 2024
- Brent crude prices dip amid concerns over global demand Apr 17, 2024
- Stock indices sell-off amid rising geopolitical tensions in the Middle East. China’s GDP grew the most in a year Apr 16, 2024