
By Dmitriy Gurkovskiy, Chief Analyst at RoboForex
On Monday, April 19th, Brent is trading without any particular direction not far from $66.50. The oil market is consolidating after a lot of news that avalanched it earlier.
The latest forecast from JP Morgan suggests an average oil price at $70 by May, which is several months earlier than it was thought before. It’s a bit against the current market conditions: the anti-coronavirus vaccination campaign around the world is not as fast as it was expected to be, but Europe may speed up the economic recovery process next to the USA. At the same time, signals from China demonstrate a slowdown in the economy after a pretty effective first quarter.
The oil supply is rising: Iran is boosting both the output and export. Alongside this, the oil output in the Permian Basin is also rising and get back to its pre-crisis levels by October.
All of this somehow is limiting prospects of the oil price growth both right now and in the mid-term.
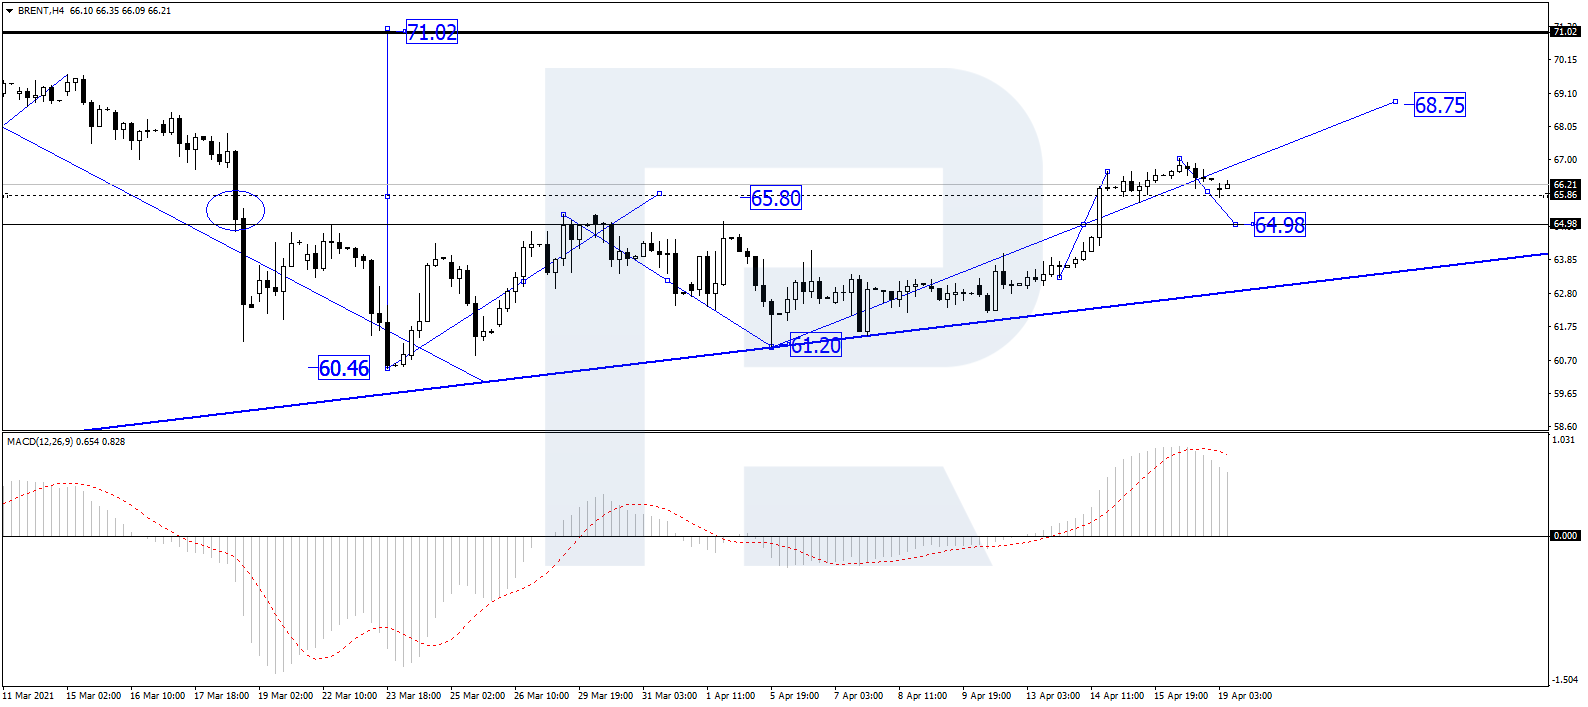
In the H4 chart, after finishing another ascending wave at 66.50, Brent is consolidating around this level. If later the price breaks this range to the upside, the market may form one more ascending structure towards 67.60 or even reach the short-term target at 68.75; if to the downside – start a new correction towards 65.00 and then resume moving within the uptrend to reach 90.00. From the technical point of view, this scenario is confirmed by MACD Oscillator: its signal line is moving outside the histogram area to grow towards 0. After that, the growth is expected to continue.
Free Reports:
 Get our Weekly Commitment of Traders Reports - See where the biggest traders (Hedge Funds and Commercial Hedgers) are positioned in the futures markets on a weekly basis.
 Sign Up for Our Stock Market Newsletter – Get updated on News, Charts & Rankings of Public Companies when you join our Stocks Newsletter
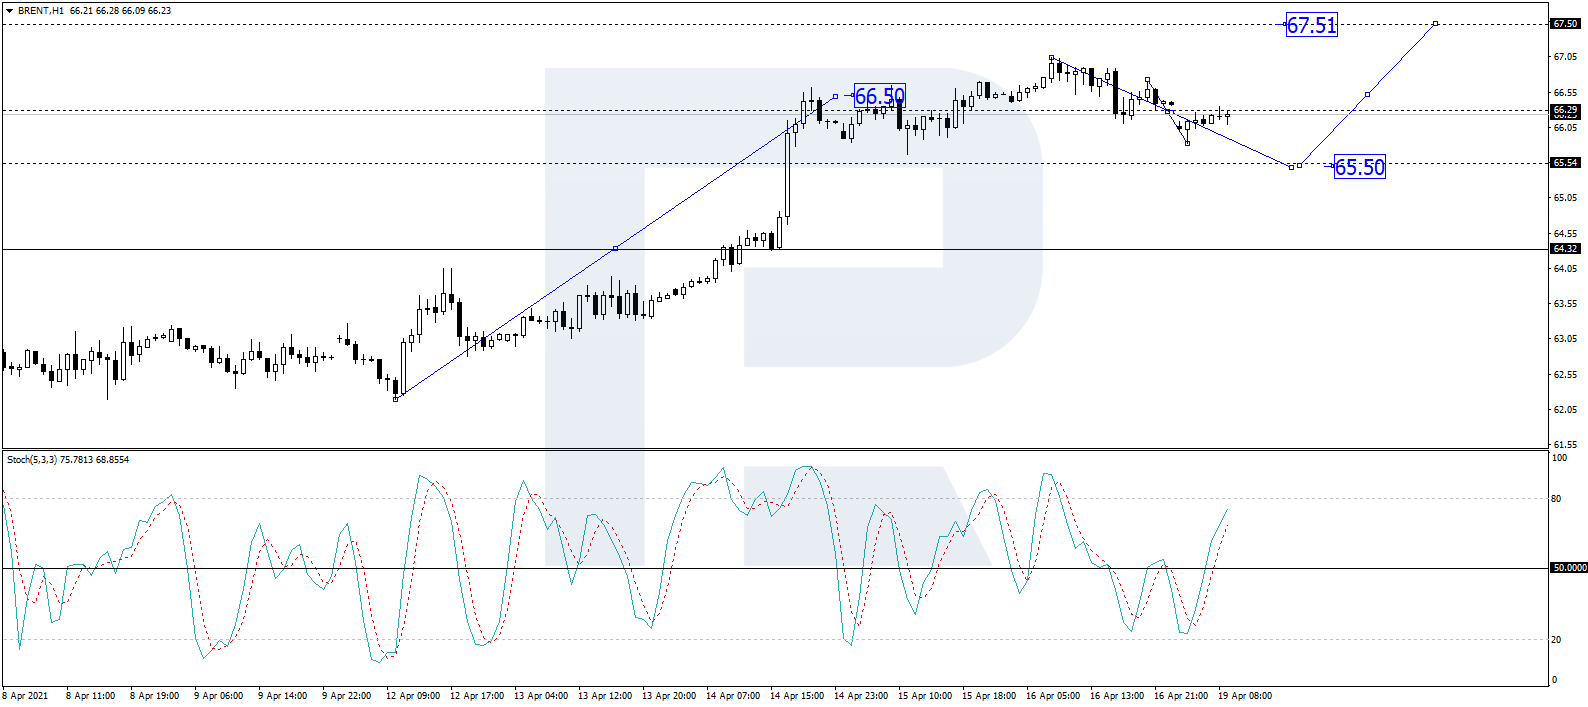
As we can see in the H1 chart, after forming another consolidation range, this time around 64.30, and breaking it to the upside, Brent has reached 66.50; right now, it is forming one more consolidation range around the latter level. Possibly, the asset may expand the range both upwards and downwards, first to 67.00 and then to 65.50, and then resume growing with the target at 67.50. From the technical point of view, this idea is confirmed by the Stochastic Oscillator: its signal line moving upwards and has already broken 50, which implies further growth towards 80.
Disclaimer
Any forecasts contained herein are based on the author’s particular opinion. This analysis may not be treated as trading advice. RoboForex bears no responsibility for trading results based on trading recommendations and reviews contained herein.

- PMI data is the focus of investors’ attention today. Turkey, Iraq, Qatar, and UAE signed a transportation agreement Apr 23, 2024
- Australian dollar rises on strong economic indicators Apr 23, 2024
- Geopolitical risks in the Middle East are declining. China kept interest rates at lows Apr 22, 2024
- Brent crude dips to four-week low amid easing geopolitical tensions Apr 22, 2024
- COT Metals Charts: Speculator bets led by Copper & Silver Apr 20, 2024
- COT Bonds Charts: Speculator bets led by 10-Year Bonds & Fed Funds Apr 20, 2024
- COT Stock Market Charts: Speculator bets led by S&P500-Mini Apr 20, 2024
- COT Soft Commodities Charts: Speculator bets led by Soybean Meal & Lean Hogs Apr 20, 2024
- 3 Signs of Developing U.S. Economic Slowdown Apr 19, 2024
- Israel has retaliated against Iran. Investors run to safe assets Apr 19, 2024